I use synthetic control to estimate what a campaign added – not just what an attribution dashboard reported. Before trusting the result, I check whether weighted, untreated markets match the campaign market’s past performance.
Why does that matter? Research cited here reports attribution overstating lift by 179% to 334% across channels. A fixed discount won’t solve that problem.
Here’s what I look for:
- A sound comparison: Past policy studies show how weighted controls estimate outcomes without an intervention.
- Clean data: Enough pre-campaign history, clear campaign dates, and untreated markets without spillover.
- Results that hold up: Good baseline fit, placebo checks, and tests with different markets and time windows.
- The right method: Synthetic control for one treated market, randomized geo tests when market assignment is possible, or difference-in-differences when parallel trends are supported.
My spending rule: <u>Use uncertainty, not just estimated lift</u>. A post-campaign sales gap is a starting point – not proof that marketing caused it.
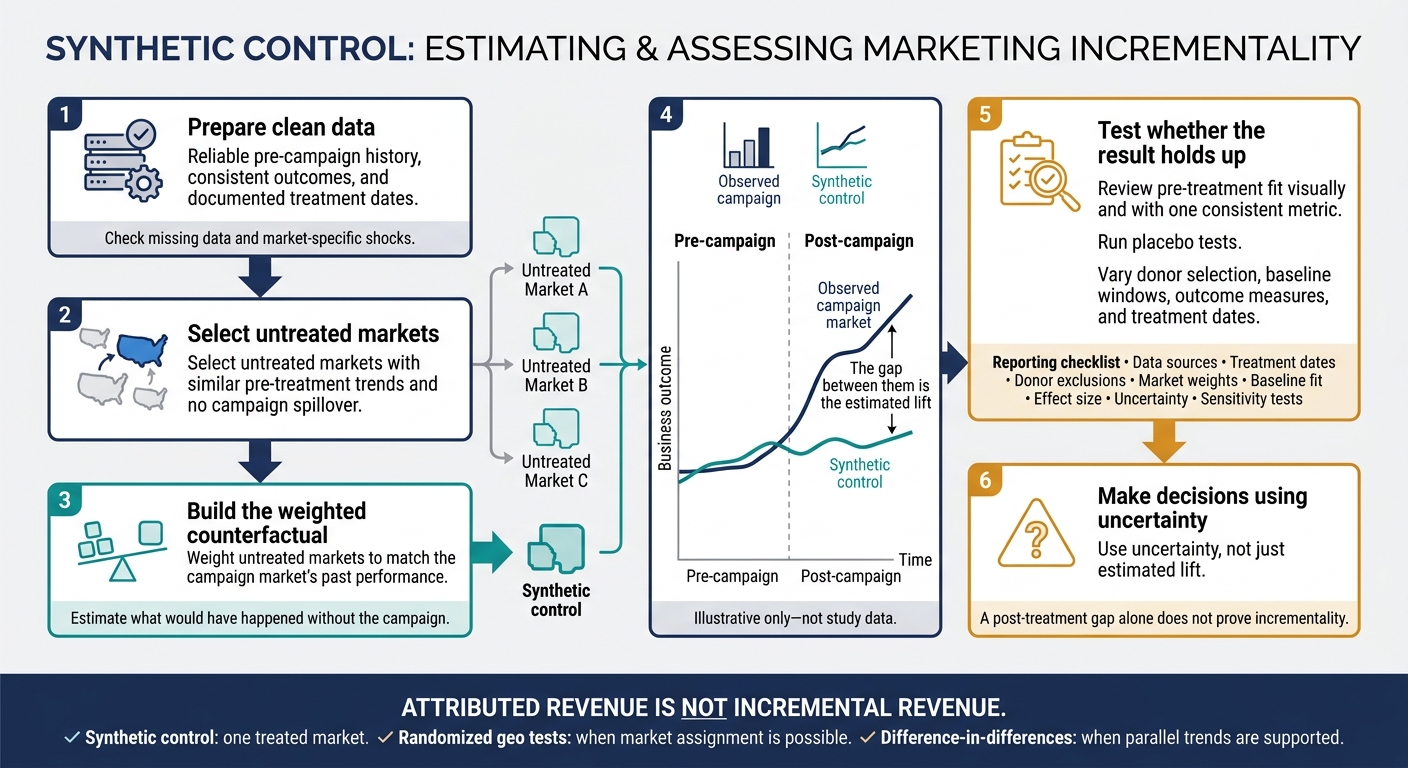
Synthetic Control: From Campaign Data to Incremental Lift
2021, Methods Lecture, Alberto Abadie "Synthetic Controls: Methods and Practice"
sbb-itb-2ec70df
Early Synthetic Control Studies
The first landmark studies showed how synthetic control could estimate what might have happened without a major policy shock.
Abadie and Gardeazabal: The Basque Country
Abadie and Gardeazabal estimated how the Basque economy would have performed without terrorism. They built a synthetic control using other Spanish regions. By the late 1990s, the Basque Country’s GDP per capita was about 10% lower than its synthetic control.
To check the method, they ran a placebo study on Catalonia, which had no terrorism. One caveat: spillovers to neighboring regions could bias the estimate. Later policy and advertising studies used the same design.
Abadie, Diamond, and Hainmueller: California’s Proposition 99
Abadie, Diamond, and Hainmueller used synthetic control to estimate how Proposition 99 affected California cigarette sales. They built a synthetic California from 38 U.S. states without comparable tobacco-control programs. This provided a baseline for comparing cigarette sales after the policy change with estimated sales without it.
The table below compares the two studies.
Early Studies: Evidence Table
| Study | Treated unit | Intervention | Donor pool | Outcome | Validation method | Limitation |
|---|---|---|---|---|---|---|
| Abadie and Gardeazabal | Basque Country | Terrorism | Other Spanish regions | GDP per capita | Placebo study on Catalonia | Spillovers to neighboring regions could bias the estimate |
| Abadie, Diamond, and Hainmueller | California | Proposition 99 | 38 U.S. states | California cigarette sales | Placebo tests in donor states | Other California-specific changes could affect cigarette sales |
Advertising Research and Incremental Lift
Marketing lift tests use the same counterfactual logic as policy studies: estimate what would have happened without the intervention.
Findings From Geographic Advertising Studies
Two summaries show why this comparison matters. In one, attribution overstated incremental lift by 179% to 334% across channels. In another, it undercounted lift by 413% for a single brand. Attribution errors can vary by both brand and channel.[1]
Researchers put this logic into practice by weighting markets to build a comparison that estimates outcomes without the campaign.
Calculating Lift With Weighted Control Markets
Synthetic control estimates incremental lift by comparing observed post-campaign outcomes with a weighted control market that matches pre-campaign trends. The gap between them is the estimated lift.
What the Research Means for Small Businesses
Don’t apply a fixed discount to attributed revenue. Instead, use geo tests with weighted controls or randomized holdouts to estimate incremental revenue, rather than relying on dashboard attribution alone.[1]
Evaluating Study Quality and Method Fit
Data Requirements and Causal Assumptions
After estimating lift, check whether the counterfactual holds up. Synthetic control depends on a clean study design: reliable pre-campaign history, consistent outcomes, and documented treatment dates. Select untreated markets with similar pre-treatment trends and no campaign spillover.
Check for missing data, spillovers, and market-specific shocks. Poor baseline fit or cherry-picked donor markets can skew results. A post-treatment gap alone does not prove incrementality.
Fit Checks, Placebos, and Sensitivity Tests
Review pre-treatment fit visually and with one consistent metric. Run placebo tests to check whether untreated markets show similar gaps.
Then test whether the results hold when you change donor selection, baseline windows, outcome measures, and treatment dates. Report data sources, treatment dates, donor exclusions, market weights, baseline fit, effect size, uncertainty, and sensitivity tests.
These checks also help determine whether synthetic control fits the task.
Comparing Synthetic Control, Randomized Geo Tests, and Difference-in-Differences
Choose the method that fits your business question and data – not the one that shows the largest apparent lift.
| Method | Assignment | Data requirements | Primary strength | Principal risk | Marketing use case |
|---|---|---|---|---|---|
| Synthetic control | Nonrandom; uses weighted controls | Strong baseline history and suitable untreated markets | Can evaluate one treated market | Poor baseline fit or treated-market shocks | Measuring a city or region’s campaign lift when randomization is impractical |
| Randomized geo tests | Markets randomly assigned | Enough markets and outcome volume for useful precision | Random assignment strengthens causal inference | Spillover and low power with few markets | Testing budget changes across geographic territories |
| Difference-in-differences | Usually nonrandom | Before-and-after outcomes and well-supported parallel trends | Compares changes across groups | Failure of the parallel-trends assumption | Evaluating a regional launch when untreated regions provide a sound comparison |
Conclusion: Applying the Research to Marketing Decisions
Synthetic control helps teams assess market-level incrementality by building a weighted counterfactual. It doesn’t automatically prove campaign lift. Each test needs a counterfactual that holds up to scrutiny.
Attributed revenue is not incremental revenue. Attribution can overstate or understate lift, so revenue shown in dashboards needs causal validation.[1] Marketing decisions should rest on study design, not the volume of attributed revenue.
Measurement Planning for Marketing Teams
Start business planning with a simple feasibility check. Confirm that you have enough pre-period market data, a clear intervention date, and a business outcome to measure, such as revenue. Check whether untreated markets can support a sound counterfactual. Then use uncertainty – not just the point estimate – to guide spending.
FAQs
How much historical data do I need for synthetic control?
You need enough historical data from untreated regions or segments to closely match your test region’s performance [1]. There’s no set time frame. Aim to cover full business cycles so you can account for seasonality [2][3].
Tests typically run from a few weeks to 90 days [1]. Use power analysis tools to find the minimum sample size needed for statistical significance, based on your metrics and expected lift [2][4].
What if no control markets match my campaign market?
Synthetic controls combine multiple untreated regions whose past performance matches your campaign market. This gives you a more accurate comparison than pairing individual markets. Growth-onomics helps businesses put these data-driven strategies into practice for reliable incrementality testing.
In programmatic advertising, you can also use ghost bidding. This logs a control event when an ad would have been served, giving you a baseline without added costs.
How do I know if estimated lift justifies more spending?
Calculate incremental Return on Ad Spend (iROAS) by dividing incremental revenue by campaign spend. An iROAS above 1.0 means added revenue exceeds ad spend, though profit also depends on other costs. Focus only on statistically significant results, typically those with a p-value of 0.05 or lower.
Watch for diminishing returns: when increasing the budget no longer produces proportional gains. Apply the Equimarginal Principle by moving budget from lower-performing channels to those with higher incremental returns. Continue shifting spend until marginal returns are balanced across your portfolio.