

Running paid social campaigns without tracking the right metrics can waste your budget. To ensure your ads deliver results, focus on these five key metrics:
- Click-Through Rate (CTR): Measures how well your ad grabs attention. A high CTR often indicates strong creative performance.
- Cost Per Click (CPC): Tracks how much you’re paying per click. Lower CPC means better cost-efficiency.
- Return on Ad Spend (ROAS): Reveals how much revenue your ads generate compared to their cost. Higher ROAS equals better profitability.
- Conversion Rate: Shows how effectively clicks turn into actions like purchases or sign-ups.
- Cost Per Thousand Impressions (CPM): Useful for gauging brand awareness and visibility.
These metrics help you optimize campaigns, reduce costs, and drive meaningful results. Whether you’re managing a small budget or a large one, tracking these numbers ensures every dollar works harder for you.
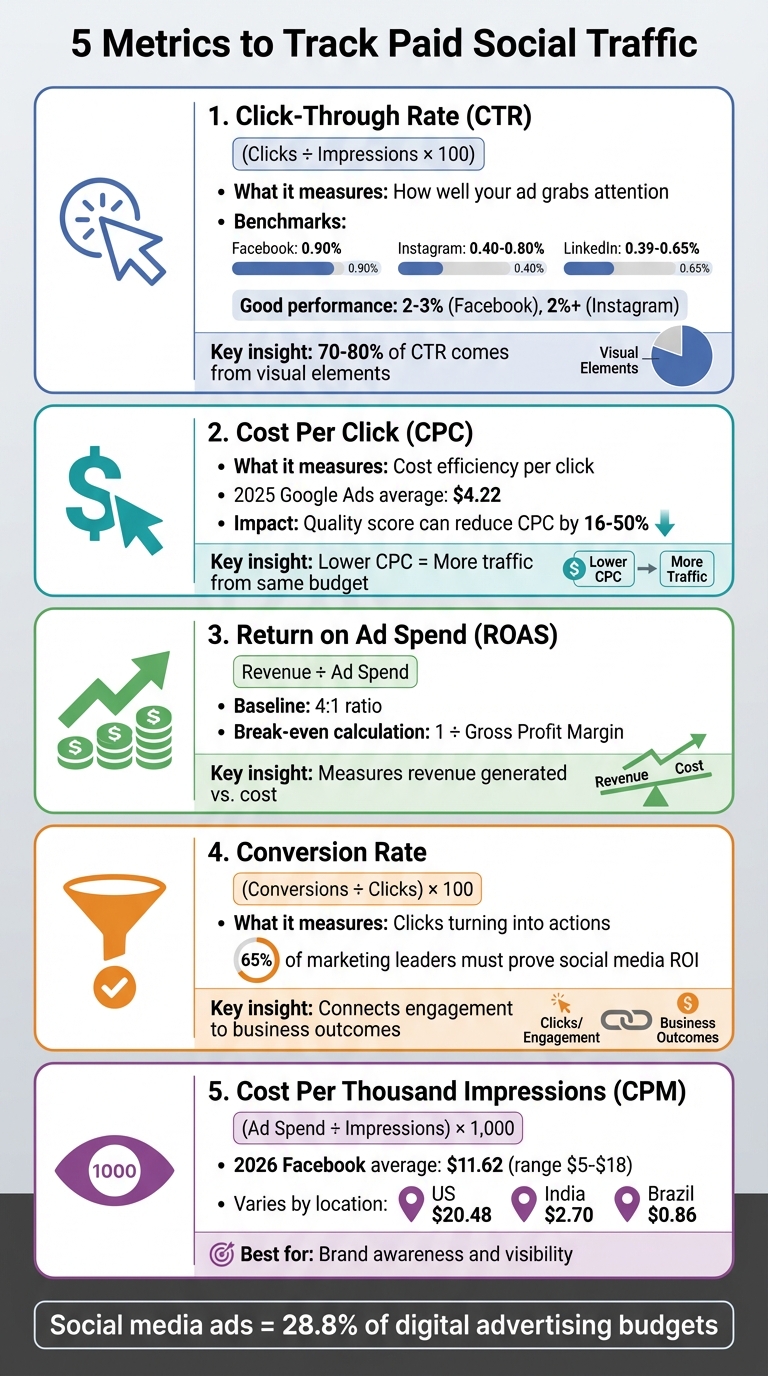
5 Essential Paid Social Traffic Metrics to Track for Campaign Success
How to Measure Social Media Performance Like a Pro
sbb-itb-2ec70df
1. Click-Through Rate (CTR)
Click-Through Rate (CTR) is a key metric that measures how effectively your ad grabs attention. It’s calculated as the percentage of people who click your ad after seeing it (clicks ÷ impressions × 100).
Insights into Ad Performance
CTR offers a clear snapshot of how well your ad creative connects with its audience. Interestingly, 70% to 80% of CTR performance comes down to visual elements. So, if your CTR is lagging, it’s likely an issue with your creative rather than your targeting. As Sam Sherman, Co-founder of Socium Media, explains:
"CTR drops are a creative signal, not a targeting problem".
To understand how your ads stack up, platform benchmarks can be a useful guide. For instance:
- Facebook ads average a 0.90% CTR.
- Instagram feed ads typically fall between 0.40% and 0.80%.
- LinkedIn ads hover around 0.39% to 0.65%.
If your Facebook ads hit 2% to 3% CTR or your Instagram ads exceed 2%, you’re outperforming the majority of advertisers.
Impact on Campaign Cost-Efficiency
Performance marketing metrics like CTR don’t just measure engagement – they also directly impact your costs. Platforms like Meta and LinkedIn reward higher engagement with lower cost-per-click (CPC). For example, a Facebook ad with a 2% CTR might cost just $0.50 per click, while an ad with a 0.5% CTR could cost over $2.00 for the same audience.
Want to boost your CTR? Using questions in your ad headlines can increase clicks by 15% to 25%. Additionally, focus on the hook – the first three seconds of a video or the main image in your ad. If CTR starts to dip, don’t waste time on small text changes. Instead, create bold new visuals and aim to have 5 to 10 fresh creative assets ready each week.
Ability to Measure Traffic Quality
While a high CTR signals interest, it’s only part of the story. Pairing CTR with conversion data helps you ensure that your clicks are driving meaningful traffic. If your CTR is high but conversions are low, it could mean your ad is attracting the wrong audience or your landing page isn’t delivering on the ad’s promise.
Be cautious with clickbait tactics. Platforms like Meta penalize ads that generate clicks but fail to engage users afterward, so it’s essential to balance attention-grabbing content with real value.
2. Cost Per Click (CPC)
Cost Per Click (CPC) tells you exactly how much you’re paying each time someone clicks on your ad. It’s a simple yet powerful way to gauge whether your ad spend is effectively driving traffic or just draining your budget.
Impact on Campaign Cost-Efficiency
Let’s break it down: if your CPC is $2.00 and you have a $1,000 budget, you’ll get around 500 visitors. Now, if you manage to cut that CPC in half, your traffic doubles. On platforms like Google Ads, your CPC is influenced heavily by your quality score. A strong score can reduce your CPC by anywhere from 16% to 50%, while a weak one can send it soaring by 25% to 400%.
As of 2025, the average CPC on Google Ads hovered around $4.22, but this number can vary wildly depending on your industry. For example, legal services might see CPCs as high as $50, while e-commerce often averages closer to $1.
Insights into Ad Performance
CPC acts as a real-time barometer for how well your ads are performing. If you notice a sudden spike in CPC, it could mean your ad’s relevance is dropping or competition is heating up. On the flip side, a falling CPC might indicate that your ad is hitting the mark with your audience.
How can you keep CPC low? Start with your landing pages. They should load quickly and deliver exactly what your ad promises – this can improve your quality score . A/B testing your ad creatives is another smart move; better click-through rates (CTR) often lead to lower CPCs.
"A low CPC means little if the clicks don’t lead to meaningful actions".
This makes CPC more than just a cost metric – it’s a tool for fine-tuning your campaigns to align with your business goals.
Alignment with Business Objectives
CPC is especially useful when your main focus is driving traffic or generating leads, rather than just raising brand awareness . It’s a key metric for assessing how effectively you’re spending your ad budget. By keeping a close eye on CPC, you can identify underperforming campaigns and shift resources to the ones delivering results .
Here’s a valuable insight: targeting broadly might lower your CPC, but narrow targeting – while often more expensive – can bring in higher-quality traffic. For instance, paying $3.50 per click with a 10% conversion rate is far more worthwhile than paying $0.75 per click with only a 1% conversion rate.
"CPC helps you understand how competitive your bids are, and CPA shows whether your campaigns are profitable once clicks turn into actual outcomes".
3. Return on Ad Spend (ROAS)
ROAS, or Return on Ad Spend, builds on cost and engagement metrics to reveal how effectively your ad spend translates into revenue. It’s calculated as the ratio between ad costs and the revenue generated from those ads. For instance, if you spend $1,000 on Facebook ads and pull in $4,000 in revenue, your ROAS is 4:1. This ratio is often seen as a solid baseline for performance.
Measuring Traffic Quality
ROAS isn’t just about revenue; it helps distinguish between customers who bring lasting value and those driven mainly by discounts. A high ROAS from heavy discounting may look good, but it can hide a deeper issue: attracting price-sensitive shoppers who disappear after the sale.
Take the example of Maurice Rahmey, co-founder of Disruptive Digital. In 2021, he ran a split test for a consumer packaged goods client struggling with discount dependency. A $99 offer without a gift card, though it showed a lower immediate ROAS compared to a $90 offer, resulted in 20% higher lifetime value within just two weeks. This demonstrates how a lower upfront ROAS can sometimes lead to greater long-term profitability.
This insight into customer value can also guide smarter spending strategies, such as performing a Google Ads audit to identify and eliminate wasted spend.
ROAS and Campaign Cost-Efficiency
ROAS is a key metric for identifying your break-even point – the minimum return needed to cover variable costs and avoid losses. To calculate your break-even ROAS, divide 1 by your gross profit margin. For example, if your margin is 50%, your break-even ROAS is 2.0.
"ROAS can lie if your margins vary, so add profit: Profit = (Revenue x Gross margin) – Spend." – Olivia Parker, Influencer Analytics Specialist
ROAS targets vary by business model. For consumables or other high-frequency purchases, a lower initial ROAS might work because of rapid reorders. On the other hand, businesses selling one-time purchases, like furniture, often need a higher upfront ROAS to avoid prolonged losses.
Aligning ROAS with Business Goals
ROAS works best when aligned with your business’s unique goals. Don’t chase industry averages. Instead, set ROAS targets that reflect your profit margins, product complexity, and long-term strategy. For some businesses, a ROAS of 3.5X might be enough for profitability, while others may need a ROAS between 12X and 15X to sustain growth.
ROAS also helps pinpoint which creatives, audiences, and platforms deserve more budget – and which ones need adjustments. Pair it with metrics like average order value and conversion rate to get a fuller picture of your revenue performance. Like CTR and CPC, ROAS provides actionable insights to fine-tune your ad strategy. And with 94% of business leaders agreeing that social media data improves revenue and decision-making, it’s clear that tracking the right metrics is essential for success.
4. Conversion Rate from Paid Social Traffic
When it comes to measuring success, conversion rate is a critical metric that connects ad engagement to real, measurable outcomes. This rate is calculated by dividing the number of conversions by clicks or landing page views, then multiplying by 100. It’s a direct indicator of whether your paid social ads are reaching the right audience. For instance, if you notice a high click-through rate but a low conversion rate, it could signal that your traffic lacks intent.
Gauging Traffic Quality
Conversion rate goes beyond surface-level metrics like likes or follows – it evaluates meaningful actions, such as purchases or sign-ups. If your ads are generating clicks but not conversions, it might mean your audience targeting is off.
Another possibility? Your landing page could be the culprit. Check for issues like slow loading times, form errors, or poor mobile optimization. These factors often discourage users from completing the desired action.
Boosting Campaign Cost-Efficiency
Your conversion rate plays a big role in determining your cost per acquisition (CPA) and overall campaign efficiency. By lowering conversion costs, you can stretch your ad budget further. As you scale campaigns, keep an eye on metrics like frequency and landing page conversion rates to avoid oversaturating your audience. Focus on final conversion events, like completed purchases, instead of just top-of-funnel activities. This ensures your budget supports actions that directly contribute to business growth.
Tying Metrics to Business Goals
Tracking your conversion rate is essential for connecting social media performance to your company’s bottom line. It’s also a key metric for gaining leadership approval and demonstrating the value of your ad spend. In fact, 65% of marketing leaders say they need to prove how social media aligns with business objectives to secure buy-in. Considering that social media ads make up 28.8% of all digital advertising budgets, monitoring conversions ensures your investments are driving meaningful results.
5. Cost Per Thousand Impressions (CPM)
Cost Per Thousand Impressions (CPM) reflects how much you’re paying for every 1,000 ad impressions. To calculate it, divide your total ad spend by the number of impressions, then multiply by 1,000. This metric is especially useful when your focus is on brand awareness and visibility rather than immediate clicks or conversions.
Impact on Campaign Cost-Efficiency
CPM helps you forecast costs and scale your reach effectively. In 2026, the average CPM for Facebook ads is projected at $11.62, with typical costs ranging from $5.00 to $18.00. However, these numbers can vary widely – Fintech averages $19.35, while Retail can drop as low as $1.38. Location also plays a big role: the United States averages $20.48, compared to $2.70 in India and just $0.86 in Brazil.
To get the most out of your budget, consider using viewable CPM (vCPM), which charges only for ads that are actually seen, not those scrolled past. Timing can also make a difference – launching campaigns in Q3 or midweek often results in lower CPMs compared to Q4 or weekends. Additionally, ad quality has a huge impact: high-quality ads can cut costs by 16% to 50%, while poor-quality ads can drive costs up by as much as 400%. These strategies can significantly improve your campaign’s cost-efficiency and set the stage for deeper performance analysis.
Insights into Ad Performance
CPM, when analyzed alongside other metrics, can reveal crucial insights about your campaign’s performance. For example, if CPM rises but your reach remains flat, it’s a sign of increased auction competition. Similarly, a rising CPM coupled with higher frequency (impressions divided by reach) and lower engagement often points to ad fatigue – your audience is seeing the same ad too often without responding. To combat this, rotating your ad creatives is key. As Olivia Parker, Influencer Analytics Specialist at InfluencerDB, explains:
"If frequency rises above your historical comfort zone and CTR drops week over week, refresh your creative before adjusting targeting".
On the other hand, if your CPM remains stable but conversion rates drop, the issue likely lies with your landing page or offer, not your ad visibility. These insights make CPM a critical tool for diagnosing and fine-tuning your campaigns, whether the problem lies in creative, targeting, or post-click performance.
Alignment with Business Objectives
CPM is particularly effective for campaigns aimed at building brand recognition or introducing new products. It’s the go-to metric for top-of-funnel strategies designed to reach as many relevant people as possible. With social media commanding a large share of digital ad budgets, mastering CPM efficiency can help you stretch your dollars further. By connecting CPM-driven exposure to downstream actions through analytics, you can measure the long-term impact of your awareness campaigns.
Conclusion
Focusing on the right metrics can transform your social media strategy from chasing likes and followers to uncovering insights that drive revenue. As Angie Tran, Content Marketing Manager at AdRoll, explains:
"The number one mistake that many marketing amateurs make is focusing on chasing after these vanity social media metrics".
These metrics go beyond surface-level performance, offering a deeper understanding of what truly contributes to revenue growth. They not only measure success but also allow for real-time budget adjustments. Without this tracking, you risk spending money on ads that fail to deliver results. In fact, 65% of marketing leaders are required to demonstrate how social media supports specific business objectives to secure leadership approval and budget. Tracking these metrics enables you to spot underperforming ads quickly and reallocate funds to campaigns that deliver a stronger return on investment.
A comprehensive understanding emerges when you combine ad platform data with web analytics. Ad platforms provide details like impressions and clicks, while tools like Google Analytics reveal on-site behavior and conversions. To ensure accurate tracking, use UTM parameters on all paid social links. This allows you to attribute traffic and conversions to specific campaigns, giving you a clearer view of the customer journey across multiple touchpoints. This unified approach helps you connect the dots from initial engagement to final conversion.
For businesses looking to optimize their paid social campaigns, Growth-onomics offers specialized expertise in performance marketing and data analytics. Their data-driven strategies help businesses make informed decisions and get the most out of their marketing budgets.
FAQs
What’s a good CTR for my industry?
A good click-through rate (CTR) for paid social campaigns usually ranges from 1% to 5%. Campaigns that perform exceptionally well often land in the 2% to 5% range. However, it’s important to note that these figures can shift based on your industry and the audience you’re targeting.
How do I pick the right ROAS target?
To determine the right ROAS (Return on Ad Spend) target, start by looking at industry benchmarks, your specific campaign goals, and past performance data. A common rule of thumb is to aim for a 3:1 ratio, meaning you earn $3 for every $1 spent. However, this can vary depending on your sector and what you’re trying to achieve.
It’s also helpful to keep an eye on related metrics like conversion rate and cost per acquisition (CPA). These figures can give you a clearer picture of how your campaigns are performing and help you fine-tune your ROAS target to boost profitability.
Why are clicks high but conversions low?
High clicks but low conversions often point to problems like ineffective ad creative, targeting an audience that’s too broad, or a landing page that isn’t doing its job. A landing page might fail if it doesn’t align well with the ad or offers a frustrating user experience, both of which can push visitors away before they take action. To boost conversions, work on tightening these elements and ensuring they’re all in sync.