


I found no verified 2026 average revenue-return benchmark in the available research. My advice: set your campaign costs, profit target, and tracking window before using any benchmark to judge results.
As of October 15, 2026, the research reports that 46% of brands track conversions, up 11.6 percentage points year over year. But tracking sales isn’t the same as proving profit.
Here’s how I’d use the findings:
- Compare like with like: Match the channel, audience, creator size, campaign goal, and measurement window.
- Keep revenue separate from profit: Include creator fees, product costs, and other campaign spending.
- Treat ad benchmarks as proxies: The reported $4.37 CPM and 0.98% CTR are social ad figures – not confirmed influencer benchmarks.
- Measure beyond engagement: Track awareness, clicks, sales, and repeat purchases based on your goal.
For U.S. small businesses, my takeaway is simple: <u>test audience fit first</u>, then scale only when results meet your margin target.
Average Returns and Research Methods
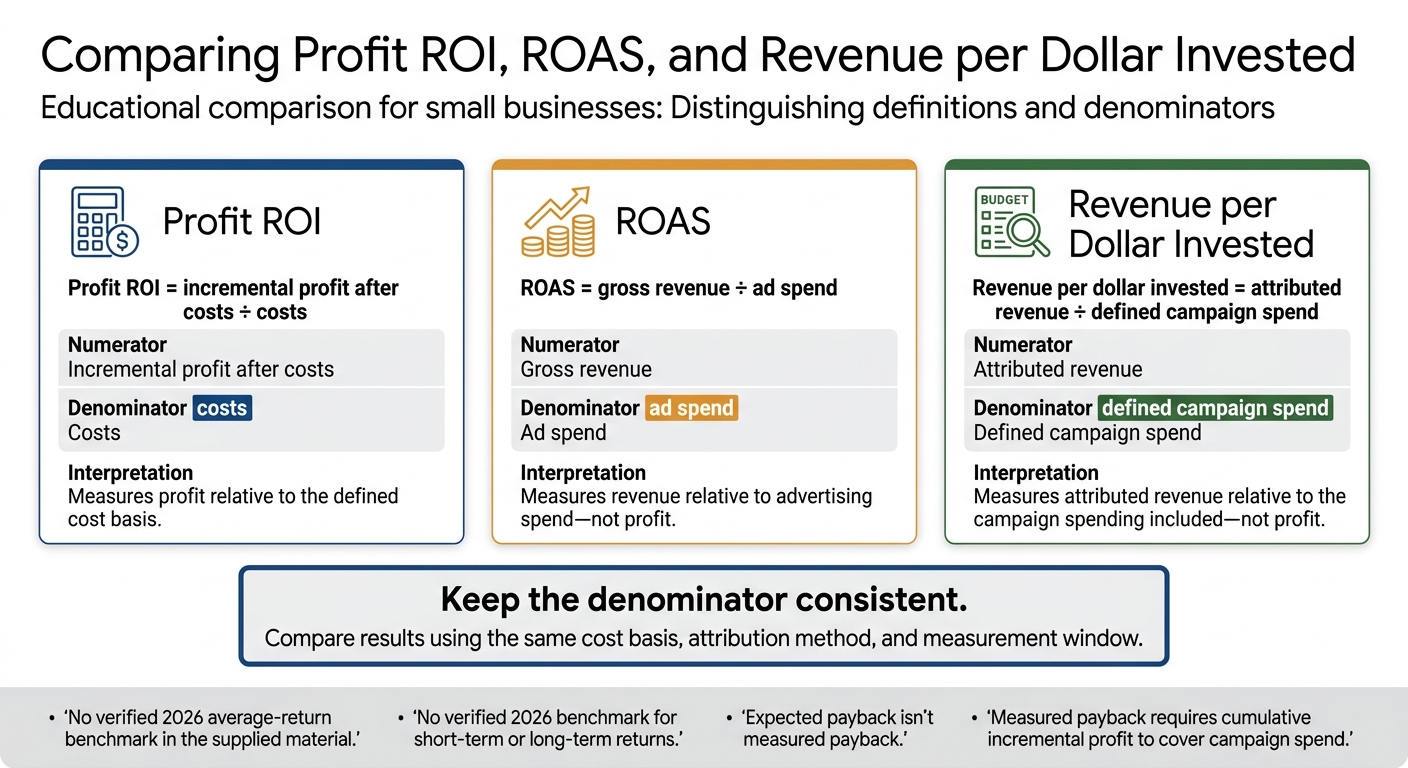
Influencer ROI vs. ROAS: Know Your Return Metrics
Return metrics measure different things. Keep the denominator consistent so comparisons use the same cost basis.
- Profit ROI = incremental profit after costs ÷ costs.
- ROAS = gross revenue ÷ ad spend.
- Revenue per dollar invested = attributed revenue ÷ defined campaign spend.
The sections below separate these return types and identify gaps in the available 2026 evidence.
Revenue per Dollar Invested
The available material contains no verified 2026 average-return benchmark. Don’t report a dollar-return figure without details on the sample, market, attribution method, and measurement window.
Short-Term and Long-Term Results
The available material contains no verified 2026 benchmark for short-term or long-term returns. Don’t split results by time horizon unless the measurement window is documented.
Payback Expectations vs. Measured Returns
Available evidence does not verify a payback rate. Expected payback isn’t measured payback: cumulative incremental profit must cover campaign spend.
Set a baseline before launch. Then track spending, attributed sales, and profit over a stated measurement window.
The next benchmarks cover channel and creator-size performance, where 2026 evidence is available, rather than an unverified average-return figure.
Benchmarks by Channel and Creator Size
Engagement Rates and CPM by Channel
2026 studies don’t support a single benchmark for engagement or CPM. Results depend on the industry, content format, and paid amplification.
In one 2026 dataset, Higher Education leads TikTok engagement at 7.36%, while Retail leads Instagram. The excerpt does not confirm a YouTube-wide benchmark.
Smaller creators can also help budgets go further – when their audience matches the offer. For SMBs, audience fit and conversion intent should guide channel choice, not CPM alone.
Revenue per Dollar by Creator Size
The source material highlights micro-influencers (10,000–100,000 followers) as cost-efficient. But the excerpt offers no comparable, verified revenue-per-dollar figures for nano, mid-tier, or macro creators.
Use smaller creators to test niche customer acquisition, and assess ROI based on audience fit, industry, and campaign goal.
Metrics by Campaign Goal
Match each metric to the campaign’s goal, and apply the same attribution rules within each goal. The available research doesn’t include comparable 2026 influencer benchmarks for all five goals. The rows below are measurement frameworks, not findings.
| Goal | Primary metrics | Proxy benchmark | Measurement window | Evidence type |
|---|---|---|---|---|
| Awareness | Reach, impressions, video completion, CPM | $4.37 average CPM – proxy social ad benchmark [1] | Campaign period; compare with a matched pre-campaign period. | Reported social ad benchmark; proposed measurement framework |
| Engagement | Saves, shares, comments, engagement rate, cost per engagement | Comparable influencer range unavailable in current published sources | Use the same post-age cutoff for all creators. | Proposed measurement framework |
| Traffic | Clicks, CTR, landing-page sessions, cost per visit | 0.98% average CTR – proxy social ad benchmark [1] | Campaign period; add a post-campaign window if attribution is delayed. | Reported social ad benchmark; proposed measurement framework |
| Conversion | Tracked revenue, conversion rate, customer acquisition cost, ROAS, contribution-margin ROI | Comparable influencer range unavailable in current published sources | Match the purchase window to the sales cycle; report delayed sales separately. | Proposed measurement framework |
| Retention | Repeat purchases, subscription retention, customer lifetime value (CLV) | Comparable influencer range unavailable in current published sources | Follow acquisition cohorts through repeat-purchase or renewal cycles. | Proposed measurement framework |
Measuring Awareness, Engagement, and Traffic
Use reach and impressions to measure awareness. Apply the same definition of video completion across creators.
State the denominator for every rate. Follower-based engagement rate divides defined interactions by followers. Reach-based and impression-based rates use different denominators, so you can’t swap one for another. Specify whether interactions include saves, shares, comments, and likes, then use those same interactions to calculate cost per engagement.
For traffic, divide clicks by impressions to calculate CTR. Calculate cost per visit using attributed landing-page sessions, and keep creator-attributed visits separate from total campaign traffic. Use tagged links and consistent attribution rules.
Measuring Conversions, Profit, and Retention
Match your measurement window to the sales cycle and account for your margin structure. Track revenue after discounts and returns. State the base used for conversion rate, such as attributed sessions. Calculate customer acquisition cost using new customers, not all orders.
ROAS divides attributed revenue by ad spend. If you include all influencer campaign costs in the denominator, call the metric revenue per campaign dollar instead.
Contribution-margin ROI = [(attributed revenue − variable costs − campaign costs) ÷ campaign costs] × 100%.
Don’t count the same cost twice. Set profit and retention targets around your margins, accounting for creator fees, production, product costs, amplification, and measurement costs where applicable.
Track repeat purchases and subscription retention by acquisition cohort. Label CLV as observed or projected.
Conclusion: Using Benchmarks for SMB Campaigns
Benchmarks are reference points. Compare results only against evidence that matches your audience, channel, and measurement method.
Define Costs and Measurement Windows
Use the channel and goal benchmarks above to keep revenue separate from profit. Your budget should cover creator fees, product costs, shipping, production, usage rights, agency fees, and paid amplification. Assess profit after accounting for costs and margins. Engagement alone does not prove profit.
Set campaign and follow-up windows before launch. Keep attribution methods and measurement windows consistent so you can compare results. Short reporting windows can miss purchases that happen later. These choices set the baseline for campaign decisions.
Plan Tests Around Audience Fit and Margins
For SMB tests, audience fit matters more than creator size alone. Smaller creators may suit niche audiences, but check total costs before assuming they’ll save you money.
Scale only when results meet your margin target.
FAQs
How do I set an ROI target without reliable benchmarks?
Build your baseline by tracking performance over time, with month-over-month growth trends as your main guide. For your first projections, use general 2026 industry averages, such as $5.78 returned for every $1.00 spent on influencer marketing.
At Growth-onomics, we recommend setting SMART goals before your campaign starts. That could mean aiming for a 5% engagement rate or a specific revenue target.
How can I tell if influencer sales are truly incremental?
Go beyond basic attribution. Set baseline metrics before the campaign, then give each creator their own UTM parameters and personalized discount codes to track their direct impact.
Set custom attribution windows – such as 7, 14, or 30 days – to account for delayed conversions. Combine CRM data with influencer performance metrics to see which channels drive customer behavior, rather than just taking credit for traffic you already had.
How much data do I need before scaling a campaign?
Before scaling, collect enough data to get statistically significant performance metrics you can act on. Start testing with $10–$20 per day for 7 days [1].
Keep your attribution window consistent – 7, 30, or 90 days – so you can compare results. Aim for roughly 300 monthly conversions to confirm that tracking is stable [2]. Growth-onomics helps connect data sources and fine-tune strategies, giving you reliable performance analytics to guide scaling decisions [3][4].