
TikTok ad campaigns can deliver impressive results – if you know which metrics to track. With over 400 metrics in TikTok Ads Manager, it’s easy to get overwhelmed. But focusing on key performance indicators (KPIs) like reach, engagement, and conversions can help you optimize your campaigns and avoid wasting ad spend.
Here’s what you need to know:
- Engagement is TikTok’s strength: The platform’s average engagement rate is 4.07%, far higher than Instagram’s 1.22%.
- Costs are competitive: TikTok’s median CPC is $0.50, making it up to 70% cheaper than Instagram ads.
- Creative matters most: Ads that grab attention in the first six seconds perform better and benefit from lower CPMs.
- Attribution is tricky: Traditional last-click models miss 79% of TikTok conversions. Multi-touch attribution reveals the platform’s true ROI.
The key to TikTok success lies in tracking the right metrics, refreshing content every 3–7 days to combat ad fatigue, and using attribution models that reflect TikTok’s unique user behavior. By aligning delivery, engagement, and conversion data, you can confidently scale campaigns and boost profitability through expert performance marketing strategies.
The Only Metrics That Matter for TikTok Ads
If you’re looking to scale these results, partnering with a performance marketing agency can help optimize your ad spend and creative strategy.
sbb-itb-2ec70df
Key TikTok Ads Metrics Explained
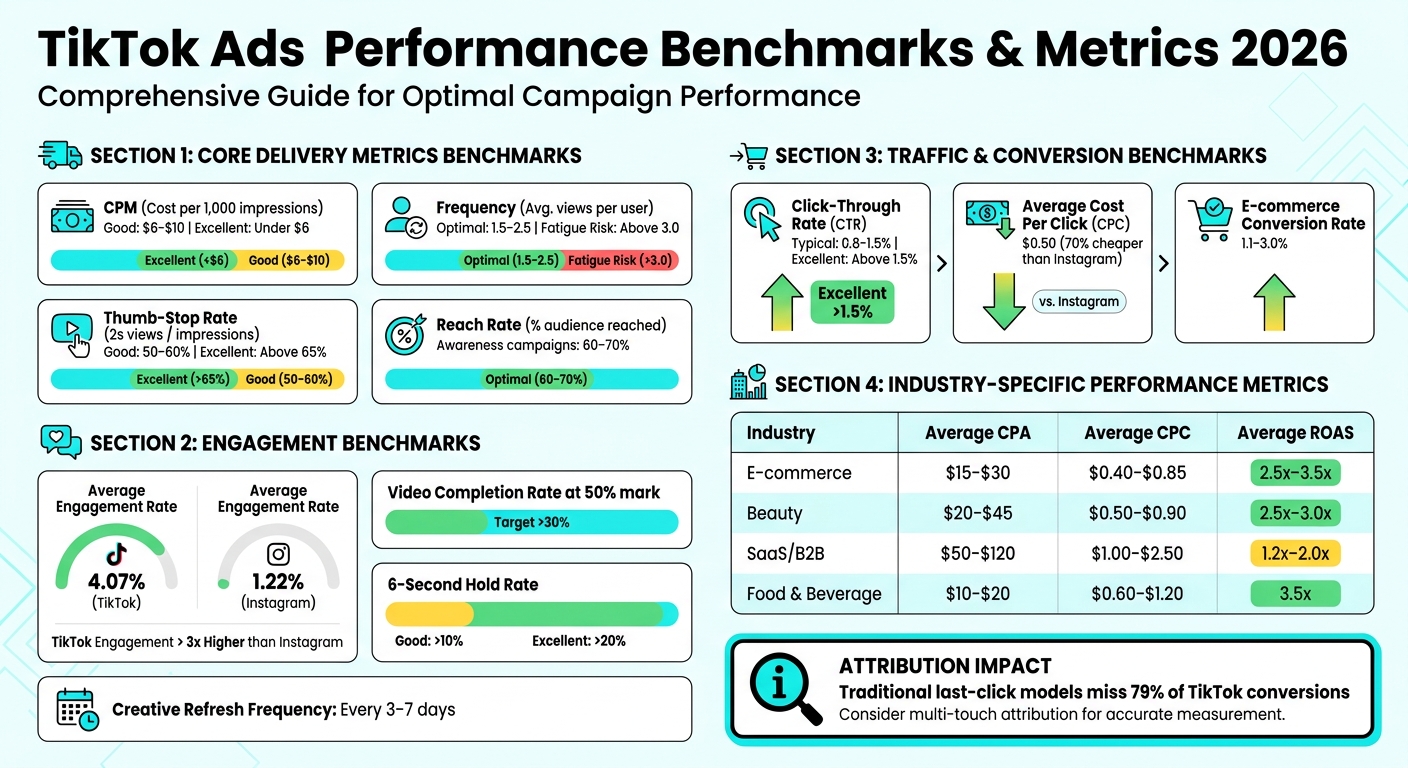
TikTok Ads Performance Benchmarks 2026: Key Metrics by Industry
Understanding TikTok’s key metrics is crucial for refining your ad campaigns and improving overall performance. TikTok Ads Manager provides a range of metrics, but the most important ones fall into three categories: delivery, engagement, and conversion. By breaking these down, you can identify what’s working and where adjustments are needed.
Core Delivery Metrics
Delivery metrics focus on how your ads are being shown to users.
- Impressions measure how often your ad appears on a user’s screen, reflecting visibility and campaign size.
- Reach counts the unique users who saw your ad at least once, showing the scope of your audience.
- Frequency tracks how often the same user sees your ad. A weekly frequency between 1.5 and 2.5 is ideal, while anything above 3.0 may signal ad fatigue, leading to reduced engagement and higher costs.
Another key metric is CPM (Cost per Mille), which calculates the cost of 1,000 impressions. As of 2026, a "good" CPM ranges between $6 and $10, while anything under $6 is considered excellent. If you notice rising CPMs and lower click-through rates, it’s likely a creative issue rather than a problem with the auction process.
TikTok also monitors the Thumb-Stop Rate, which is the percentage of 2-second views compared to impressions. A rate between 50% and 60% is acceptable, but anything above 65% indicates a strong opening hook. If your rate drops below 50%, the first few seconds of your video may need improvement.
| Metric | Definition | 2026 Benchmark |
|---|---|---|
| CPM | Cost per 1,000 impressions | Good: $6–$10 / Excellent: Under $6 |
| Frequency | Average views per unique user | Optimal: 1.5–2.5 / Fatigue Risk: Above 3.0 |
| Thumb-Stop Rate | 2-second views ÷ impressions | Good: 50–60% / Excellent: Above 65% |
| Reach Rate | Percentage of target audience reached | Awareness campaigns: 60–70% |
Engagement and Video Metrics
Engagement metrics focus on how users interact with your ad. These include Clicks, Likes, Comments, Shares, Video Views, and Engagement Rate. TikTok’s average engagement rate of 4.07% is significantly higher than Instagram’s 1.22%. However, high engagement doesn’t always mean high conversions – a video might attract attention without driving clicks if it lacks a clear call-to-action.
Metrics like Video Completion Rate and Average Watch Time help identify where viewers lose interest. TikTok breaks views into quartiles (25%, 50%, 75%, and 100%) to pinpoint creative issues. For direct response ads, aim for a completion rate of over 30% at the 50% mark.
The 6-second view is another critical measure, as TikTok uses it to gauge engaged viewing. A hold rate above 10% is good, while rates over 20% are excellent. This metric often predicts conversion performance better than total views. Keep in mind that creative fatigue on TikTok sets in faster than on Meta, often requiring ad updates every 3 to 7 days to maintain effectiveness.
"On TikTok Ads, cost efficiency is tied directly to engagement quality – highlighting that effective creative is key to cost efficiency." – Two Minute Reports
Traffic and Conversion Metrics
Conversion metrics reveal the direct business results of your campaigns.
- Click-Through Rate (CTR) measures the percentage of users who click your ad after seeing it. For in-feed ads in 2026, a CTR between 0.8% and 1.5% is typical, with anything above 1.5% being excellent.
- Cost Per Click (CPC) on TikTok averages around $0.50, which is lower than many other platforms.
- Conversion Rate (CVR) tracks the percentage of users completing a desired action, such as a purchase or form submission. E-commerce conversion rates on TikTok generally range from 1.1% to 3.0%.
Metrics like Cost Per Acquisition (CPA) and Return on Ad Spend (ROAS) are vital for measuring profitability. For example, e-commerce and beauty brands often aim for a ROAS between 2.5x and 3.5x.
Here’s a real-world example: In 2025, a beauty brand spending $50,000 monthly on TikTok initially reported a 1.2x ROAS using last-click attribution. After switching to a multi-touch attribution model with a 7-day post-view window, their true ROAS jumped to 2.8x. They also discovered TikTok-acquired customers had a 35% higher 90-day Lifetime Value. This insight led them to increase their TikTok budget by 75%, resulting in a 28% boost in overall business growth.
| Industry | Average CPA | Average CPC | Average ROAS |
|---|---|---|---|
| E-commerce | $15–$30 | $0.40–$0.85 | 2.5x–3.5x |
| Beauty | $20–$45 | $0.50–$0.90 | 2.5x–3.0x |
| SaaS / B2B | $50–$120 | $1.00–$2.50 | 1.2x–2.0x |
| Food & Beverage | $10–$20 | $0.60–$1.20 | 3.5x |
"In 2025, we’re finding that post-view conversions account for 35-50% of TikTok’s total conversion value. Ignoring these means significantly undervaluing your TikTok ROI." – Fluxion Digital
These metrics provide a complete picture of your campaign’s journey, from initial exposure to final action, helping you fine-tune for maximum impact.
How to Measure and Optimize TikTok Ads Performance
Tracking metrics is only part of the equation; the real challenge is identifying which ones actually drive revenue. Many advertisers fall into the trap of chasing flashy numbers that look good on paper but don’t translate into profit. Meanwhile, others overlook critical signs that could save their campaigns from failure.
Vanity vs. Performance Metrics
Not all metrics are created equal. Vanity metrics – like total impressions, views, and likes – may look great in reports, but they rarely indicate actual business success.
On the other hand, performance metrics – such as conversions, Cost Per Acquisition (CPA), Return on Ad Spend (ROAS), and Gross Merchandise Value (GMV) – provide a direct view of profitability. For instance, a campaign with 10,000 views, a 3% conversion rate, and a 4.5x ROAS is far more effective than one with 500,000 views but a 0.2% conversion rate.
The process follows a logical sequence: Delivery → Engagement → Conversion → Revenue. Each stage builds on the previous one. If your delivery is strong but engagement is weak, your creative hook might need work. High engagement but low conversions? That’s likely a landing page issue. Missing this step-by-step analysis can lead to wasted budgets and misdiagnosed problems.
| Metric Type | Example Metrics | What They Measure | Business Impact |
|---|---|---|---|
| Vanity | Total impressions, views, likes | Visibility and social proof | Indirect; doesn’t guarantee revenue |
| Performance | Conversions, CPA, ROAS, GMV | Direct business outcomes | Direct; measures profitability |
Using Benchmarks and Industry Standards
Benchmarks are essential for spotting areas where you’re excelling – or falling short. For 2026, here are some key targets to aim for:
- Click-Through Rate (CTR): Above 1% is good; over 1.5% is excellent.
- ROAS: E-commerce and beauty brands should target 2.5x to 3.0x, while food and beverage brands often reach 3.5x.
- Engagement Rate: A rate between 3% and 5% is solid, and anything above 6% is outstanding.
These benchmarks aren’t fixed goals but guideposts. For example, if your CTR is at 0.5%, your creative hook likely isn’t resonating. If your ROAS is 1.2x compared to an industry standard of 3.0x, it’s time to evaluate your entire funnel – from ad creative to landing page. On the flip side, if you’re consistently achieving a 4.0x ROAS, you’re in a position to scale your budget confidently.
It’s also important to consider industry-specific benchmarks. SaaS and B2B campaigns often see lower ROAS (1.2x to 2.0x) due to longer sales cycles, while fashion brands typically hit around 2.8x. Knowing what’s typical for your industry helps you avoid unnecessary worry when your metrics don’t match unrelated sectors.
Practical Optimization Strategies
Once you’ve prioritized and benchmarked your metrics, it’s time to fine-tune your campaigns. Here’s how to address common performance issues:
- Low 6-Second Hold Rate (<10%): Your hook isn’t grabbing attention in the first three seconds. Test motion, pattern interrupts, or curiosity-driven openings to fix this.
- Low CTR (<0.84%): Experiment with new hooks that incorporate dynamic movement or unexpected visuals to stop the scroll.
- High CPMs (>$15): Narrow targeting or overly polished ads could be the problem. Broaden your audience or make your creatives feel more organic and native to TikTok.
- High CTR but Low Conversions: This points to a landing page issue. Ensure your page loads in under 2 seconds, aligns with the ad’s promise, and clearly communicates your value proposition.
Creative fatigue also sets in faster on TikTok compared to platforms like Meta. You’ll likely need to refresh your creatives every 3 to 7 days. Watch your frequency metric – when it exceeds 2.5x and engagement drops, it’s time for a change. Conversely, only scale your budget when your conversion rate remains stable for 3 to 7 days and your CPA stays within your target range.
"On TikTok Ads, cost efficiency is tied directly to engagement quality – which means your creative is your bid strategy." – Shalini Murugan, Two Minute Reports
Lastly, don’t rush to conclusions based on data from the past 48 hours. TikTok’s conversion tracking often has a 24 to 48-hour delay, especially for view-through attribution. Always wait for the complete data before making major decisions.
Advanced Attribution Metrics and Reporting
Once you’ve fine-tuned your core metrics, the next challenge is understanding how TikTok attributes conversions to your ads. Attribution assigns credit for a sale to specific touchpoints, and selecting the right model is crucial for accurately evaluating your campaign’s success. This step goes beyond basic metrics, helping you analyze conversions across various customer interactions.
Understanding Attribution Windows
After optimizing your metrics, it’s essential to grasp the timing and sources of conversions. An attribution window refers to the period between when someone interacts with your ad and when they complete a conversion that TikTok Ads Manager records. TikTok supports three attribution types:
- Click-Through Attribution (CTA): Gives credit for conversions after a user clicks your ad.
- View-Through Attribution (VTA): Credits conversions from users who saw your ad but didn’t click.
- Engaged View-Through Attribution (EVTA): Tracks conversions when someone watches at least six seconds of your video and converts later.
By default, TikTok uses a 7‑day click and 1‑day view attribution window. However, this can be adjusted depending on your product’s sales cycle. For quicker purchase decisions, like beauty or fashion products, the default window works well. For items requiring more consideration, such as automotive products or B2B services, you might benefit from extending the window to 14 or even 28 days to account for longer decision-making periods.
TikTok has also introduced a Performance Comparison feature, which, as of May 2025, allows you to analyze results across various attribution windows with a 90‑day lookback – without altering your account settings.
"Flexible attribution windows are important for businesses since they have different customer conversion journeys, along with different marketing goals and strategies for optimizing their campaigns." – TikTok For Business Blog
TikTok’s attribution model often reports higher conversion numbers than last‑click models because it includes assisted and view-based conversions that traditional last-click methods miss. In fact, relying solely on last-click data could undervalue TikTok’s contribution by as much as 30–40%.
Tracking Onsite and In-App Events
To fully understand your campaign’s performance, you’ll need a solid tracking system. For websites, install the TikTok Pixel. For apps, connect through Event Manager using a Mobile Measurement Partner (MMP). This setup allows you to track key actions like add-to-cart events, form submissions, app installs, and in-app purchases.
TikTok Ads Manager offers Custom Reports to help you monitor your funnel. You can configure custom columns to track metrics such as Status, Budget, Spend, Impressions, Clicks, CTR, Conversions, CPA, and ROAS. Additionally, the Breakdown feature lets you analyze performance by placement (e.g., TikTok versus Pangle), device type, or time (e.g., day, week, month) to identify trends.
Advanced tools in TikTok Ads Manager can further refine your insights:
- Time to Conversion: Displays the average time between ad interaction and purchase, helping to set realistic attribution windows.
- Touchpoints to Conversion: Maps out the user journey across campaigns, showing how different ads contribute to conversions.
- Assisted Conversions: Highlights conversions TikTok helped influence, offering a broader view of the platform’s value.
Keep in mind that conversion data typically stabilizes within 24–48 hours. For critical budget decisions, always base your choices on complete datasets.
Conclusion
TikTok Ads metrics hold the key to scaling campaigns profitably without wasting your budget. As TikTok For Business explains:
"Measuring ad performance is crucial for optimizing your campaigns and achieving your business goals. Without clear metrics, you’re essentially shooting in the dark".
With TikTok projected to generate $23 billion in ad revenue in 2024 – a 43% increase from the previous year – it’s clear the platform delivers results for advertisers who know how to track and act on the right data. Success on TikTok requires a step-by-step approach to analytics: Delivery → Engagement → Conversion → Revenue. Each phase builds on the one before it, making it impossible to optimize later stages without addressing earlier ones. For example, if your thumb-stop rate is under 50%, you need to improve your hook; better audience targeting won’t fix weak creative. Similarly, a high CTR paired with a low conversion rate points to issues with your landing page, not your ad creative.
To stay ahead, refresh your creatives every 3–7 days to combat ad fatigue, and keep an eye on your frequency metric – anything over 3.0 signals it’s time for fresh content. On TikTok, your creative essentially acts as your bid strategy. Engaging videos not only capture attention but also earn better algorithmic delivery, which helps lower your CPMs.
When measuring results, rely on view-through and engaged-view attribution windows instead of last-click models. Traditional last-click methods miss about 79% of TikTok-attributed conversions, undervaluing the platform’s impact by as much as 30–40%. A broader attribution approach ensures you capture TikTok’s full contribution to your campaigns.
Finally, establish a disciplined reporting routine to drive consistent improvements. Track performance daily, weekly, and monthly. Only scale campaigns once your conversion rates remain stable for 3–7 consecutive days. By aligning delivery, engagement, and conversion metrics, you’ll pinpoint exactly where your funnel needs attention and make informed adjustments to maximize profitability.
FAQs
Which 3–5 TikTok metrics should I check first each day?
When managing TikTok ad campaigns, there are three metrics you should keep an eye on every single day: ad impressions, click-through rate (CTR), and ad spend.
- Ad impressions show how often your ads are being displayed, giving you a sense of their visibility.
- CTR reveals how well your ads are grabbing attention and encouraging users to take action.
- Ad spend helps you track your budget and ensure you’re spending wisely.
By reviewing these metrics daily, you can quickly spot trends, identify potential issues, and make adjustments to keep your campaign running smoothly.
How can I tell if poor results are from creative, targeting, or my landing page?
When evaluating TikTok ad performance, it’s important to break things down systematically. Start with broad campaign metrics to get a sense of overall effectiveness:
- Conversions: How many people completed the desired action (purchase, signup, etc.)?
- Conversion Rate (CVR): The percentage of users who converted after interacting with your ad.
- Cost per Conversion: Are you getting results at a reasonable cost?
Once you’ve assessed the big picture, shift your focus to creative-specific metrics like:
- Click-Through Rate (CTR): Are your ads grabbing attention and driving clicks?
- Engagement: How are viewers interacting with your content (likes, comments, shares)?
If these metrics look good but conversions are still lagging, it might be time to review your landing page. Check for issues like slow load times, poor design, or a mismatch between the ad and the page content.
Finally, dig into targeting metrics to ensure your ads are reaching the right people:
- Reach: How many users are seeing your ads?
- Audience Demographics: Are you connecting with the intended audience based on age, location, or interests?
By analyzing these layers, you can pinpoint what’s working – and what needs tweaking – to improve your TikTok ad performance.
What attribution window should I use to capture TikTok’s view-through conversions?
TikTok suggests sticking with the default attribution window of 7-day click-through and 1-day view-through to monitor view-through conversions effectively. That said, you can tweak these settings to better align with your campaign goals or the length of your conversion cycle for more precise tracking.