

Clickstream analytics tracks every user interaction – clicks, scrolls, and page views – on your website or app, revealing how users engage with your platform. Choosing an on-premise solution means hosting the software on your servers, ensuring full data control and compliance with privacy regulations like GDPR. This guide explains how on-premise clickstream systems work, their business impact, and how to set them up.
Key Highlights:
- What It Is: On-premise clickstream analytics logs detailed user actions, offering insights into behavior and patterns.
- Why Choose On-Premise: Full control over data, better compliance, and access to raw, unsampled data.
- Business Benefits: Optimize customer journeys, reduce cart abandonment (global rate: 83% in Q4 2023), and improve marketing ROI.
- Core Components: Collection, ingestion, processing, and storage/visualization powered by tools like Apache Kafka, Spark, and Tableau.
- Setup Costs: Around $200–$240/month for AWS or GCP infrastructure for mid-sized traffic.
This guide walks you through the setup process, including hardware, software, and data pipelines, and explores use cases like funnel analysis, anomaly detection, and customer journey mapping.
Clickstream Analysis With Apache Kafka and Apache Spark
Core Components of On-Premise Clickstream Systems
On-Premise Clickstream Analytics System Architecture and Data Flow
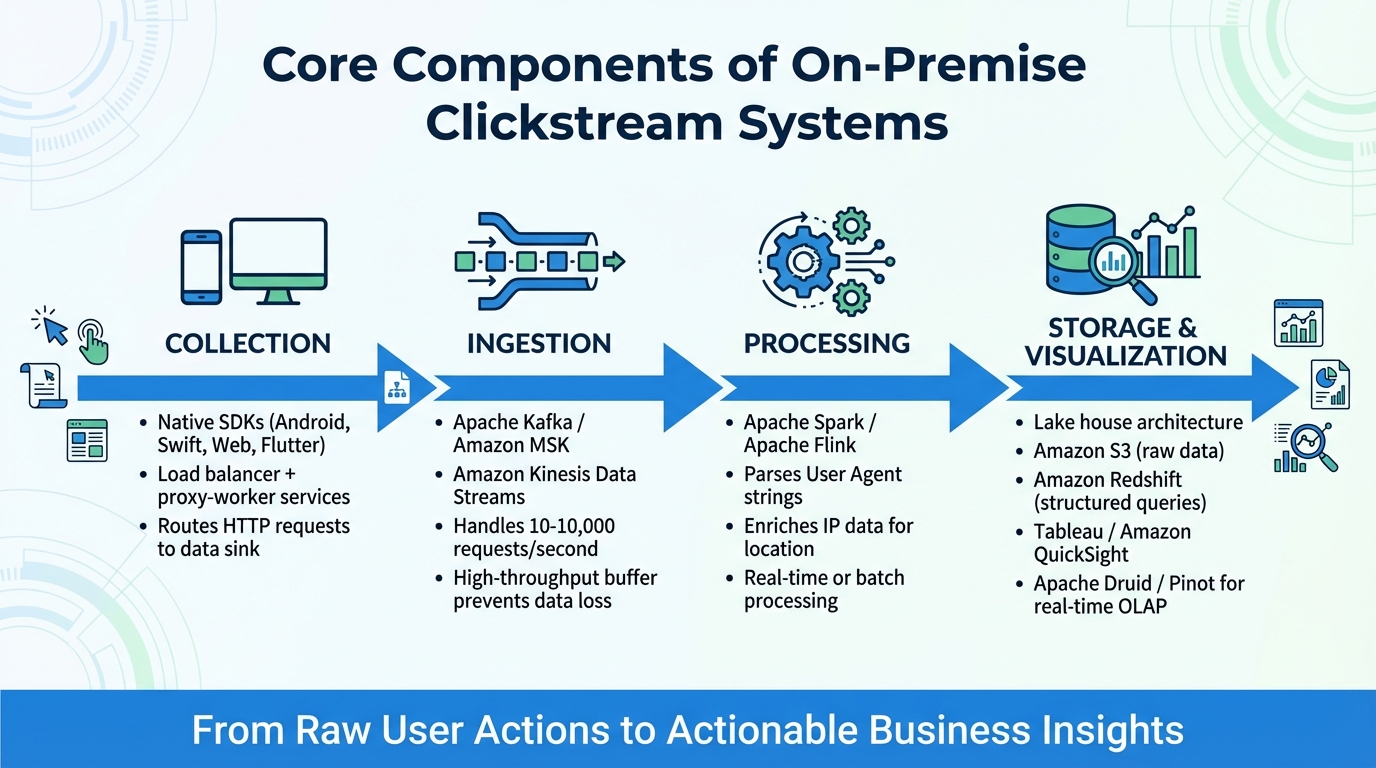
An on-premise clickstream system revolves around four key components: collection, ingestion, processing, and storage with visualization. Together, these elements capture user actions and transform them into meaningful insights.
To start, collection gathers user activity data. Native SDKs – such as those for Android, Swift, Web, and Flutter – are commonly used to track in-app events. A load balancer paired with proxy-worker services routes incoming HTTP requests to a designated data sink, ensuring efficient data flow.
Next comes ingestion, which ensures a steady and reliable data pipeline. Tools like Apache Kafka (or Amazon MSK) and Amazon Kinesis Data Streams act as high-throughput buffers that handle data spikes without overloading downstream systems. These buffers serve as a bridge between the collection and processing stages, preventing data loss during traffic surges or system downtime. Modern pipelines are capable of handling anywhere from 10 to 10,000 requests per second.
The processing stage is where raw data is turned into actionable insights. Frameworks such as Apache Spark or Apache Flink analyze the data, parsing User Agent strings to identify device types, operating systems, and browsers. They also enrich IP data to pinpoint user locations. These engines can operate in real-time or on a batch schedule, depending on the system’s needs. Once processed, the data moves to the storage and visualization stage.
Finally, storage and visualization bring the insights to life. A "lake house" architecture is a popular choice, combining scalable object storage (like Amazon S3) for raw data with high-performance data warehouses (like Amazon Redshift) for structured queries. Tools like Amazon QuickSight or Tableau connect to these warehouses, providing intuitive drag-and-drop interfaces for analyses such as funnel tracking, path analysis, and retention studies – no SQL knowledge required. For lightning-fast queries on billions of events, real-time OLAP stores like Apache Druid or Apache Pinot can be integrated with visualization tools.
Each of these components works together to ensure that raw user actions are transformed into actionable business insights seamlessly.
How to Set Up On-Premise Clickstream Analytics
Infrastructure and Hardware Requirements
The hardware you’ll need depends on factors like the volume of monthly requests, the number of websites being monitored, and the size of your user segments. If your system tracks over 1 million user actions each month, you’ll need a multi-server setup. This means separating your database server from the application server, which handles HTTPS requests, API calls, and report processing tasks.
To ensure high availability, set up a Virtual Private Cloud (VPC) with two public and two private subnets spread across different Availability Zones. If you’re using advanced engines like Redshift Serverless, distribute the subnets across at least three Availability Zones.
Your database server should run MySQL 8.0+ or MariaDB. If you’re handling high traffic, consider using a reader/writer database pair for better efficiency. Redis is a must – it helps scale the Tracking API, manages sessions, and serves as a shared cache in load-balanced environments. For raw data ingestion and long-term storage, you’ll need either an S3-compatible data lake or high-capacity local disk storage.
A typical self-hosted pipeline processes about 100 events per second, translating to roughly 9 million events daily. On AWS, the infrastructure for Snowplow Community Edition costs approximately $200 per month, while on GCP, it’s about $240 per month at this load. Matomo’s software is free, but you’ll need to cover hardware or cloud infrastructure expenses yourself.
Software Installation and Dependencies
Once your hardware is ready, it’s time to install the necessary software and dependencies.
For Matomo, you’ll need:
- A web server (e.g., Apache, Nginx, or IIS)
- PHP
- MySQL or MariaDB
For an AWS self-hosted setup, make sure to have:
- AWS CLI
- Python 3.11+
- Node.js 20.12.0+
- AWS CDK 2.140.0+
- pnpm 9.15.3
- Docker
Snowplow Community Edition simplifies deployment with Terraform modules, allowing experienced users to complete setup in about an hour.
Before deploying on AWS, you’ll need to prepare a VPC with at least two public and two private subnets across two Availability Zones, along with an S3 bucket in the same region. For deployments in isolated subnets, create VPC endpoints for services like S3, logs, ECR, ECS, and Kinesis to maintain connectivity.
For Matomo, enable auto-archiving using systemd or cron to process reports in the background instead of on-demand. This significantly boosts performance for high-traffic sites. Secure all tracking requests and UI access with SSL (HTTPS). To speed up data insertion into MySQL databases, use "LOAD DATA INFILE", and enable slow query logs to identify performance issues.
With the software installed and configured, you’re ready to move on to setting up your data pipeline.
Data Pipeline Configuration
A complete pipeline for clickstream analytics consists of four stages: ingest, process, store, and visualize. Start by using Apache Kafka to capture real-time events. Kafka acts as a buffer, ensuring no data is lost during traffic spikes.
For processing, use a tool like Apache Spark Streaming. It supports micro-batching, stateful aggregations, and data enrichment, allowing you to filter for specific user actions or hashtags. For storage, adopt a multi-tier strategy: use in-memory solutions like Redis for hot storage (real-time dashboards) and scalable NoSQL databases like Apache Cassandra for cold storage (long-term historical data).
Deploy the pipeline using Docker Compose. Set up services like a kafka-init container to pre-create message topics and avoid race conditions. When running Cassandra in containers, configure CASSANDRA_BROADCAST_ADDRESS to the service name for proper discovery. Ensure compatibility between Spark and Cassandra by setting spark.cassandra.connection.protocol.version to "V4" for Cassandra 4.1.
Once the pipeline is operational, integrate platform-specific SDKs (e.g., Android, iOS, JavaScript) into your applications using an App ID and the pipeline’s endpoint URL. Add tools like Elasticsearch and Kibana to explore and visualize your processed data.
With your pipeline fully configured, you’ll have a robust system for analyzing user clickstream data in detail.
sbb-itb-2ec70df
Use Cases for On-Premise Clickstream Analytics
Funnel Analysis and Conversion Optimization
Clickstream data can pinpoint where potential customers drop off during their journey, a crucial insight since only a small percentage of e-commerce visitors make a purchase on their first visit. On-premise systems allow you to track users through each stage of your sales funnel – from landing page to checkout – and identify exactly where they leave.
To keep it manageable, focus on four key steps in your funnel: homepage visit → product page → add to cart → purchase completion. For example, if you notice a significant drop-off between "add to cart" and "purchase", you know where to focus your optimization efforts. This is critical when considering the global cart abandonment rate reached 83% in Q4 2023.
You can take this further by using behavioral clustering techniques like K-Means to group users based on their navigation patterns. This helps you differentiate between users who navigate effortlessly and those who struggle. Additionally, applying Markov Chains can predict a user’s next move, enabling real-time personalization that nudges them toward completing their purchase.
These detailed metrics don’t just improve conversions – they also help you identify unusual patterns as they happen.
Detecting Unusual User Behavior Patterns
Clickstream analytics provides a chronological view of user interactions, making it easier to identify irregularities. With real-time data processing tools like Apache Flink and Kafka, you can detect anomalies instantly. This is invaluable for addressing security concerns (like fraud or bot traffic) and resolving technical glitches.
By keeping your clickstream data on-premise, you maintain complete control over sensitive behavioral data, ensuring it stays within your secure environment. Access to unaggregated data allows you to closely examine individual user actions and spot subtle deviations from normal patterns. For example, sequential pattern discovery algorithms like cSPADE can help identify recurring sequences of actions that lead to errors or failures, enabling your team to address problems before they escalate.
This level of granularity is also essential for compliance. In 2023, Meta Platforms faced a record €1.2 billion fine for GDPR violations related to personal data transfers. By keeping your data on-premise, you simplify compliance with regulations like GDPR, CCPA, and SOC 2 Type II, eliminating the risks associated with third-party vendor data transfers.
Customer Journey Mapping
Building on funnel and anomaly analyses, customer journey mapping offers a comprehensive view of user engagement. Using your on-premise clickstream system, you can capture detailed interactions like hovers, scrolls, and typing to create precise heatmaps. These insights allow you to pinpoint friction points where users encounter frustration.
Integrating clickstream data with other internal sources enhances your analytics pipeline. This helps you identify which marketing efforts drive the most engaged sessions and deliver the best ROI. You can also track specific user interactions, identify where users encounter 404 errors, and analyze paths that lead to successful conversions versus those that result in abandonment.
Growth-onomics specializes in turning raw clickstream data into actionable insights. Their approach combines clickstream analysis with performance marketing strategies to optimize every touchpoint of the customer journey. By collaborating with experts who understand both the technical and strategic aspects, you can transform your on-premise data into a tool for measurable growth.
To organize your stored data effectively, partition it by year, month, day, and hour. This structure simplifies retrieval and filtering, making it easier to analyze specific campaigns or compare user behavior across different periods. This flexibility ensures you can map customer journeys at the level of detail your business requires.
Best Practices for Managing On-Premise Systems
Performance Optimization and Monitoring
To keep your on-premise systems running smoothly, focus on both optimization and monitoring. Start by using PHP OPcache to avoid repeated script compilation, which helps reduce CPU usage. For session management and object caching, tools like Redis or Memcached are excellent choices, especially during high-traffic periods.
When it comes to your database, fine-tune its settings. Allocate 60–80% of available RAM to the InnoDB buffer pool and adjust innodb_flush_log_at_trx_commit to 2 for improved throughput. For high-traffic environments handling up to 2 billion actions per month, disable browser-triggered reports. Instead, switch to CLI-based archiving via cron jobs, running every 1–6 hours to maintain system responsiveness.
If your traffic peaks at over 5,000 hits per second, consider using a Redis-backed queue for tracking requests. This buffers the incoming load, preventing database congestion. Also, plan your hardware with care – allocate around 1GB of storage for every 5 million page views to ensure sufficient capacity.
Scaling for Increased Data Volume
Scaling becomes essential as your data grows. For smaller traffic loads, vertical scaling (adding more CPU and RAM) may suffice. However, if your system processes over 100 million actions per month, horizontal scaling is a better option. This involves using separate tracking and reporting servers, all managed behind a load balancer.
For consistency across nodes, rely on shared storage solutions like NFS, GlusterFS, or CephFS. If you’re processing massive data loads – like a Kafka-based ingestion layer handling 100,000 events per second – be prepared for significant storage demands. This setup can generate around 8.6TB of data daily, so fast SSD storage is critical. Fine-tune your database settings aggressively to handle such volumes. Keep in mind that with a replication factor of 3, a single Kafka broker equipped with a 10 Gbps network card can handle about 83 MB/s of effective throughput.
Data Security and Compliance
As you scale and optimize, prioritizing data security is non-negotiable. Use Column-Level Security (CLS) to safeguard sensitive information like credit card numbers, and implement Row-Level Security (RLS) to control access based on user roles or geographic location. Transition from static Role-Based Access Control to Attribute-Based Access Control (ABAC) to simplify and streamline policies.
"Any sensitive or private data must be regulated – it is non-negotiable." – Sanjeev Mohan, Principal, SanjMo
Anonymizing IP addresses is another critical step to ensure individual data cannot be traced. Keep in mind that under CCPA, intentional violations can lead to fines of $7,500 per violation, while accidental breaches still carry a $2,500 penalty. To stay compliant, deploy automated crawlers to identify and tag Personally Identifiable Information (PII) or Protected Health Information (PHI) within your system. Integrate consent management tools with your analytics to respect user opt-out requests. Finally, adopt a "shift-left" approach by embedding security checks early in the data ingestion phase. This helps eliminate inconsistencies and reduces redundant processing costs.
Conclusion and Next Steps
Key Takeaways
On-premise analytics puts you in the driver’s seat when it comes to managing user data. By keeping everything within your secure environment, it supports compliance with regulations like GDPR and CCPA. Unlike many third-party tools that rely on data aggregation or sampling, on-premise solutions give you raw, detailed insights into every click, scroll, and interaction your users make.
One major advantage? Cost savings. Instead of shelling out for pricey licensing fees – sometimes as high as $150,000 annually – you only pay for the infrastructure you use. With global digital ad spending expected to soar to $836 billion by 2026, having precise data for attribution and conversion tracking is a must to stay ahead.
"Gaining a deeper understanding of user behavior – customers’ different paths, digital footprints, and engagement patterns – is crucial for providing a personalized experience and making informed marketing decisions." – Matomo Core Team
On-premise solutions also offer the flexibility to capture custom events and integrate data from various sources, enabling more advanced and tailored analysis.
The next step? Turning these insights into actions that fuel growth.
How Growth-onomics Can Help
Growth-onomics is here to transform your raw data into actionable strategies for growth. From setting up your virtual private cloud (VPC) to implementing custom SDKs, we handle the technical heavy lifting so you can focus on using the insights.
Our approach combines data analytics with customer journey mapping to identify exactly where users face challenges in your funnel. With pre-configured dashboards and tools for analyzing funnels, paths, and retention, we help you tackle issues like cart abandonment, optimize your ad spend, and create personalized user experiences.
Ready to take your growth strategy to the next level? Visit Growth-onomics to see how we can support your data-driven success.
FAQs
What are the key benefits of choosing on-premise clickstream analytics instead of cloud-based options?
On-premise clickstream analytics brings some clear benefits compared to cloud-based options. Hosting the data on your own infrastructure gives you total control over storage and management, which translates to stronger security and privacy. You also gain the flexibility to customize the analytics environment to fit your business’s unique needs.
Another advantage is compliance. With on-premise solutions, sensitive data stays within your organization, making it easier to meet regional regulations and data protection laws. This is especially important for industries with strict rules or businesses that prioritize keeping data within their borders.
How can businesses stay compliant with privacy laws when using on-premise clickstream analytics?
To comply with privacy laws while using on-premise clickstream analytics, businesses should focus on processing data locally. Keeping sensitive data within their own infrastructure helps reduce exposure to external risks and aligns with regulations like GDPR and HIPAA.
Another key step is adopting server-side tracking, which centralizes data control and reduces dependence on third-party cookies. This method enables stricter security protocols, better access management, and detailed audit trails – essential components for meeting privacy requirements. It’s also important for businesses to routinely review and update their data practices to stay in step with changing privacy regulations and maintain compliance throughout the entire data lifecycle.
What hardware and software do I need to set up an on-premise clickstream analytics system?
To build an on-premise clickstream analytics system, you’ll need to carefully plan both the hardware and software components to handle data collection, processing, and analysis efficiently.
Hardware: The hardware you’ll need depends on the volume of user actions you intend to track. For example, if you’re tracking over 1,000,000 user actions per month, you’ll typically require at least two servers. One server should handle HTTPS requests, API calls, and report generation, while the other focuses on database operations. To maintain smooth performance, ensure the servers have adequate CPU power, RAM, and storage, based on your traffic expectations.
Software: On the software side, you’ll need a web server like Apache or Nginx, paired with a database system such as MySQL or MariaDB. PHP will serve as the backend processing language. To streamline deployment and scaling, consider using tools like Docker for containerization or automation tools such as Terraform. For tracking user interactions on web and mobile platforms, SDKs are crucial for collecting detailed data.
Your setup should prioritize high performance, robust data security, and the ability to scale as your analytics demands grow.