

Twitter ads can help businesses reach millions of users with cost-effective campaigns. With 237.8 million daily active users and an average cost per action of just $0.38, Twitter offers businesses a budget-friendly way to grow. Ads on the platform can influence purchasing decisions, especially when they feature engaging visuals and concise messaging. Here’s what you need to know:
- Ad Formats: Options include text-only, image, video, carousel, and vertical video ads, each with specific specifications and best-use cases.
- Design Tips: Use bold colors, short videos (under 15 seconds), and clear branding to stand out in fast-scrolling feeds.
- Copywriting: Keep headlines under 50 characters and focus on concise, action-oriented language.
- Call-to-Actions (CTAs): Use direct CTAs like "Shop" or "Install" to drive user actions.
- Testing and Optimization: Run A/B tests to refine your ads based on audience engagement and performance metrics.
Twitter’s fast-paced environment demands quick, attention-grabbing ads optimized for mobile users. Use the Twitter Pixel to track conversions, and refresh your ads regularly to maintain engagement. By combining data-driven strategies with clear messaging and visuals, you can create ads that perform well on the platform.
How to design High-Performing X Twitter Ads creatives (Step-By-Step Guide)
Twitter Ad Formats Explained
Twitter Ad Formats Specifications and Features Comparison Chart
Twitter provides a variety of ad formats, each tailored to different campaign objectives. Let’s break down these formats and explore how to make the most of them.
Text-Only Ads are the simplest option available. With up to 280 characters, they seamlessly blend into users’ feeds. If you include a link, it reduces the character count to 257. These ads are ideal for straightforward announcements or testing messaging without committing to visuals.
Image Ads focus on showcasing a single image to highlight products or services. Supported aspect ratios are 1.91:1 (800 x 418px) and 1:1 (800 x 800px), and they include customizable call-to-action (CTA) buttons like "Shop", "Book", or "Install". Note that uploading a GIF will render it as a static image. These clear specifications help ensure your content is visually appealing and effective.
Video Ads bring stories to life with motion and sound. Twitter supports videos up to 2 minutes and 20 seconds, but shorter videos (under 15 seconds) tend to perform better. Videos under 60 seconds will automatically loop in the timeline. For the best results, use a 1:1 aspect ratio (1,200 x 1,200 pixels) or 16:9 (1,920 x 1,080 pixels). Keep your file size under 30 MB for better performance, though the maximum allowed size is 1 GB. To engage viewers who watch without sound, include closed captions or text overlays. Position your logo in the upper left-hand corner and keep branding visible throughout the video.
Carousel Ads allow you to use 2–6 swipeable slides, all with the same aspect ratio. You can direct users to a single destination or multiple unique web links. This format is particularly effective for e-commerce brands displaying various products or for guiding users through a multi-step process.
Vertical Video Ads are displayed in the Immersive Media Viewer with a 9:16 aspect ratio (1,080 x 1,920 pixels). These full-screen, sound-on ads are accessed by swiping up on organic video content or tapping into the Video Tab. They support a maximum frame rate of 60 fps and a bitrate of up to 25 Mbps. This format delivers an engaging, distraction-free experience.
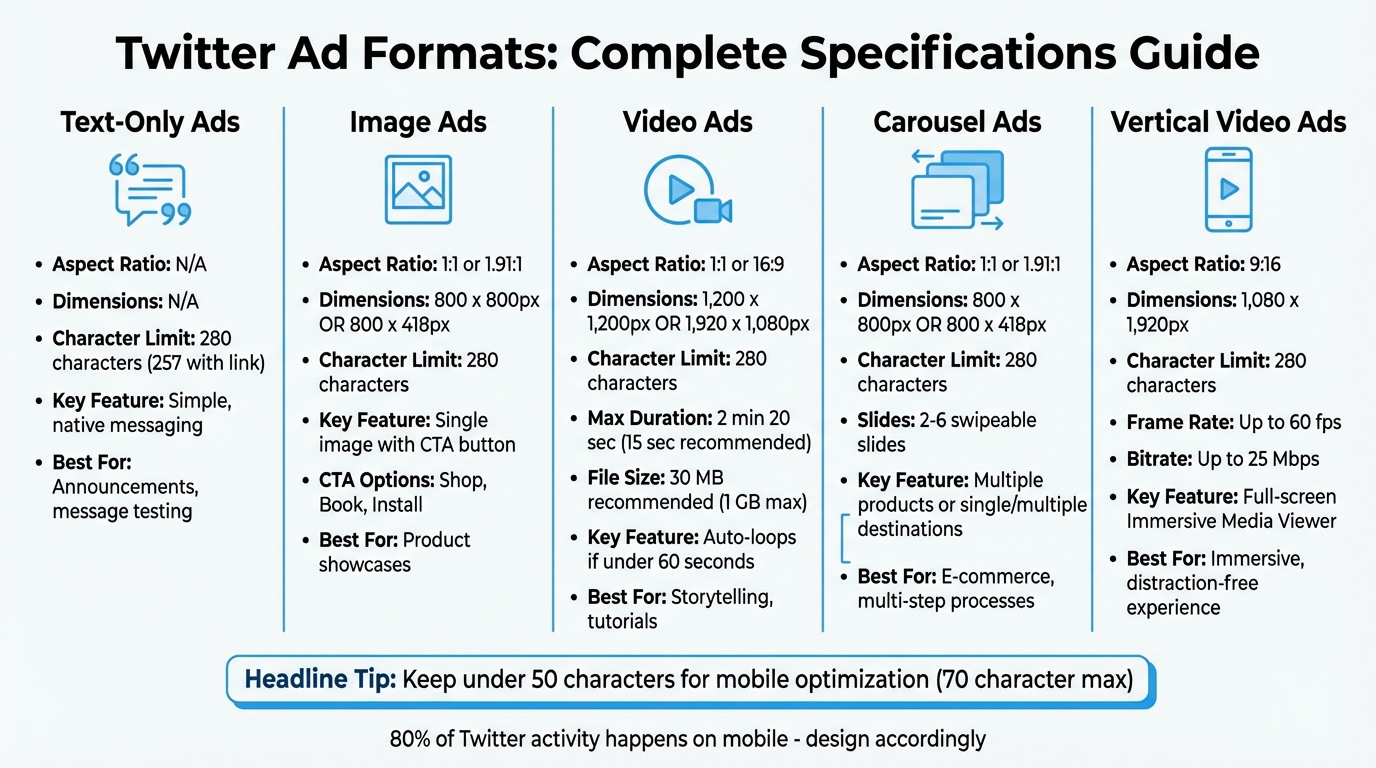
Here’s a quick reference for the key specs of each format:
| Ad Format | Aspect Ratio | Recommended Dimensions | Character Limit | Key Feature |
|---|---|---|---|---|
| Text-Only | N/A | N/A | 280 (257 w/link) | Simple, native messaging |
| Image Ad | 1:1 or 1.91:1 | 800 x 800px or 800 x 418px | 280 | Single image with CTA button |
| Video Ad | 1:1 or 16:9 | 1,200 x 1,200px or 1,920 x 1,080px | 280 | Loops if under 60 seconds |
| Carousel | 1:1 or 1.91:1 | 800 x 800px or 800 x 418px | 280 | 2–6 swipeable slides |
| Vertical Video | 9:16 | 1,080 x 1,920px | 280 | Full-screen immersive viewer |
When crafting ad headlines, Twitter allows up to 70 characters, but keeping them under 50 characters ensures they won’t be cut off on mobile devices. For video ads, use the H264 codec with a 4:2:0 color space and AAC LC audio codec for optimal compatibility.
Mastering these formats is key to creating effective Twitter campaigns. By aligning your creative strategies with these specifications, you’ll set the stage for stronger ad performance.
Design Principles for Twitter Ads
When it comes to creating effective Twitter ads, following strong design principles can help your content grab attention and stand out in a busy feed.
Visual Optimization Rules
With 80% of Twitter activity happening on mobile devices, designing for small screens is non-negotiable. Use vertical or square formats to maximize screen space, as these formats naturally draw more attention than horizontal layouts in a fast-scrolling environment.
Contrast is key. Bright, bold colors that stand out against Twitter’s white or dark mode backgrounds can stop users mid-scroll. Avoid subtle or muted palettes – they often blend into the feed and fail to grab attention.
For video ads, it’s smart to position your logo in the upper left corner and include captions or text overlays. Since many users watch videos with the sound off, these elements ensure your message still gets across. Consistent branding in your videos helps reinforce your product or service as users engage with your content.
Keep your videos short – 15 seconds or less is ideal. While Twitter allows videos up to 2 minutes and 20 seconds, shorter clips perform better. Videos under 60 seconds also loop automatically, giving you extra impressions without additional effort.
Copywriting Best Practices
Brevity wins on Twitter. Write concise copy that immediately captures attention. Headlines are technically limited to 70 characters, but many devices truncate them after 50 characters. To avoid losing your key message, place the most important words at the beginning. Similarly, app descriptions truncate at 200 characters – so lead with essential details.
Your ads should feel like a natural extension of your organic tweets. Mimic the tone and style of your best-performing posts rather than sounding overly formal or corporate. Emojis can add personality and help your ad stand out, but they should align with your brand voice and be accessible to all users.
Keep in mind that including a link in your tweet reduces the character count by 23, leaving you with 257 characters for the rest of your message. Plan carefully to ensure every word serves a purpose.
Clear, concise messaging naturally sets the stage for effective call-to-action (CTA) strategies.
Call-to-Action (CTA) Development
Direct CTAs like "Shop", "Install", or "Book" work best for driving immediate action. Twitter offers pre-set CTA buttons designed for specific campaign objectives – use these instead of relying solely on text links for better results.
For Direct Message cards, the CTA button is limited to 24 characters, so keep it short and action-driven. Interactive elements like polls (with 25-character response options) and Conversation Buttons (with 21-character hashtags) encourage instant engagement.
Match the CTA to the user’s stage in the journey. For instance, use "Install" or "Open" with App Cards to drive app downloads. For Image or Video Website Cards, options like "Shop", "Book", or "Connect" align with the user’s next logical step. If you’re using Branded Notifications, be transparent – let users know that liking the post will trigger automated messages. This openness builds trust and avoids potential backlash.
| Ad Format | CTA Character Limit | Common CTA Options |
|---|---|---|
| Direct Message Card | 24 characters | Chat (customizable text) |
| Poll Options | 25 characters | 2-4 custom responses |
| Website Card Title | 70 (50 recommended) | Shop, Book, Connect, Order, Play |
| App Card Title | 200 (truncated) | Install, Open, Play |
| Conversation Button | 21 (for hashtag) | Customizable hashtag |
High-Performing Content Types
When it comes to Twitter, some content formats naturally grab more attention and drive better results. Knowing which ones work best – and how to use them effectively – can mean the difference between an ad that gets ignored and one that drives action. Let’s break down how static visuals, dynamic videos, and user-generated content (UGC) can each bring unique advantages.
Static Images and Infographics
Static images are a reliable way to catch people’s eye. For square images, stick to 1200 x 1200 pixels – this size takes up more space on the screen, making your content harder to miss on both mobile and desktop feeds. Square layouts tend to outperform horizontal ones simply because they dominate more of the feed.
Infographics are another great option, especially for presenting data, comparisons, or step-by-step guides. The key here? Simplicity. Don’t overload your design with too much text or too many details. Instead, focus on one main idea, using bold fonts and high-contrast colors that stand out against Twitter’s interface.
Static visuals are perfect for delivering clear, single-message calls to action. When paired with Website Cards, they create a smooth path for users to take action – whether it’s clicking a "Shop" or "Book" button.
Native Videos and Tutorials
Video content is king on Twitter for a reason: users spend 26% more time watching ads on Twitter compared to other platforms. To make the most of it, keep your videos short – under 15 seconds is ideal for grabbing attention quickly.
Tutorial videos are especially effective. They show how your product works in real time, making even complex features easy to understand. Think how-tos, unboxings, or before-and-after transformations – these formats directly address what viewers want to see.
Native videos blend seamlessly into Twitter’s timeline, reducing the "ad friction" that often makes users scroll past. Forget overly polished, studio-quality production – authentic, handheld clips with natural lighting and quick edits tend to perform better. Platforms reward content that feels like it could’ve been posted by a regular user.
For brands looking to build trust, incorporating genuine user-generated content can take things to the next level.
User-Generated Content (UGC)
There’s something about user-generated content that resonates in a way traditional ads just can’t. A whopping 85% of people say UGC influences their buying decisions more than branded content. And the numbers back up its effectiveness: UGC ads see a 4x higher click-through rate and cut cost-per-click by 50% on average. Even better, shoppers who engage with UGC drive a 100.6% increase in conversions.
Take Bloom Nutrition, for example. They teamed up with creator Gabbie Egan to launch native-style "day-in-the-life" UGC videos in December. The campaign racked up over 4 million views and slashed CPMs from $3.57 to $1.47. The result? Bloom became the #1 Best Seller in Amazon Launchpad. Similarly, Papier ramped up their monthly UGC video output to 10–14 videos and saw TikTok CPAs drop by 57% while increasing their ad spend by 575%.
Want to encourage more UGC for your brand? Use Conversation Buttons with custom hashtags to inspire users to share their own posts. This not only amplifies your brand’s reach but also turns your ad into a referral engine, as UGC appears organically to the creator’s followers. For high-performing creator content, consider repurposing it as Spark Ads to ride the wave of existing engagement.
"UGC ads don’t feel like ads at all. That’s part of why they’re so powerful for brands." – Samantha Dilday, Statusphere
sbb-itb-2ec70df
A/B Testing and Optimization
Getting your Twitter ads to perform well isn’t about taking shots in the dark – it’s about running thoughtful experiments. Twitter’s built-in A/B testing framework allows you to conduct controlled tests with mutually exclusive audiences, ensuring that each user only sees one variation of your ad. This setup keeps your data clean and ensures your insights are reliable. It’s a solid foundation for figuring out which creative elements resonate best.
Testing Creative Variations
Twitter’s A/B testing lets you experiment with a variety of elements – images, videos, text, and CTA buttons. The key? Test one variable at a time to pinpoint what’s driving the results.
You can include up to 5 ad groups per experiment, with each group containing up to 5 individual ads. Just make sure to toggle the A/B testing option "ON" during the setup phase, as it can’t be activated after the campaign is live or even drafted.
Here’s a real-world example: In November 2022, marketing agency Tuff ran a creative test for Nova Credit to promote a white paper. They compared a static image to an animated video version of the same graphic. The static image outperformed in terms of impressions, generating 226,951 impressions with a 0.20% CTR, compared to the video’s 139,732 impressions and 0.19% CTR. However, the video had a 0.92% engagement rate, edging out the image’s 0.82%, showing that while static images might drive more clicks, videos can hold attention more effectively.
To get meaningful results, run your tests for at least two weeks and set your budget at the ad group level, as Campaign Budget Optimization isn’t available during A/B tests. Twitter uses a Bayesian model (BayesAB) instead of traditional significance testing. You’ll see a "Win Chance" metric, which reflects the likelihood that a variation is outperforming others. If a variation has a lower Win Chance, it confirms the winning cell’s success isn’t due to random chance. The cell with the lowest cost per your chosen metric will be labeled the winner.
Once your tests wrap up, use the data to refine your creative strategy step by step.
Using Performance Data to Improve Results
After running controlled tests, the next step is turning those insights into actionable improvements. Twitter’s Ads Manager provides real-time access to performance metrics, so you don’t have to wait until the campaign ends to make adjustments. Look for trends in your top-performing creatives. Are certain messaging styles consistently doing better? Do bold, simple visuals resonate more, or does your audience engage more with detailed, informative content?
Let the data guide your creative tweaks. Creative elements can influence up to 50% of a campaign’s success. To strike the right balance, try a "T-shape approach": continue refining and scaling concepts that work, while setting aside 15% to 20% of your monthly budget to test bold new ideas. This approach helps you maximize what’s effective while uncovering fresh angles to keep your campaigns dynamic.
As you analyze results, dig into why the winning variation performed better. Use those insights to inform your next round of creative tests. This cycle of testing, learning, and improving is the secret to crafting standout Twitter ads.
Key Metrics and Tracking
To optimize your ad creative effectively, you need a solid system for tracking metrics. Without it, refining your campaigns becomes a guessing game. Twitter’s Ads Manager offers a wealth of performance data, helping you focus on the metrics that align with your goals. This turns vague assumptions into data-driven decisions.
Engagement Metrics
Engagement metrics tell you how users are interacting with your ads. For instance, likes show positive sentiment, while retweets indicate that your content resonated enough for someone to share it with their followers. Replies, on the other hand, reflect direct engagement and can highlight whether your ad is sparking meaningful conversations.
One of the most important metrics to watch is the engagement rate, calculated by dividing total engagements by impressions. A rate between 0.5% and 1% is generally solid, while anything above 1% is outstanding. Additionally, link clicks show whether your call-to-action is compelling enough to drive traffic.
Keep an eye on these metrics daily, especially for campaigns with tight deadlines. Compare your results to your past performance rather than relying solely on industry benchmarks. For example, if your ad gets high impressions but low engagement, it’s a sign that the creative might need a refresh.
While engagement gives you a snapshot of interest, conversion tracking digs deeper into the actual results of your campaign.
Conversion Tracking
Conversions are where the real impact of your campaign comes into play. Using the Twitter Pixel – also called the Universal Website Tag – you can track the customer journey from the moment they click to when they take a desired action, like making a purchase, signing up, or downloading content.
To set this up, embed the pixel in your website’s HTML or use Google Tag Manager for easy deployment. Once installed, confirm that it’s working correctly with the X Pixel Helper extension. Keep in mind that retargeting requires a minimum audience size of 100 users to work effectively.
Regularly monitor your cost per conversion in the campaign dashboard. If an ad’s cost per lead or sale exceeds your target, pause it and focus on refining your high-performing creatives. For a deeper dive, export your campaign data as a CSV file to identify trends and patterns over time.
Here’s a quick look at the key tools for tracking conversions:
| Tool | Primary Function | Best For |
|---|---|---|
| Twitter Pixel | Website tracking | Measuring ROI, purchases, and leads |
| Google Tag Manager | Tag deployment | Managing multiple events without coding |
| X Pixel Helper | Troubleshooting | Verifying pixel setup and functionality |
| Campaign Dashboard | Performance analysis | Tracking real-time metrics like CPC and CTR |
Growth-onomics: A Partner for Twitter Ad Success

Running successful Twitter ad campaigns requires more than just creativity – it demands technical know-how and data-driven strategies. That’s where Growth-onomics steps in. By combining performance marketing expertise with advanced analytics, they help businesses fine-tune their Twitter advertising efforts. Their strategy revolves around setting up proper tracking systems, systematically testing creative variations, and optimizing campaigns based on real-world performance metrics.
A key part of their process is implementing conversion tracking through the Twitter Pixel. This tool allows businesses to track crucial actions like purchases, lead submissions, and app downloads. By focusing on actual conversions rather than just engagement, Growth-onomics ensures that ad spend translates into tangible results.
But tracking is just the beginning. Growth-onomics takes it a step further with A/B testing to refine both targeting and creative execution. For example, during a November 2022 campaign for Multiverse, they tested two different audience types for a software engineering apprenticeship program: keyword targeting and follower look-alikes. The results were clear – keyword targeting generated 508,522 impressions with a 0.17% click-through rate (CTR), outperforming the look-alike audience, which achieved 281,039 impressions and a 0.14% CTR. This kind of systematic testing helps identify what works best for specific objectives.
Another standout feature of their approach is their focus on frequent creative refresh cycles. By updating ad creatives every two to three days, they combat ad fatigue and align with Twitter’s preference for fresh content, regardless of past engagement. Paired with their objective-based optimization – whether the goal is website traffic, app installs, or something else – this strategy ensures campaigns stay relevant and cost-effective. The combination of regular creative updates and goal-oriented planning delivers consistent results while keeping budgets in check.
For businesses aiming to scale their Twitter advertising beyond basic campaigns, Growth-onomics offers the technical expertise and testing framework needed to turn ad spend into measurable growth. Learn more at Growth-onomics.
Conclusion
Crafting effective Twitter ad creatives demands a thoughtful strategy that combines the right ad formats, striking design, and continuous refinement. Knowing what connects with your audience is the cornerstone of success. This combination lays the groundwork for deeper testing and more precise performance measurement.
Testing isn’t optional – it’s essential. Subtle adjustments to creative elements can lead to noticeable improvements in engagement and results.
With Twitter prioritizing engaging, high-quality content, updating your ads every two weeks can help combat fatigue and sustain performance. Pair concise, impactful copy (because users scroll quickly) with features like captions for silent viewing and clear calls to action. With 237.8 million monetizable daily users, Twitter offers a vast audience, but capturing attention in its fast-paced feed requires sharp, compelling creatives.
Don’t overlook tracking and analytics. Installing the Twitter Pixel before launching your campaign ensures accurate tracking, while regular A/B testing helps validate what works. Prepare for Twitter’s 2026 ad specifications to optimize visibility in the Immersive Media Viewer. Data shows ad engagement has increased 7% year-over-year, and nearly half of female users have made purchase decisions influenced by platform content.
FAQs
What are the key tips for creating successful Twitter ad creatives?
To craft impactful Twitter ad creatives, focus on concise messaging and attention-grabbing visuals. Keep your text short – aim for 50–100 characters – so it’s easy to read on mobile screens. Include a strong call-to-action like “Learn more” or “Shop now”, and, when appropriate, create urgency with phrases like “Limited-time offer” or “Only 24 hours left” to prompt quick responses.
When it comes to visuals, follow Twitter’s guidelines for optimal performance. Use square (1:1) or vertical (9:16) aspect ratios to make the most of the screen space on both desktop and mobile. For videos, keep them brief – under 15 seconds is ideal – with a maximum length of 2 minutes and 20 seconds. Make sure your branding is clearly visible throughout the ad, and consider adding captions or text overlays to enhance clarity.
Think of your creatives as ongoing experiments. Test various combinations of copy, visuals, and CTAs to discover what resonates best with your audience. Growth-onomics offers data-driven solutions to help refine your Twitter ad strategy and deliver measurable outcomes.
How can I use A/B testing to improve my Twitter ads?
A/B testing is a smart way to fine-tune your Twitter ads and improve their effectiveness. The process is simple: choose one element to test – like the ad copy, image, or call-to-action (CTA) – while keeping everything else the same. This way, any differences in performance can be traced back to the single variable you’re testing.
Set up two ad groups: one with the original version and another with the variation. Make sure the audience is randomized for both groups to keep the results unbiased. Let the test run long enough to collect meaningful data, ideally covering both weekdays and weekends to account for different user behaviors. Pay close attention to important metrics such as click-through rate (CTR), cost-per-click (CPC), and conversion rate to see which version delivers better results.
When you’ve identified the stronger version, apply it to your campaign and move on to testing other elements. These constant tweaks might seem small, but over time, they can bring noticeable improvements to your ad performance.
What metrics should I track to optimize my Twitter ads?
To get the most out of your Twitter ads, keep a close eye on the metrics that matter. Start with the basics: impressions, ad spend, and clicks (this includes both ad clicks and link clicks). These give you a clear picture of how many people are seeing and interacting with your ads.
Next, dive into efficiency metrics like click-through rate (CTR), cost-per-thousand impressions (CPM), and cost-per-click (CPC). These numbers reveal how effectively your ads are performing and whether you’re getting a good return on your investment.
Don’t overlook engagement stats such as likes, retweets, and video views. These show how well your content is resonating with your audience. If your campaign is focused on conversions, make sure to track the conversion rate and cost per conversion to see how effectively your ads are driving actions like sign-ups or purchases.
By regularly monitoring these metrics, you can adjust your approach and improve your campaign’s results over time.