

Publisher benchmarking helps you measure your affiliate program’s performance against industry standards and competitors. By analyzing key metrics like conversion rates, earnings per click, and traffic quality, you can identify areas for improvement and opportunities for growth. For example, knowing that the average cost per lead in your industry is $18.00 can turn a seemingly high $12.50 CPL into a competitive advantage.
Key Takeaways:
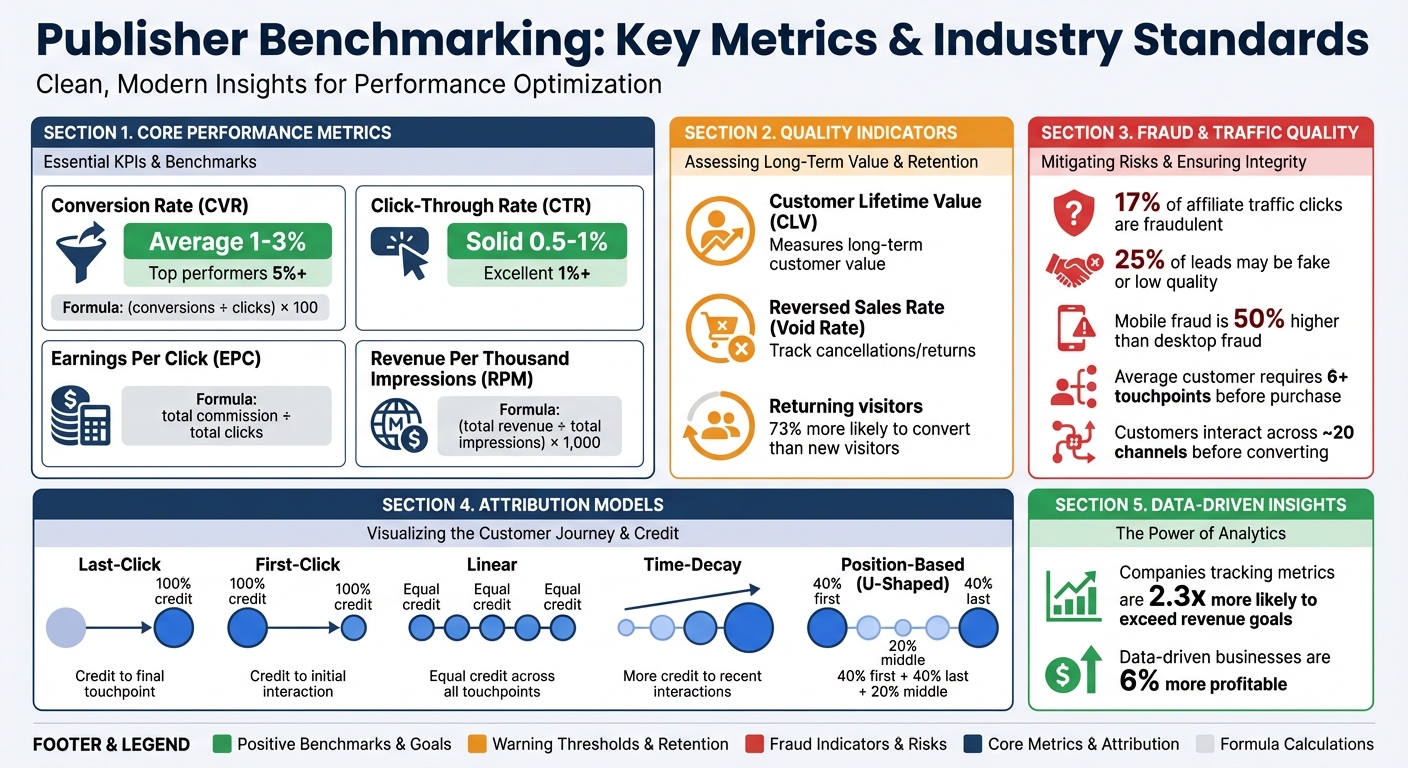
- Metrics to Track: Conversion Rate (CVR), Click-Through Rate (CTR), Average Order Value (AOV), Earnings Per Click (EPC), and Customer Lifetime Value (CLV).
- Traffic Quality: Analyze bounce rates, session duration, and invalid traffic (IVT) to ensure you’re attracting genuine leads.
- Attribution Models: Use models like last-click or data-driven attribution to credit publishers accurately.
- Framework for Success: Set clear benchmarks (minimum thresholds, targets, and stretch goals) based on historical data and industry averages.
By comparing your program’s performance to these benchmarks, you can make data-driven decisions to optimize your affiliate strategy. Tools like Growth-onomics can simplify the process by consolidating data and providing actionable insights.
Key Metrics and KPIs for Publisher Benchmarking
Publisher Benchmarking Key Metrics and Industry Standards
Core KPIs to Measure Publisher Performance
To effectively benchmark publishers, you need to focus on metrics that highlight both performance and quality. These metrics not only help evaluate the success of affiliate programs but also ensure your marketing budget is well spent.
Conversion Rate (CVR) is a key indicator, showing the percentage of clicks that result in sales or leads. It’s calculated as:
CVR = (conversions ÷ clicks) × 100
Most affiliate programs see average CVRs between 1% and 3%, with top performers reaching 5% or more. A high CVR suggests the publisher’s audience matches your offer and that your landing page delivers on expectations.
Click-Through Rate (CTR) measures how many users click on an affiliate link compared to how many see it. CTRs between 0.5% and 1% are considered solid, while anything above 1% is excellent.
Average Order Value (AOV) reflects the average spend per transaction. It’s calculated by dividing total revenue by the number of orders. Publishers with higher AOVs often excel at tactics like upselling or cross-selling, making them valuable partners.
Earnings Per Click (EPC) tracks the average revenue generated for each click sent to your brand. To calculate:
EPC = total commission ÷ total clicks.
Revenue Per Thousand Impressions (RPM) evaluates how much revenue is earned per 1,000 views of a piece of content. The formula is:
RPM = (total revenue ÷ total impressions) × 1,000. This metric highlights which pages deliver the most value, helping you optimize traffic distribution.
"By tracking these important affiliate marketing KPIs diligently, businesses can navigate the intricate affiliate marketing world with precision and finesse."
– Chrissy Kammerer, Director of Content, Partnerize
Customer Lifetime Value (CLV) is another crucial metric, showing the long-term value of customers brought in by a publisher. A higher CLV means the publisher attracts repeat buyers, not just one-time shoppers. Increasingly, affiliate programs are focusing on CLV to identify partners who contribute to sustainable growth.
Lastly, keep an eye on the Reversed Sales Rate (Void Rate), which measures the percentage of sales canceled or returned. A high void rate could indicate product issues or questionable publisher practices.
Lead Quality and Conversion Analysis
Metrics like CVR not only measure the volume of conversions but also reveal their quality. A high CVR typically means the publisher’s audience aligns well with your product and the user experience is on point. Dig deeper into engagement metrics like Bounce Rate, Time on Page, and Scroll Depth to differentiate genuine interest from mismatched traffic. For instance, a high bounce rate might signal a disconnect between the publisher’s ad and your landing page.
Revenue Per Conversion is another useful metric, calculated by dividing total revenue by total conversions. It provides insight into the financial impact of each conversion. Meanwhile, CLV helps distinguish between fleeting buyers and loyal customers. Interestingly, returning visitors are 73% more likely to convert than new ones.
Fraudulent activity is a growing concern in affiliate marketing. Around 17% of affiliate traffic clicks are fraudulent, and nearly 25% of leads generated may be fake or low quality. Monitoring Invalid Traffic (IVT) is essential to ensure you’re not paying for bot traffic or worthless leads. Mobile affiliate fraud, for instance, is 50% higher than desktop fraud due to weaker tracking systems. Regular audits of IVT reports can help catch these issues early.
"A high conversion rate can therefore be an indicator that your ad content, flow, and user experience align with your customers’ expectations."
– Grace Brennan, Author, Semrush
Comparing Cost-Per-Click (CPC) with CVR can also uncover problems. For example, if both metrics are low, your landing page might not be resonating with customers. Additionally, tracking how many pages a visitor explores during a session, alongside their Time on Page, offers a more complete view of engagement – indicating whether users are genuinely interested or leaving too quickly.
Tracking and Attribution Models
Attribution models help assign value to each marketing interaction, making it easier to see which publishers are driving real results versus those simply securing the final click. On average, customers require more than six touchpoints before making a purchase, and they interact with brands across roughly 20 channels before converting. Without proper attribution, allocating your marketing budget effectively becomes a guessing game.
Last-click attribution is straightforward but gives all the credit to the final touchpoint, ignoring the broader customer journey. First-click attribution, on the other hand, focuses on the initial interaction, emphasizing brand discovery. Linear attribution spreads credit evenly across all touchpoints, while Time-decay attribution prioritizes recent interactions, aligning with typical buyer behavior but potentially undervaluing early touchpoints.
Position-based attribution (U-shaped) strikes a balance by assigning 40% credit to both the first and last touchpoints, with the remaining 20% distributed across middle interactions. For a more advanced approach, data-driven attribution uses machine learning to analyze your specific data and determine each interaction’s contribution. Notably, companies that actively track and analyze performance metrics are 2.3 times more likely to exceed revenue goals, and data-driven businesses are 6% more profitable than their peers.
"Attribution is the framework for assigning value to your marketing efforts, helping you connect customer interactions to conversions."
– Lior Torenberg, Northbeam
If you’re new to attribution, start with simpler models like last-click or position-based approaches. As your data grows, you can adopt more complex methods. Regularly audit your tracking setup – like UTM parameters and pixels – to maintain accuracy. Additionally, consider evaluating publishers through post-impression (view-through) conversions, which measure the impact of ads that users see but don’t click. Attribution isn’t just about assigning credit; it’s a strategic tool for smarter budget allocation and stronger publisher relationships.
Evaluating Traffic Quality and Source Stability
Analyzing Traffic Sources
The quality of your traffic often depends on where it’s coming from. Organic search traffic tends to drive strong engagement and has a high potential for conversions, though it may come with higher bounce rates. Striking a balance between SEO efforts and strategies that encourage repeat visitors is key. Direct traffic, on the other hand, reflects strong brand loyalty and frequent return visits. For news and media publishers, larger sites often see the majority of their traffic coming directly, while smaller publishers rely more heavily on referrals and organic search.
To truly understand if your audience is engaged, focus on metrics like bounce rate, average visit duration, pages per session, and the proportion of new versus returning visitors. For example, if bounce rates are unusually high and session durations are brief, it could mean the content on your landing page doesn’t align with what visitors expect.
"What we see is that, in general, bounce rates for organic search traffic is much higher than other sources – this indicates there is a careful balance between solely relying on SEO and having loyal visitors."
– Ariane Turley, SimilarWeb
However, privacy tools and ad blockers can complicate traffic analysis by misclassifying some sources as "direct". Using advanced analytics tools can help uncover the true origins of your traffic, offering a clearer picture of your audience and setting the stage for evaluating your online authority.
Understanding Domain Authority and Rankings
Engagement metrics are only part of the story. Third-party metrics like Domain Authority (DA) provide a snapshot of a publisher’s strength in search rankings. Metrics such as DA, Domain Rating (DR), and Authority Score reflect factors like the quality of backlinks and the number of referring domains. While these numbers are valuable for comparisons, they’re not definitive. Use them alongside other data to evaluate multiple publishers, and pay attention to how a publisher’s backlink profile evolves over time. A stable, growing profile signals long-term trust and authority.
Balancing Traffic Mix for Stability
Relying on a single traffic source can lead to instability. Algorithm updates or new features, like Google’s Search Generative Experience, can quickly impact organic visibility. A diversified approach – combining organic search, direct traffic, referrals, and social media – can help mitigate these risks. For example, during major events, search traffic often spikes leading up to the event, while social media traffic typically peaks afterward.
A real-world example: In November 2020, election-related content drove 35% of all traffic to top U.S. news sites. Monitoring your traffic distribution ensures you’re not overly dependent on any one channel, which is critical for long-term stability and growth.
sbb-itb-2ec70df
Building a Publisher Benchmarking Framework
Turning data into actionable strategies starts with a well-structured benchmarking framework. By focusing on clear goals, thorough data analysis, and targeted optimization, you can ensure your efforts align with your business objectives.
Setting Benchmarking Goals
The first step is to define what you’re measuring. A benchmark compares current performance to past results or competitors, while a KPI tracks progress toward specific business goals.
Begin by establishing a 12–24 month historical baseline. This helps separate seasonal fluctuations from real trends. Then, categorize your performance into three tiers:
- Minimum Thresholds: Indicators of underperformance that demand immediate attention.
- Target Benchmarks: Sustainable goals that align with your industry niche.
- Top-Tier Benchmarks: Aspirational targets modeled after industry leaders.
Your goals should connect directly to measurable outcomes, like increasing newsletter signups, improving subscription retention, or driving affiliate conversions. Avoid focusing on vanity metrics like raw traffic. For instance, if your email open rate is 22% and the industry average is 25%, aiming for 27% is more practical than an unrealistic 40%.
"If all else fails just set your target for a 10% improvement. Anything, absolutely anything, can be improved by 10% with just a small amount of effort."
– Avinash Kaushik, Digital Marketing Evangelist
Segment benchmarks by device (mobile vs. desktop) and channel (organic vs. social) to account for user behavior differences. Always set goals upfront – adding metrics without defining success criteria makes it impossible to evaluate performance later.
Once your goals are clear, it’s time to collect and analyze the necessary data.
Data Collection and Analysis
A strong benchmarking framework relies on four primary data sources:
- Internal Historical Data: Your past performance metrics.
- Industry Reports: Insights from firms like Gartner or Forrester.
- Competitor Intelligence Tools: Platforms such as Similarweb.
- Vendor-Provided Data: Information from tools or platforms you use.
When analyzing competitors, sort them into three categories:
- Immediate Competitors: Those with similar audiences and content.
- Best-in-Class: Industry leaders you aim to emulate.
- Industry Disruptors: Smaller, fast-growing challengers.
Focus on engagement metrics like time on site, scroll depth, recirculation rates, visitor frequency, and in-article click patterns. These metrics uncover actionable insights. For example, most clicks occur within the first 1,000 pixels, but some readers engage further down the page. Break performance down by traffic source, device type, and geography. For instance, U.S. news sites see about 62% of their traffic directly, reflecting strong audience loyalty, while smaller publishers often rely on referrals and organic search.
Keep in mind that conversion rates are tricky to benchmark against external competitors. They’re heavily influenced by unique business strategies and technical setups, so comparing them to your own historical data is more meaningful.
With a clear understanding of your data, you can now create targeted optimization plans.
Creating Optimization Plans
Start by conducting a gap analysis to pinpoint where competitors are outperforming you. Tools that measure Share of Voice (SOV) – your brand’s keyword visibility compared to competitors – can highlight areas for improvement. If you identify content gaps, create a focused content calendar to address them.
Prioritize optimizations that have a direct impact on revenue or lead generation. For example, if your organic traffic shows high bounce rates, it might signal that your landing pages aren’t aligned with search intent.
Set SMART goals (Specific, Measurable, Achievable, Relevant, Time-bound) based on industry medians. Benchmarks are reference points, not rigid targets. Forcing metrics to meet an "average" can lead to poor targeting or inflated costs without real value.
"At our agency, we believe that metrics are only useful if they drive decision-making."
– Guy Hudson, Founder, Bespoke Marketing Plans
Track progress on three levels:
- Monthly: To monitor momentum.
- Quarterly: To align with campaign goals.
- Yearly: To evaluate long-term growth.
Refresh your benchmarks regularly – at least monthly or quarterly – to stay updated with algorithm changes, seasonal trends, and shifting user behaviors. This ensures your optimization plans remain relevant and effective.
Conclusion
Key Takeaways
Publisher benchmarking transforms raw data into actionable insights by providing context – comparing your performance to industry standards, competitors, and your own historical trends. Without this context, it’s nearly impossible to separate true growth from seasonal fluctuations or other noise.
Effective benchmarking focuses on three core areas: traffic acquisition (sources and volume), user engagement (metrics like session duration and scroll depth), and audience loyalty (frequency of visits, returning vs. new users). These metrics go beyond tracking visitor numbers to reveal the quality of interactions. For example, strong audience loyalty often translates to higher direct traffic, a hallmark of success in industries like news and media.
A structured approach is key. Establish three levels of benchmarks: minimum thresholds to identify underperformance, target benchmarks for steady growth, and stretch goals to push your limits. Blend internal data with competitive insights to uncover growth opportunities tailored to your business, rather than merely mimicking competitors. Keep in mind that bounce rates vary widely by industry – ranging from as low as 10%-20% to as high as 70%-80% – making custom benchmarks far more relevant than generic averages.
The digital landscape is shifting fast. Between Q1 2020 and Q1 2021, publishers saw organic search traffic drop from 27% to 23%, while direct traffic increased by 7%. Benchmarking today must also account for AI-driven search tools like Google’s AI Overviews and featured snippets, which are changing how users discover content.
Armed with these insights, you’re ready to make meaningful improvements. Let’s look at the next steps to put this into action.
Next Steps for Your Business
Start by building a 12-24 month historical baseline for your key metrics. This will help you distinguish normal variations from real trends. Segment your data by traffic source and device type to understand audience behavior across different channels, and focus on optimizations that directly impact revenue or lead generation.
Developing a solid benchmarking framework requires expertise in areas like data analytics, competitive intelligence, and performance optimization. That’s where Growth-onomics comes in. Their services – spanning SEO, Performance Marketing, and Data Analytics – are tailored to help businesses navigate complex metrics, evaluate traffic quality, and craft optimization strategies aligned with their goals.
Whether you’re looking to boost performance, build audience loyalty, or maximize ROI, a well-executed benchmarking strategy is your pathway to sustainable growth. Ready to take the next step? Visit Growth-onomics to explore how expert guidance can help you turn benchmarking insights into lasting success.
FAQs
What key metrics should I track for successful publisher benchmarking?
To get a clear picture of how publishers are performing, focus on tracking key metrics like audience reach – this includes unique visitors and pageviews. Combine this with engagement metrics such as average time spent on a page, bounce rate, and scroll depth to understand how users interact with your content. It’s also important to analyze traffic sources and device preferences (desktop vs. mobile) to see where your audience is coming from and how they’re consuming your material.
For revenue insights, pay attention to ad performance metrics like CPM (cost per thousand impressions), RPM (revenue per thousand pageviews), fill rate, and eCPM (effective CPM). Finally, track conversion rates or goal completions to measure how effectively your content encourages desired actions. Together, these metrics offer a well-rounded view of your performance and help pinpoint areas that need attention.
How do attribution models enhance performance evaluation in affiliate programs?
Attribution models distribute conversion credit across all affiliate interactions in a customer’s journey, rather than giving all the credit to the final click (as the "last-click" model does). This method offers a clearer view of how each affiliate contributes to the overall outcome.
With attribution models, marketers gain a deeper understanding of how various affiliates drive results. This clarity allows for more accurate performance assessments and smarter budget allocation, ensuring resources are directed toward the partners delivering the greatest impact.
Why is diversifying traffic sources essential for benchmarking publisher performance?
Diversifying where your traffic comes from isn’t just smart – it’s essential. When you spread your traffic across multiple channels, you’re not overly reliant on just one. This makes your performance metrics more consistent and less prone to sudden disruptions. Plus, tapping into various sources gives you a richer view of how your audience behaves, helping you better evaluate your overall reach and return on investment (ROI).
Sticking to a single source for traffic can put your results at risk. Think about it – algorithm changes or market fluctuations could throw everything off balance. But with a mix of traffic sources, you get a clearer, more reliable snapshot of how your content is performing. This broader approach helps you uncover growth opportunities and set yourself up for long-term success.