

If you want to grow your brand on Instagram, keeping an eye on competitors is essential. With over 200 million business accounts on the platform, understanding what works for others can save you time and money while improving your results. This guide breaks down how to analyze competitor engagement, track key metrics, and use tools to refine your strategy. Here’s what you’ll learn:
- Key Metrics: Focus on engagement rate (likes, comments, saves) and how content performs with actual viewers. Reels, for example, average higher engagement (1.23%) compared to images or carousels.
- Competitor Analysis: Study posting patterns, content types, and audience interactions. Look for gaps in your competitors’ strategies that you can capitalize on.
- Tools to Simplify Tracking: Platforms like Socialinsider and Sprout Social can streamline data collection, while Instagram’s built-in features offer free insights.
- Proven Tactics: Use Reels for reach, carousels for saves, and collaborations with influencers to boost engagement.
How to do a Competitor Analysis on Instagram | 3 Tools and Templates
Key Instagram Engagement Metrics
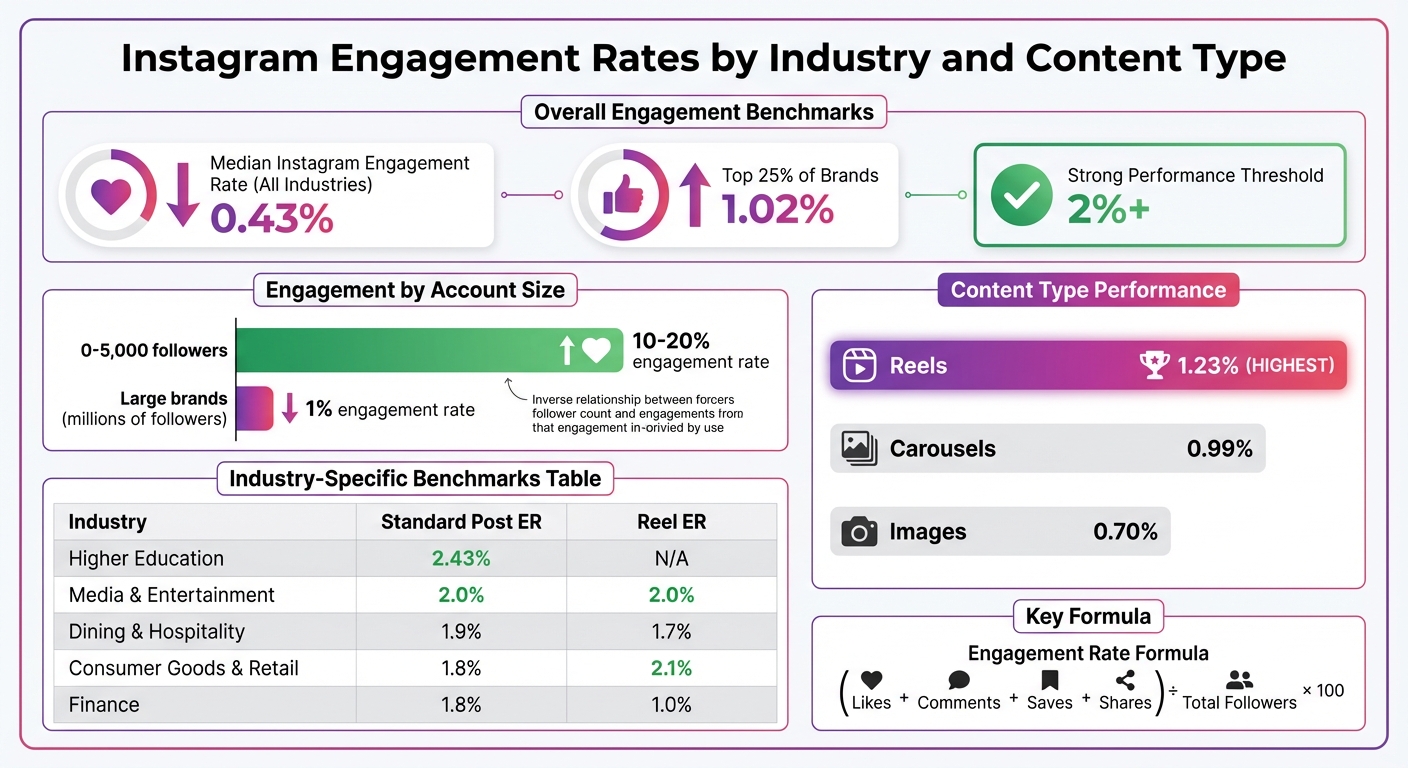
Instagram Engagement Rates by Industry and Content Type 2025
When analyzing Instagram performance, focus on metrics that show how audiences are actually engaging with content – not just vanity metrics like follower count. Below, we break down three key categories to evaluate competitor performance.
Engagement Rate
Engagement Rate (ER) measures the percentage of an audience actively interacting with a post. The formula is: (Likes + Comments + Saves + Shares) ÷ Total Followers × 100. For example, if a competitor with 50,000 followers gets 2,000 likes, 150 comments, and 300 saves on a post, their ER would be 4.9%. That’s well above the median Instagram engagement rate of 0.43% across all industries.
For a more accurate picture, consider using ER by Reach (ERR): (Total Interactions ÷ Reach) × 100. This metric focuses on how content performs with people who actually see it, rather than just total followers. ERR is especially useful for comparing accounts of different sizes or when follower counts include inactive profiles.
Keep in mind that engagement rates vary widely by account size. Smaller accounts (0–5,000 followers) often hit 10% to 20%, while large brands with millions of followers might consider 1% a strong result. The top 25% of brands achieve a median rate of 1.02%. If a competitor consistently surpasses 2%, they’re likely doing something worth studying.
Next, look at the types of interactions to gauge the depth of audience engagement.
Content Interactions
Not all interactions are equal. Likes show quick, surface-level approval, while comments provide deeper insight into audience sentiment. Saves indicate that content is valuable enough for users to revisit, and shares suggest the content resonated so much that people wanted others to see it.
"When it comes to competitor analysis, I pay close attention to community interaction. It’s not just about how often competitors post, but how they show up in the comments. Are they taking time to engage thoughtfully, or just liking responses? How do they handle criticism? Those signals reveal a lot about brand health and audience trust that numbers alone can’t capture." – Georgia Gonzalez, Social Media Manager, Penn State Outreach
For Stories, track replies and engagement with interactive stickers like polls, quizzes, and sliders. For Reels, monitor views and Reel-specific interactions. Reels currently drive the highest engagement, with an average rate of 1.23%, followed by carousels at 0.99% and images at 0.70%. If a competitor’s Reel suddenly performs well, dig into whether it was due to trending audio, an influencer collaboration, or a particular content style.
Comparing these interactions to industry benchmarks can provide even more clarity.
Industry Benchmarks
A competitor’s engagement rate is only meaningful when compared to industry standards. For example, Higher Education brands average an ER of 2.43%, while Finance typically sees 1.8%. Consumer Goods posts average 1.8%, but their Reels perform better at 2.1%.
| Industry | Standard Post ER | Reel ER |
|---|---|---|
| Higher Education | 2.43% | N/A |
| Consumer Goods & Retail | 1.8% | 2.1% |
| Dining & Hospitality | 1.9% | 1.7% |
| Media & Entertainment | 2.0% | 2.0% |
| Finance | 1.8% | 1.0% |
For instance, a Consumer Goods account with a 2.5% ER outpaces the industry average by 40%. That’s a clear signal to examine their content strategy, posting frequency, and engagement techniques. Regular audits – quarterly for fast-moving industries or semi-annually for more stable ones – can help track these shifts.
Tools for Tracking Competitor Engagement
Once you’ve identified the metrics that matter, the next step is finding the right tools to track them. Third-party tools can simplify data collection, providing insights into historical trends, content strategies, and benchmarks. These tools turn raw engagement data into actionable insights.
Third-Party Analytics Tools
Professional analytics platforms streamline competitor tracking by consolidating data into a single dashboard, saving you hours of manual work. Socialinsider, for example, offers features like content pillar analysis and campaign tagging. With a 14-day free trial, it’s a great option for brands looking to understand which content types – like tutorials or product shots – generate the most engagement. Sprout Social, starting at $249/month, includes competitor reports and advanced listening features, though its full functionality requires a Professional Plan or higher. If you need automated PDF exports or hashtag tracking, NapoleonCat provides these features along with a 14-day trial, no credit card required.
For influencer analysis, Phlanx offers tools to calculate engagement and verify follower authenticity, helping you spot inflated metrics. Fanpage Karma is another useful option, offering unlimited profile tracking and heatmaps to identify the best posting times – ideal for managing data from multiple competitors. If you’re looking for a broader view of competitor strategies, Panoramata tracks not just social media but also competitor ads, emails, and website updates.
| Tool | Key Features | Best For | Limitation |
|---|---|---|---|
| Socialinsider | Content pillar analysis, benchmarking, campaign tagging | Detailed strategy insights | Requires a subscription for extended historical data |
| Sprout Social | Competitor reports, advanced listening, optimal send times | Enterprise-level management | High cost; limited features in basic plans |
| NapoleonCat | Automated PDF reports, hashtag tracking, benchmarking | Client reporting | N/A |
| Phlanx | Engagement calculators, influencer audits | Vetting influencers | Narrow focus on influencer metrics |
| Fanpage Karma | Unlimited profile tracking, posting time heatmaps | Managing large data sets | N/A |
| Panoramata | Tracks social media, ads, and website changes | Comprehensive competitor analysis | Smaller historical database, as it’s a newer platform |
It’s important to note that no tool can provide exact audience demographic data or precise "Saves" metrics from competitors. Additionally, many tools limit the number of competitors you can track at once. For example, ContentStudio allows tracking for only five profiles in its standard plan. If you’re working in a crowded industry, double-check these restrictions before committing to a platform.
For those wanting to start with a no-cost option, Instagram’s built-in features offer a solid alternative.
Instagram’s Built-In Features
If you’re not ready to invest in third-party tools, Instagram itself provides some helpful, free options. By visiting a competitor’s profile and clicking the "Suggested for You" dropdown, you can uncover indirect competitors – brands targeting a similar audience with different products or services.
Using the "Tags" search can also reveal which brands dominate specific hashtags. For instance, searching #activewear can show which fitness apparel brands are leading the conversation. Additionally, manually reviewing a competitor’s recent posts provides valuable insights into their posting frequency, caption style, and how they engage with their audience. This manual approach, while time-intensive, can reveal how brands handle criticism or foster community interactions – details that automated tools might overlook.
Keep in mind that Instagram’s built-in features won’t provide historical data or calculate engagement rates, but they’re a great way to perform an initial analysis before committing to a paid platform.
How to Analyze Competitor Engagement
Transforming competitor data into actionable strategies involves pinpointing the right competitors, observing their posting habits, and dissecting the methods they use to boost engagement. By analyzing the timing and frequency of their posts, you can uncover patterns that might work for your own content.
Finding Relevant Competitors
Start by categorizing competitors into three groups: Direct competitors (offering the same products to the same audience), Indirect competitors (different products but targeting the same audience), and Aspirational competitors (industry leaders setting benchmarks). For a more focused analysis, narrow your scope to 3–10 competitors instead of spreading your efforts across too many profiles.
Instagram’s search bar can be a powerful tool. Use niche-specific keywords and check the "Accounts" tab for profiles that include those terms in their bio or username. If you’re a local business, location tags can help identify nearby competitors. The "Suggested for You" feature on competitor profiles is another great way to discover similar brands you might have missed. To ensure these accounts are actively engaging on Instagram, cross-check them on LinkedIn, TikTok, or Google. Additionally, pay attention to brands tagged or mentioned by influencers in your niche – they could be vying for the same audience.
Monitoring Posting Patterns
Understanding how often and when your competitors post is key. Some brands prioritize frequent posts to maintain visibility, while others focus on less frequent but high-quality "hero" content. The type of content they post also reveals their strategy. For instance, carousels often aim for Saves and deeper engagement, whereas Reels are designed to maximize reach.
Analytics tools can help you identify when a competitor’s audience is most active. For example, a case study on the language app Babbel found peak engagement on Thursdays between 2 PM and 3 PM, and on Tuesdays from 5 PM to 7 PM CET. Experiment with these time slots to see if your audience reacts similarly. You can also map out competitors’ content pillars by categorizing their posts into themes like tutorials, behind-the-scenes content, or user-generated posts to see which topics resonate most. Keep an eye on whether their posting frequency changes during weekends, holidays, or seasonal events.
Once you’ve reviewed their posting schedules, dive deeper into the specific tactics competitors use to drive engagement.
Analyzing Engagement Tactics
Take a closer look at the strategies competitors use to spark interactions. For instance, in June 2025, Dior Beauty teamed up with influencer Sooyaa to promote the Dior Addict Tutu case, and the engagement-per-follower rate for this campaign outperformed their usual content pillars during that time. This example underscores how influencer collaborations, user-generated content, contests, or giveaways can yield strong results.
Pay attention to the first three seconds of top-performing Reels or the opening slides of carousels to see how competitors grab attention. Dive into the comments to gauge sentiment and differentiate between meaningful engagement and superficial responses. Identify which creators competitors frequently tag, as long-term partnerships with ambassadors tend to deliver better ROI compared to one-off posts. Also, analyze their hashtag strategies – look for a mix of branded, industry-specific, and niche tags to ensure they’re targeting a broad yet relevant audience. Finally, search for content gaps – topics your audience is interested in that competitors might be neglecting. These gaps provide an opportunity for your brand to stand out.
"Create Brands should be running competitive audits on a quarterly, semi-annual, or annual cadence. The factors impacting the frequency will include the size of the brand, resources at its disposal, and the competitiveness of its marketplace."
- Tom Miner, Managing Partner, Gold Miner Media
sbb-itb-2ec70df
Instagram Engagement Case Studies
These real-world examples show how brands can turn strategies into action to elevate their Instagram performance.
Case Study: User-Generated Content Campaigns
When brands make their presence more relatable – like featuring team members or maintaining active DMs – they often see engagement rates surpassing industry norms. Encouraging customers to share their personal experiences with products, such as styling tips or everyday use, creates genuine social proof that resonates with audiences and drives sales. This approach builds trust far more effectively than highly polished, traditional brand photography.
Now, let’s explore how brands use influencer partnerships to achieve authentic connections.
Case Study: Influencer Partnerships
ColourPop skillfully collaborates with micro-influencers who create casual, relatable Reels and Stories, often skipping overly obvious ad tags. Meanwhile, brands like Lululemon, Magic Spoon, and Chipotle focus on ambassador programs, trainer partnerships, and creator duets to foster trust and community engagement. Instagram’s "Collab" feature amplifies this strategy by allowing posts to appear on both the influencer’s and the brand’s profiles, resulting in an estimated $4.12 in earned media value for every $1 spent.
Another method that delivers strong engagement is the use of carousel posts.
Case Study: Carousel Posts for Saves
Carousel posts encourage saves by offering content that users find educational or worth revisiting. Refinery29, for example, uses carousels to present data like gender wage gap statistics in an engaging visual format, prompting users to save the posts. BuzzFeed Tasty combines videos and images in carousels to share recipes, often including the full recipe in captions to make the posts even more practical. Meanwhile, Duolingo uses carousels to tell customer success stories through quirky animations, breaking the narrative into bite-sized, visually appealing slides. They also include captions like "swipe left" to guide users, as Instagram sometimes shows the middle or final slide first.
| Partnership Tactic | Primary Goal | Example Brand |
|---|---|---|
| Micro-Influencer Reels | Organic Authenticity | ColourPop |
| Trainer/Athlete Collabs | Dynamic Interaction | Lululemon |
| Creator Duets | Community Engagement | Chipotle |
| Ambassador Landing Pages | Long-term Loyalty | Magic Spoon |
These examples highlight how studying competitor strategies can provide a clear path to improving your own Instagram engagement efforts.
Applying Competitor Insights to Your Strategy
Building on your competitor data, you can use these tactics to refine and elevate your Instagram approach.
Adopting Proven Tactics
After breaking down what’s working for your competitors, it’s time to put those findings into practice. For starters, focus on Reels – they’re a powerhouse for reach, with 79% of consumers saying they’ve made purchases after watching them. If you notice competitors getting strong engagement on carousel posts, try using this format for educational content like tutorials or step-by-step guides that encourage users to save and revisit.
Timing is everything, so align your posting schedule with the peak engagement times revealed in your competitor research. And don’t underestimate the power of Instagram Stories. Interactive features like polls, Q&A stickers, and sliders not only increase audience participation but also improve your visibility in the algorithm.
"When it comes to competitor analysis, I pay close attention to community interaction. It’s not just about how often competitors post, but how they show up in the comments. Are they taking time to engage thoughtfully, or just liking responses? Those signals reveal a lot about brand health and audience trust."
- Georgia Gonzalez, Social Media Manager, Penn State Outreach
Another smart move? Fill the gaps where competitors fall short. For example, if they’re not posting user-generated content or behind-the-scenes moments, step in and capture that audience attention with these overlooked formats.
Using Growth-onomics for Data-Driven Strategies
To take your strategy even further, advanced tools like Growth-onomics can help you dive deeper into the data. This approach goes beyond surface-level trends, using analytics to pinpoint exactly which content features drive engagement. Through tagging and correlation analysis, Growth-onomics categorizes competitor posts by details like the number of people in a photo, product placement, or even the setting. This helps identify what truly resonates with audiences.
Their performance marketing services also help you benchmark your metrics – like engagement rates, follower growth, and posting frequency – against both direct and aspirational competitors. Plus, they track the ROI of competitor influencer partnerships and co-branded campaigns, giving you insights on how to allocate your budget more effectively.
By analyzing sentiment and brand voice in competitor interactions, Growth-onomics helps you carve out a distinct identity. Whether you aim to be playful, authoritative, or educational, this analysis ensures your approach connects with your audience while steering clear of common missteps.
With 85% of companies now relying on social media data as a primary source of business insights, Growth-onomics ensures you’re not just collecting data – you’re turning it into strategies that drive real results. From customer journey mapping to UX optimization, their integrated approach ensures every insight aligns with your broader business objectives.
Conclusion
Studying competitor engagement on Instagram isn’t about copying what others do – it’s about learning from them, spotting opportunities you might have missed, and refining your own approach. With a staggering 90% of Instagram users following at least one brand, the platform offers immense potential. But to tap into that potential, you need to understand what truly clicks with your audience. Competitor analysis helps you skip the guesswork, providing a clear path to strategies that deliver results.
Metrics like engagement rates, follower growth, and content performance are important, but they only tell part of the story. Context matters. For example, knowing that 79% of consumers have made a purchase after watching Instagram Reels highlights the power of focusing on this format. By using analytics tools effectively, you can turn raw data into actionable insights – like the best times to post, gaps in your content, and how your audience feels about your brand.
"The brands that win need not be the loudest but the quickest to learn and adapt." – Socialinsider
Insights alone, however, won’t drive success. The real game-changer is acting on them. Whether it’s filling content gaps, doubling down on high-performing formats like carousel posts, or fine-tuning your posting schedule to match peak activity times, every insight should lead to a concrete action. From evaluating influencer partnerships for ROI to identifying the visual styles your audience loves, your strategy should evolve based on what the data reveals.
With 85% of companies now relying on social data as a primary source of business insights, competitor analysis has become a must-have tool. To stay ahead of shifting audience preferences and emerging trends, consider auditing your strategy quarterly or semi-annually, depending on your industry’s pace. By consistently leveraging competitor insights, you can keep your Instagram strategy sharp, adaptive, and always one step ahead.
FAQs
How can I find and analyze my top competitors on Instagram?
To figure out who your main competitors are on Instagram, start by diving into industry-specific hashtags, keywords, and location tags. Check out accounts that often pop up in search results, the "Suggested for You" section, or even the "Followers Also Follow" lists of brands you look up to. Focus on profiles that have a follower count, posting habits, and audience demographics similar to yours.
Once you’ve pinpointed 3–5 competitors, take a closer look at their performance. Keep track of metrics like their follower growth rate, engagement rate (calculated as average likes and comments divided by follower count), the types of content they post (Reels, Stories, carousel posts), and how often they post. Notice patterns like the hashtags they use repeatedly, content formats that perform well, and any standout tactics they use to connect with their audience.
Use these insights to evaluate your own profile and spot areas where you can improve. Adjust your strategy by borrowing effective ideas from your competitors, whether it’s boosting engagement through Stories or trying out trending hashtags. If you want a more data-driven approach, tools like Growth-onomics can help you turn these observations into actionable plans to level up your Instagram game.
What are the best tools to track Instagram engagement metrics?
To keep tabs on Instagram engagement metrics like likes, comments, saves, shares, video views, and follower growth, a few tools stand out for their practical features and ease of use. Sprout Social offers a straightforward dashboard that provides real-time engagement data, insights into top-performing posts, and even audience sentiment analysis. Socialinsider dives deep into analytics, covering post engagement, hashtag performance, and competitor benchmarks, giving you a clear picture of what’s working and where to improve. Metricool not only tracks engagement but also integrates content scheduling, letting you see how formats like carousels, Reels, and Stories stack up in performance.
For those needing more advanced reporting, Supermetrics connects Instagram data to tools like Google Data Studio or Excel, allowing you to build custom dashboards tailored to your needs. Meanwhile, Panoramata focuses on competitor tracking, delivering daily updates on engagement trends and notifying you of any major shifts. These tools can help businesses in the U.S. fine-tune their Instagram strategy, improve content performance, and stay ahead by comparing their efforts with competitors.
How can I use Instagram Reels to increase engagement effectively?
Instagram Reels are a fantastic way to increase engagement because the platform favors videos that grab and hold viewers’ attention. To make the most of this opportunity, kick off each Reel with a compelling hook in the first 3 seconds, stick to a vertical full-screen format, and pair your video with trending audio that aligns with your brand. These choices signal to Instagram’s algorithm that your content is worth promoting.
To make your Reels actionable and shareable, add captions for viewers who watch without sound. Include clear calls-to-action like “Save this for later!” or “Tag a friend who needs this,” and share quick tips or behind-the-scenes moments that resonate with your audience. Consistency is key – post when your followers are most active, typically during weekday evenings (ET), and try incorporating trending hashtags or challenges to tap into niche communities.
Keep an eye on performance metrics such as average watch time, completion rates, and saves to identify what resonates most. Leveraging a data-driven approach with tools like Growth-onomics can help you fine-tune your strategy and create Reels that consistently boost engagement.