

Experimentation tools help businesses make better decisions by testing changes – like new designs, features, or marketing strategies – on small user groups before rolling them out widely. These tools provide data-driven insights, replacing guesswork with measurable results. Key types include:
- A/B Testing: Compare two versions of a webpage or feature to see which performs better. Ideal for simple changes like button colors or headlines.
- Multivariate Testing (MVT): Test multiple elements (e.g., headlines, images) at once to find the best combination. Requires more traffic but offers deeper insights.
- Feature Flagging: Allows developers to turn features on or off without redeploying code, enabling safer, controlled rollouts.
Top features to look for:
- Statistical Accuracy: Methods like CUPED or sequential testing improve sensitivity and reduce errors.
- Integration: Tools should connect seamlessly with data warehouses like Snowflake or BigQuery.
- Reporting: Real-time dashboards, user segmentation, and insights beyond clicks or conversions.
Experimentation isn’t just for large companies – small businesses see benefits too, with 43% of users coming from smaller teams. The key is to prioritize meaningful tests, track results carefully, and scale efforts over time. Whether you’re optimizing a landing page or testing new app features, these tools turn data into smarter decisions.
A/B Testing Explained: Complete Guide for Beginners
Types of Experimentation Tools
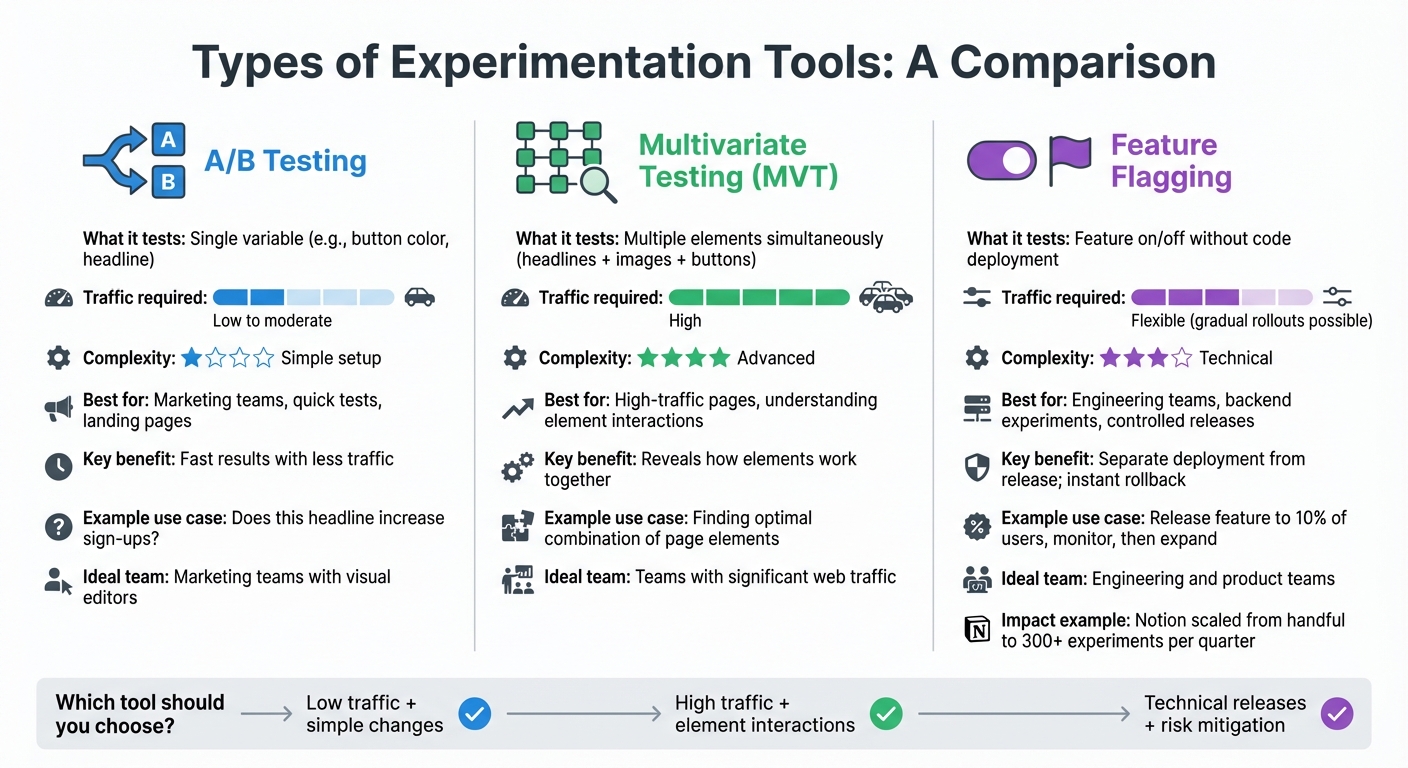
Comparison of A/B Testing vs Multivariate Testing vs Feature Flagging
Experimentation tools come in various forms, each tailored to specific needs. A/B testing, for example, pits two versions of a single element – like a red button versus a blue one on a checkout page – against each other. These tests are relatively simple to set up and require less traffic to deliver statistically significant results. That’s why marketing teams often rely on A/B testing to fine-tune landing pages, email campaigns, or minor UI tweaks.
Multivariate testing (MVT) takes things up a notch by testing several variables at the same time. Instead of just comparing button colors, you might test combinations of headlines, images, and button colors to find the best mix. But there’s a catch: MVT demands significantly higher traffic because it involves testing multiple combinations. For instance, testing 4 headlines, 3 images, and 2 button colors creates 24 different combinations. This method is ideal for high-traffic pages and reveals how different elements interact – something A/B tests can’t do. However, if your page has low traffic, achieving statistically significant results can take a while.
On the technical side, feature flagging platforms give engineering and product teams the power to toggle features on or off without deploying new code. This separation between code deployment and feature release means you can push updates live but keep them hidden until you’re ready to activate them. For example, when Notion adopted Statsig’s feature flagging platform in 2025, they scaled their experiments from just a handful per quarter to over 300.
The right tool depends on your team’s goals. Marketing teams often prefer tools with visual editors for quick test launches – quip, for instance, sped up their testing by 40× using such platforms. Engineering teams, on the other hand, need robust tools like feature flags to handle backend experiments. And if you’re testing how multiple elements interact, MVT is an excellent choice – provided you have enough traffic.
"Statsig’s infrastructure and experimentation workflows have been crucial in helping us scale to hundreds of experiments across hundreds of millions of users." – Paul Ellwood, Data Engineering, OpenAI
Here’s a closer look at the key testing methods and their unique advantages.
A/B Testing Tools
A/B testing tools are designed to compare two versions of a webpage, email, or feature by splitting your audience randomly and measuring which version performs better. These tools are perfect for answering straightforward questions like, "Does this headline increase sign-ups?" or "Will moving the call-to-action button above the fold boost conversions?" They focus on testing one variable at a time.
The setup is quick and doesn’t require massive traffic volumes, making A/B testing a go-to option for small to mid-sized businesses just starting with experimentation. Marketing teams love these tools because many come with visual editors, allowing for drag-and-drop changes without any coding. This makes it easy to launch campaigns rapidly.
However, there’s a technical consideration to keep in mind: if you’re using client-side A/B testing tools, make sure they include anti-flicker technology. Without it, users might briefly see the original page before the test variant loads, which can distort results and harm the user experience. For critical pages, server-side testing is a better option since it ensures the correct variation is loaded before the page displays.
Multivariate Testing Tools
Multivariate testing tools let you test multiple page elements simultaneously to find the best combination. Instead of just tweaking one aspect, you can experiment with variations in headlines, images, and button colors to see how they work together.
This method is especially useful for uncovering how elements interact. For example, a bold headline might pair well with a simple image but clash with a busy background. These insights are invaluable for optimizing high-traffic pages, where even small improvements can lead to significant revenue gains. However, the downside is that MVT demands a large volume of traffic to deliver reliable results. If your page doesn’t get enough visitors, sequential A/B tests might be a more practical alternative.
For teams focused on technical releases, feature flagging platforms offer a completely different set of capabilities.
Feature Flagging Platforms
Feature flagging platforms allow technical teams to manage feature releases with greater flexibility. By toggling features on or off without deploying new code, these platforms separate code deployment from feature activation, reducing risks and enabling controlled rollouts.
This approach is particularly useful for mitigating risks. For instance, you can release a new feature to a small subset of users and monitor key metrics like error rates and performance. If something goes wrong, you can disable the feature immediately. Brex, for example, managed to cut experimentation costs by 20% and reduced the manual workload for data scientists by 50% using feature flagging.
"The biggest benefit is having experimentation, feature flags, and analytics in one unified platform. It removes complexity and accelerates decision-making by enabling teams to quickly and deeply gather and act on insights without switching tools." – Sumeet Marwaha, Head of Data, Brex
Feature flags also allow for gradual rollouts, where you slowly increase a feature’s exposure as performance metrics improve. This method helps identify potential issues early while protecting revenue and brand reputation.
Key Features to Look for in Experimentation Tools
Choosing an experimentation tool is just the start. To make sure your experiments lead to actionable insights rather than wasted resources, it’s essential to evaluate the features that ensure reliable and meaningful results.
Statistical Analysis and Accuracy
The backbone of any experimentation tool is its statistical engine. Without a strong foundation here, you risk basing decisions on misleading data – whether that’s false positives or missed opportunities.
Modern platforms typically rely on one of three statistical approaches:
- Frequentist methods: These are used by tools like Adobe Target and rely on traditional t-tests. With this approach, you must wait for a predetermined sample size before analyzing results. While this is great for industries that demand cautious decision-making, it doesn’t allow for early peeks at data without increasing the risk of false positives.
- Bayesian methods: Platforms like VWO use this approach, offering metrics such as "probability to beat baseline", which are easier for business teams to interpret. However, these methods can sometimes feel like a "black box", making it harder for data teams to validate the calculations.
- Sequential testing: Tools like Statsig and Eppo employ techniques such as mixture Sequential Probability Ratio Tests (mSPRT). This method allows continuous monitoring without compromising the validity of results. While sequential testing can have slightly lower statistical power (around 62% compared to 80%), it enables quicker decisions when effects are clear.
Beyond the statistical method, look for features that enhance sensitivity and reduce errors. For instance, CUPED (Controlled-experiment Using Pre-Experiment Data) can boost sensitivity by 30% to 50%, cutting down the time needed to achieve significance even with lower traffic. It also reduces variance by 14% to 86%, depending on how well historical data aligns with current metrics.
Other must-have capabilities include:
- Sample Ratio Mismatch (SRM) detection: Flags issues when traffic isn’t splitting correctly between variants.
- Outlier mitigation: Techniques like Winsorization ensure extreme data points don’t skew results.
- Multiple comparison corrections: Methods like Bonferroni or Benjamini-Hochberg reduce false positives when testing multiple variations or metrics.
A real-world example of robust statistical capabilities comes from Cox Automotive, which owns Kelley Blue Book and Autotrader. In 2025, under Sabrina Ho’s leadership, the company improved its experimentation program’s health score by 27% in just one quarter. By adopting a platform with advanced statistical tools and automated templates, they cut analysis time from weeks to minutes.
Ease of Integration
Even the most advanced experimentation tool is only as good as its ability to integrate with your existing systems. Poor integration leads to data silos, manual processes, and errors that can undermine your experiments.
A warehouse-native architecture is critical. Tools that connect directly to data warehouses like Snowflake, BigQuery, Databricks, or Redshift maintain a unified source of truth, ensure data governance, and reduce latency. As a representative from Chewy noted:
"We define our own sessions, and we define our own metrics. Everything already sits in our warehouse as a single source of truth".
Your experimentation platform should also support a wide range of SDKs and APIs. Leading tools offer 30+ open-source SDKs across major programming languages and frameworks, including options for edge computing in performance-critical scenarios. For marketing teams, visual editors that allow drag-and-drop changes without coding can be game-changing. For instance, quip’s digital product team became 40× faster at launching tests after adopting such a feature.
Minimizing latency is another key consideration. Client-side testing tools can cause a "flicker" effect, where users briefly see the original page before the test variant loads. This not only skews results but also harms user experience. Look for tools with "no-latency" SDKs and edge delivery options that ensure users see the correct variation immediately.
Statsig provides a compelling example of seamless integration in action. Between 2021 and 2024, Notion scaled from running a handful of experiments per quarter to over 300. Mengying Li, Data Science Manager at Notion, credited this growth to Statsig’s ability to integrate effortlessly with their existing infrastructure, eliminating the need for manual coordination.
"The biggest benefit is having experimentation, feature flags, and analytics in one unified platform. It removes complexity and accelerates decision-making by enabling teams to quickly and deeply gather and act on insights without switching tools." – Sumeet Marwaha, Head of Data, Brex
Reporting and Insights
Even with strong statistical methods and seamless integration, experiments are only as useful as the insights they generate. Clear, actionable reporting is essential for turning raw data into meaningful decisions.
Real-time monitoring is a must-have. Tools like Statsig handle over 1 trillion events daily with 99.99% uptime, ensuring dashboards always reflect up-to-date performance. Automated alerts can help catch issues early, saving time and resources.
Your reporting should go beyond surface-level metrics like clicks or conversions. Tracking broader business metrics – such as Customer Lifetime Value (LTV), subscription renewals, churn rates, or revenue – provides a more comprehensive view of an experiment’s impact. For example, Brooks Running used Optimizely’s reporting tools in 2024 to analyze personalized sizing recommendations. By focusing on downstream metrics like return rates, they achieved an 80% reduction in shoe returns.
Other powerful reporting features include:
- User segmentation and cohort analysis: These tools reveal how different groups respond to changes, enabling more tailored experiences. Personalized experiences, for instance, have been shown to drive a 41% higher impact compared to generic approaches.
- Transparency and governance: Platforms that allow access to the underlying SQL queries behind calculations build trust and let data teams validate results.
- Qualitative insights: Features like session replays, heatmaps, and click patterns provide context behind the numbers, helping you understand user behavior – such as why they may click non-functional elements or struggle with navigation.
Effective reporting bridges the gap between data and decision-making, ensuring that everyone – from data scientists to business stakeholders – can act on insights with confidence.
sbb-itb-2ec70df
Implementation Strategies for Experimentation Tools
Once you’ve chosen tools with the right features, the next step is making sure they’re implemented effectively across your organization. A thoughtful approach here can make all the difference.
Planning Effective Experimentation Roadmaps
Start by connecting your experimentation platform to your data warehouse (e.g., Snowflake, BigQuery, or Databricks). This integration allows you to directly link tracking to business outcomes.
Then, focus your experiments on your key growth drivers. Instead of testing randomly, determine whether your current priority is acquisition, retention, or monetization. This approach ensures you’re directing resources toward experiments that address your business’s most pressing needs.
To prioritize effectively, try the PIE framework (Potential, Importance, Ease). Score your ideas on a 1–10 scale and focus on those that promise the greatest impact with the least effort. This method ensures your tests are purposeful and not just done for the sake of testing.
Set up "Do No Harm" metrics to safeguard overall product health. For instance, a test that increases ad clicks might also slow down your site, leading to user drop-offs. Metrics like page load time or retention rates can help you spot and avoid such trade-offs.
While the average company runs 34 experiments annually, top-performing organizations conduct over 500. However, more isn’t always better. Research shows the impact per test peaks at 1–10 tests per engineer annually. Beyond 30 tests per engineer, impact drops by a staggering 87%. The takeaway? Quality and focus are far more important than sheer volume.
Interpreting Results and Iterating
Misinterpreting results can derail even the best experiments. Avoid defining success after the fact, as this can lead to confirmation bias. Economist Ronald Coase famously said:
"If you torture the data long enough, it will confess to anything".
Instead, define success criteria upfront. Before launching a test, align with stakeholders on which metrics matter, what defines success, and how you’ll act on the results – whether they’re positive, negative, or neutral. This clarity prevents cherry-picking favorable outcomes or extending tests indefinitely in search of different results.
Frame your tests around solving real user problems, not just hitting business metrics. For example, instead of aiming to "increase conversion rate by 5%", focus on addressing specific friction points like "Users are confused by our pricing page messaging." This shift leads to more meaningful insights. In 2024, Cox Automotive adopted this approach under Sabrina Ho’s leadership, boosting their experimentation program’s health score by 27% in just one quarter by using templates that cut analysis time from weeks to minutes.
Track long-term outcomes to validate the impact of your tests. Brooks Running provides a great example: by combining personalized sizing recommendations with their internal data, they reduced shoe return rates by 80%. They didn’t stop at tracking clicks on the sizing tool but measured how it affected returns – a much more valuable metric.
Finally, remember that failures are as valuable as successes. A failed test that disproves a false assumption about your users is just as insightful as one that boosts revenue. Don’t overlook these lessons – they’re crucial for learning and growth.
Scaling Experimentation Across Teams
Once you’ve gathered actionable insights, the next step is scaling experimentation across your organization. This doesn’t mean running more tests; it means enabling all teams to test independently while maintaining rigor. For example, quip introduced visual editors that allowed non-technical teams to launch their own A/B tests. This shift made them 40× faster at rolling out experiments compared to relying solely on a centralized digital team.
To scale effectively, ensure all teams work from a single source of truth. As Dan Waldman, Senior Technical Product Manager at Chewy, explains:
"We define our own sessions, and we define our own metrics. Everything already sits in our warehouse as a single source of truth".
Create a centralized experiment archive to document hypotheses, variations, and results. This archive prevents teams from repeating failed tests and builds a shared knowledge base that compounds over time. Without this, teams risk starting from scratch with every new project.
Implement standardized workflows to streamline the process. Use structured idea forms, automated approval systems, and tools like Kanban boards to improve visibility across teams and time zones. Only 29% of employees report satisfaction with current collaboration methods, so having clear workflows is essential.
Balance speed with quality by setting statistical guardrails. Define organization-wide standards for minimum sample sizes, significance levels (typically 95% or 98%), and test durations. These guardrails ensure rigor as more teams start testing independently.
Consider using global holdouts – control groups that never see experimental changes. These holdouts help measure the cumulative, long-term impact of your experiments on top-line business goals. This approach ensures your testing program is driving real progress rather than just creating noise.
Finally, encourage teams to test multiple variations instead of sticking to simple A/B tests. Tests with four or more variations are 2.4× more likely to succeed and deliver 27.4% higher uplifts than basic two-variant tests. As your program matures, this approach accelerates learning and uncovers insights that simpler tests might miss.
How Growth-onomics Supports Experimentation Success

Running experiments is important, but the real goal is driving measurable business growth. Growth-onomics bridges the gap between experimentation tools and strategic growth initiatives, ensuring that testing is not just an isolated process but a driver of sustainable success. By embedding experimentation into your data systems and aligning it with your business objectives, Growth-onomics transforms testing into a core part of your growth strategy.
Data-Driven Strategies for Experimentation
Many businesses struggle to connect their experiments with meaningful outcomes. Growth-onomics addresses this by tying your data initiatives directly to your key objectives, ensuring that experimentation becomes a tool for amplifying value rather than a disconnected activity. This approach is built on five essential pillars: data governance, architecture, operations, analytics, and security.
By integrating experimentation platforms with your data warehouse – whether you use Snowflake, BigQuery, or Databricks – Growth-onomics creates a single source of truth. This allows you to track critical metrics like revenue, retention, and customer lifetime value, moving beyond surface-level indicators like click-through rates. It also replaces gut-based decision-making with systematic, hypothesis-driven testing, ensuring that experiments directly inform your core business metrics.
Customizing Solutions for Business Growth
Every business faces unique growth challenges, so cookie-cutter solutions simply don’t work. Growth-onomics customizes experimentation based on your specific customer journey and UX insights. By identifying areas where users encounter friction, we design experiments that address these exact pain points.
Customization also extends to statistical approaches. For high-stakes decisions requiring compliance, we use Frequentist models. For iterative, stakeholder-friendly results, we rely on Bayesian models. Additionally, we employ techniques like CUPED (Controlled-experiment Using Pre-Experiment Data), which boosts experiment sensitivity by 30-50% and significantly shortens test durations.
Whether your team needs no-code visual editors for marketing or powerful SDKs for engineering server-side tests, Growth-onomics ensures every department can run experiments independently while maintaining statistical accuracy. These tailored approaches naturally lead to measurable improvements and stronger business outcomes.
Maximizing ROI with Growth-onomics
Growth-onomics helps businesses view experimentation as a strategic investment with clear returns. The process begins by establishing baseline KPIs – such as Daily Active Users (DAU), sign-up conversion rates, or Revenue Per Visitor (RPV) – and setting quantifiable goals, like increasing sign-up conversions by 1.5 percentage points over 12 months.
To ensure resources are allocated effectively, we use prioritization frameworks like RICE (Reach, Impact, Confidence, Effort). By automating parts of the experimentation process, we help teams scale their efforts from a few tests per quarter to multiple tests per month. This increased velocity can yield an ROI of up to 3,900%, thanks to the ability to double test throughput.
We also emphasize statistical precision. Through power analysis, we calculate Minimum Detectable Effect (MDE) and required sample sizes – for example, needing 21,000 users per variant to detect a 10% lift on a 3% baseline. This ensures tests are neither underpowered nor prone to false positives. Additionally, we implement global holdouts to measure the long-term cumulative impact of your entire experimentation program, rather than just focusing on individual wins.
Conclusion
Experimentation tools have grown far beyond basic A/B testing software. Today, they serve as a powerful decision-making framework that fuels steady growth and helps businesses make smarter choices based on real user data. Leading companies rely on these tools to validate every change with measurable results.
The move toward warehouse-native platforms has shifted the focus of experimentation to metrics that truly matter – revenue, customer lifetime value, and retention. By directly connecting experiments to these outcomes, businesses can make decisions that align with their long-term goals.
But true success in experimentation goes beyond just picking the right tool. It requires integrating these tools into your existing data systems, setting clear and actionable hypotheses for every test, and using advanced techniques like CUPED variance reduction to speed up insights by 30–50%. Starting with small rollouts is a smart way to identify potential issues early on.
The most effective teams combine quantitative data from tests with qualitative insights from tools like heatmaps and session recordings. They also automate repetitive tasks, freeing up time for strategic planning, and focus on measuring long-term outcomes rather than just short-term metrics like clicks.
Whether you’re just beginning with A/B testing or managing hundreds of experiments at once, the key is to test thoroughly, track the metrics that matter, and let data guide your decisions. When done right, experimentation evolves from a routine task into a strategic driver of growth and innovation.
FAQs
What’s the difference between A/B testing and multivariate testing, and how do I choose the right one?
The decision between A/B testing and multivariate testing hinges on your goals, website traffic, and the level of detail you’re aiming for in your results.
A/B testing focuses on testing one change at a time – like a headline, button color, or layout. It’s straightforward, requires a smaller sample size, and works well for sites with moderate traffic. If you’re looking for quick, actionable insights without diving into complex data, this is a great option.
Multivariate testing, however, looks at how multiple elements work together by testing different combinations simultaneously. For example, you might test various combinations of a headline, image, and call-to-action. While this method offers a deeper understanding of how elements interact, it demands significantly higher traffic to produce reliable results. If your site attracts thousands of daily visitors and you’re ready to handle more complex analysis, multivariate testing can help fine-tune intricate pages.
Here’s how to choose the right approach:
- Testing scope: Use A/B testing for single changes and multivariate testing for multiple changes at once.
- Traffic volume: If your site doesn’t have enough visitors to test every combination, stick with A/B testing.
- Resources: Multivariate testing often requires advanced tools and more time for analysis, so ensure your team is equipped for it.
By matching your testing method to your goals, audience size, and available resources, you’ll gain insights that can help refine your strategy and boost your results.
What essential features should I look for in an experimentation tool?
When selecting an experimentation tool, it’s important to zero in on features that make the process smoother, more precise, and user-friendly. Some of the top capabilities to keep an eye on include A/B and multivariate testing, options for personalization and segmentation, and compatibility with both server-side and client-side setups.
You’ll also want tools that provide real-time analytics with easy-to-understand statistical insights, feature-flag management for gradual rollouts, and native data integration to simplify your analysis. An intuitive visual editor can be a game-changer, speeding up the process of setting up experiments and making it more accessible. These features can help you run experiments that are efficient and deliver meaningful results.
How do experimentation tools help small businesses grow?
Experimentation tools give small businesses the power to make smart, data-backed decisions, cutting out the guesswork and replacing it with clear, actionable insights. With A/B testing, for instance, you can directly compare two versions of a webpage, ad, pricing model, or product feature to determine which one delivers better results. Whether you’re aiming to boost conversions, increase average order value, or improve sign-up rates, this method ensures your budget is spent on strategies that actually deliver results – no need for a large analytics team.
These tools also take the hassle out of testing by automating key tasks like setting up experiments, segmenting audiences, collecting data, and analyzing results. This means you can get answers faster and refine elements like a landing page headline or the checkout process in no time. Once you’ve identified the winning version, you can roll it out to all your customers, saving time and money while driving growth and improving customer satisfaction.
Growth-onomics offers the guidance and tools you need to get started, with strategies tailored specifically for U.S. customers. Whether it’s finding the sweet spot at a $49.99 price point, crafting the perfect call-to-action, or optimizing for mobile users, these insights can help you turn small tweaks into meaningful, long-term growth.