

Want to improve your ad performance? Start by analyzing your competitors’ display ads. Here’s why:
- 5% of new ads outperform existing ones. Studying competitors’ long-running ads (active for 30+ days) can reveal strategies that work.
- Structured weekly analysis boosts ROAS by 2.3x. Regularly tracking competitors helps you uncover trends, gaps, and new opportunities.
- Tools like Google Ads Transparency Center and Meta Ad Library make it easy to monitor active ads, platforms, and targeting strategies.
Moat Ad Spy Alternative – Best Ad Spy Tools 2026
How to Find and Monitor Competitor Display Ads
Tracking down competitor ads used to be a real challenge. But now, a variety of free tools make it easier than ever to see exactly what your competitors are running. For instance, the Google Ads Transparency Center – introduced on March 29, 2023 – offers a look at search, display, and YouTube ads from verified advertisers. Similarly, the Meta Ad Library provides access to all ads running across Facebook, Instagram, Messenger, and the Audience Network, with archives stretching back to May 2018. If TikTok is your focus, the TikTok Creative Center showcases top-performing ads, complete with filters for industry, region, and campaign objectives, and even includes engagement metrics.
These tools allow you to dive deep into competitor strategies. You can analyze the creatives they’re testing, evaluate how long ads stay active (a potential sign of performance), and even uncover targeting strategies by examining landing page URL parameters.
How to Use Ad Libraries
Start with the Google Ads Transparency Center. According to Silvio Perez, Founder of AdConversion, the best way to search is by using your competitor’s website URL (e.g., "gap.com") rather than their company name. This method avoids confusion with parent companies or agencies and ensures more accurate results. You can refine your search by format, geography, and date to identify trends like seasonal campaigns.
The Meta Ad Library offers a slightly different experience. It groups similar ads together, making it easier to spot A/B testing variations. You can filter ads by media type (image, video, carousel), language, and platform (e.g., Facebook or Instagram). With its extensive archive dating back to 2018, you can even trace how your competitor’s messaging has evolved over time.
For live ads, the My Ad Center feature is invaluable. By clicking the three dots on an ad, you can uncover why it’s being shown to you – whether it’s based on your age, location, search history, or similarities to the advertiser’s target audience.
| Platform | Coverage | Key Feature | History |
|---|---|---|---|
| Google Ads Transparency Center | Search, YouTube, Display | Search by URL for precise results | Last 30 days (active ads) |
| Meta Ad Library | Facebook, Instagram, Messenger | Groups similar ad variations | Since May 2018 |
| TikTok Creative Center | TikTok | Includes engagement metrics | Top-performing ads only |
Once you’ve explored these tools, set up a system to track and monitor these insights over time.
How to Track Competitors Over Time
A one-time look at competitor ads is helpful, but consistent monitoring is where the real value lies. Create a simple spreadsheet with columns like "Competitor Name", "Month/Year", "Channel", and "Ad Count." Updating this quarterly can reveal patterns, such as shifts in ad spend or changes in platform preferences.
"Using [ad libraries] on a quarterly basis to spy on your competitors is a key habit to develop."
- Lee Gannon, AdConversion
For better organization, create a shared swipe folder (e.g., on Google Drive) to save competitor creatives, landing pages, and offers. Screenshot ads that catch your eye and jot down what stands out – whether it’s the headline, visuals, or call-to-action.
Tracking ad longevity and placement over time can help confirm which ads are working well. Ads that run for three months or more are often a strong indicator of success. As Commit Agency puts it, "If a campaign has been running for months, it’s a good sign it’s performing". Long-running ads usually mean they’re delivering results.
Lastly, don’t just track the ads themselves – pay attention to where they’re being run. Tools like ISearchFrom allow you to simulate searches from different geographic locations, helping you uncover which regions your competitors are prioritizing. This can highlight underserved markets or reveal areas where competition is heating up.
Tools for Analyzing Competitor Display Ads
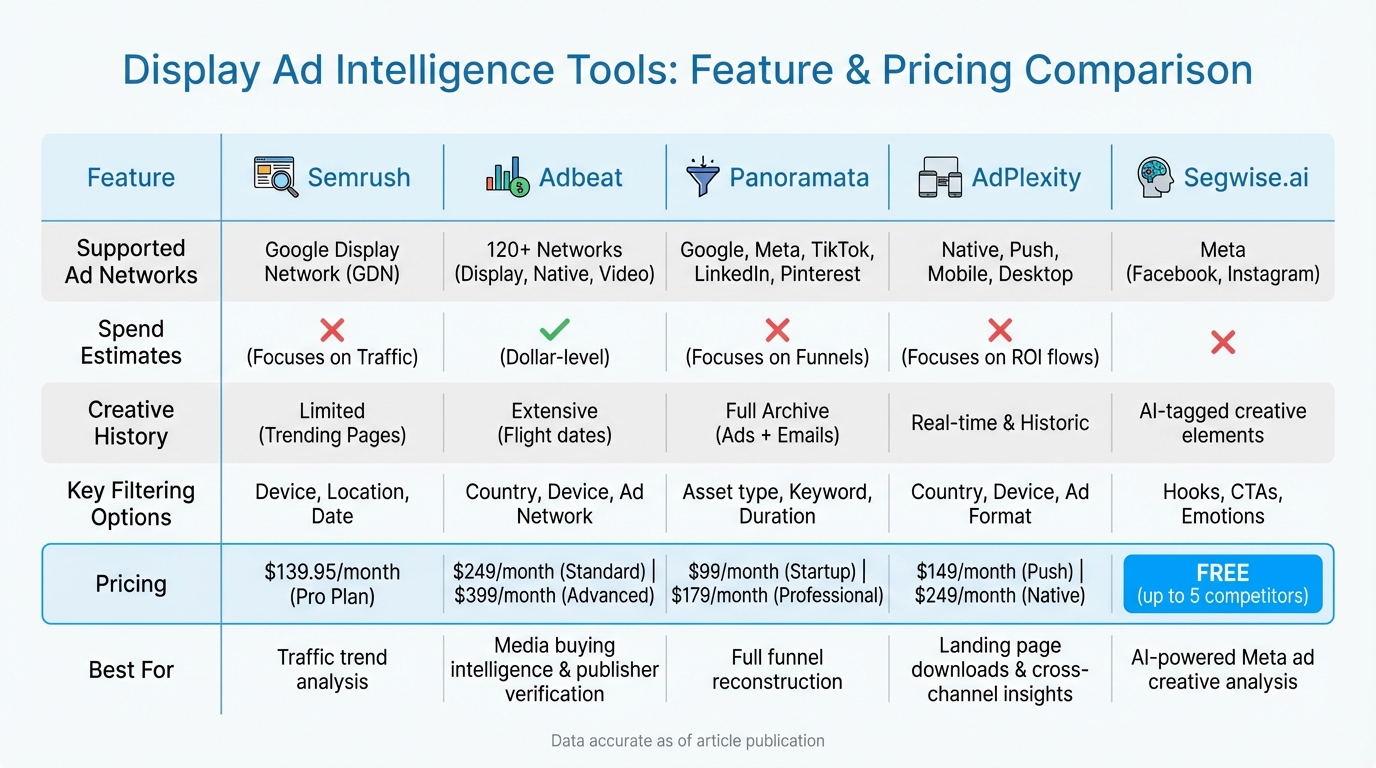
Display Ad Intelligence Tools Comparison: Features and Pricing
When it comes to tracking and analyzing competitor ads, specialized tools can offer a wealth of insights to help refine your strategies. These platforms go beyond basic tracking, providing details like ad spend estimates, creative performance metrics, and precise ad placements.
Best Tools for Display Ad Intelligence
Semrush‘s Display Ads Dashboard focuses on traffic trends, breaking down performance across desktop and mobile devices. It highlights "Trending Pages", which receive the most display ad traffic, making it a great choice for identifying high-traffic landing pages.
Adbeat delivers in-depth media buying intelligence, including spend estimates and publisher-level data. With information from over 2 million advertisers and publishers across 20+ countries, Adbeat covers 120+ ad networks, including native and pre-roll video. The platform uses over 40 data centers to gather this data, offering a comprehensive view of the advertising landscape.
Panoramata offers an all-in-one solution for tracking entire marketing funnels. It archives over 100 million creatives from 80,000+ companies, covering not just display ads but also emails, landing pages, and SMS. This makes it possible to reconstruct complete competitor funnels, giving you insights into the entire conversion path. Users have reported saving significant time by automating competitor tracking with Panoramata.
Segwise.ai provides a free AI-powered tracker for Meta ads. It tags creative elements like hooks, calls-to-action (CTAs), and emotional triggers, helping you analyze what works. As Angad Singh from Segwise.ai puts it:
"Guessing which competitor creatives work wastes time and ad dollars".
The tool is designed to save over 10 hours of manual research each week while offering enterprise-level insights at no cost for up to five competitors.
AdPlexity specializes in cross-channel ad intelligence, covering native, push, mobile, and desktop ads. It lets users download and rebuild high-performing landing pages, providing insights into post-click experiences. Meanwhile, Pathmatics offers cross-channel spend and impression estimates, connecting specific creatives to the publishers where they appeared.
Tool Feature Comparison
Each of these tools brings unique strengths to the table, allowing you to tailor your choice based on your specific needs.
| Tool | Supported Ad Networks | Spend Estimates | Creative History | Filtering Options | Pricing |
|---|---|---|---|---|---|
| Semrush | Google Display Network (GDN) | No (Focuses on Traffic) | Limited (Trending Pages) | Device, Location, Date | Pro Plan at $139.95/month |
| Adbeat | 120+ Networks (Display, Native, Video) | Yes (Dollar-level) | Extensive (Flight dates) | Country, Device, Ad Network | Standard $249/month; Advanced $399/month |
| Panoramata | Google, Meta, TikTok, LinkedIn, Pinterest | No (Focuses on Funnels) | Full Archive (Ads + Emails) | Asset type, Keyword, Duration | Startup $99/month; Professional $179/month |
| AdPlexity | Native, Push, Mobile, Desktop | No (Focuses on ROI flows) | Real-time & Historic | Country, Device, Ad Format | Modular by ad type (Push $149/month, Native $249/month) |
| Segwise.ai | Meta (Facebook, Instagram) | No | AI-tagged creative elements | Hooks, CTAs, Emotions | Free for up to 5 competitors |
If you’re unsure where to start, think about your goals. Want to verify publishers before diving into a new ad network? Adbeat can show you where competitors are finding profitable traffic. Need to reconstruct full funnels? Panoramata allows you to see landing pages and follow-up emails, giving you a complete picture of the conversion process. For identifying high-performing ads, look for campaigns active for over 15 days in Panoramata – these are often backed by substantial budgets.
Finally, consider using Semrush’s Traffic Trend graphs to spot competitor traffic surges and time your campaigns effectively.
sbb-itb-2ec70df
How to Analyze Display Ad Performance and Creatives
Once you’ve gathered competitor data, the next step is to break it down and uncover what makes their ads successful. Since most performance metrics are hidden from view, you’ll need to rely on visible clues and a closer look at their creative elements.
How to Evaluate Ad Creatives
One of the most telling signs of an ad’s success is how long it’s been running. Brian Bowman, CEO of Consumer Acquisition, points out:
"It’s fairly safe to assume that if your competitors are smart and an ad has been running for more than a couple of days, it’s doing well."
Considering that only about 5% of new ads surpass the performance of a control ad, spotting an ad that’s been active for 30 to 90 days – or even longer – usually indicates it’s a proven performer backed by a solid budget.
Next, look at the structure of the ad itself. Ads with a clean visual hierarchy – featuring just 3–5 key elements – tend to perform 2.7 times better than cluttered designs. Focus on the main visual anchor, whether that’s a product image, a person’s face, or a bold offer, and rate the clarity of each ad on a scale of 1–5.
Calls-to-action (CTAs) also provide insight into the ad’s intent. Low-commitment CTAs like "Learn More" suggest the campaign is aimed at building awareness, while medium-commitment phrases like "Sign Up" or high-commitment ones like "Buy Now" are more aligned with direct response strategies.
Try summarizing the ad’s core message in 10 words or less. Teams that can clearly articulate a competitor’s value proposition are 4.2 times more likely to win deals than those that can’t. If the message feels convoluted, chances are the ad’s messaging is too complex.
For video ads, pay close attention to the opening moments. Break them down frame-by-frame to identify the type of hook being used – like a question, bold statement, or surprising stat – and note any emotional triggers, such as fear of missing out, curiosity, or aspiration. If your competitors lean heavily on frustration triggers while you’re focusing on aspiration, it might be worth testing their approach.
You can also trigger retargeting ads by visiting competitor websites. This will give you a glimpse into the specific offers and messaging they use to re-engage potential customers .
Once you’ve fine-tuned your understanding of the creative elements, it’s time to analyze where these ads show up.
How to Examine Ad Placements and Formats
Ad placement analysis can reveal where your competitors’ audiences are most active. Tools like the Google Ads Transparency Center can help you identify the websites, apps, or YouTube channels where their ads appear. This might also highlight untapped opportunities for your own campaigns.
Different ad formats work better for different goals. Static images are ideal for showcasing a single product, while carousels and long-form videos are better suited for comparisons or detailed explanations. For customer stories, short videos (30–60 seconds) are often the most effective way to connect emotionally.
Since 70–80% of social ad impressions happen on mobile devices, optimizing for mobile is critical. Look for vertical (4:5) or square (1:1) formats to ensure text remains readable and layouts stay clean on smaller screens. Ads that perform well on desktop but struggle on mobile could be leaving money on the table.
When you notice a competitor testing multiple variations of an ad around the same theme, it’s a clear signal they’ve hit on a winning concept and are refining it further.
Don’t overlook the landing page experience. By analyzing UTM parameters in competitor URLs, you can uncover valuable details like keyword targeting ("matchtype=e") or campaign strategies. Ensure the landing page aligns with the ad’s visuals and messaging – misaligned pages often lead to higher bounce rates and wasted ad spend.
Take Safely Finance as an example. By using data-driven insights and AI tools to optimize their Google Ads strategy, they achieved incredible results: a 651% increase in conversions, a threefold boost in key conversion points, and an 80% reduction in cost per offer. This shows how a systematic approach to analyzing creatives and placements can lead to real business growth.
Finally, prioritize which competitor tactics to test using the ICE Scoring Model. Rate each insight based on Impact (potential return), Confidence (how long the tactic has been in use), and Ease (how simple it is to implement) on a scale of 1–10. This keeps your focus on the strategies most likely to deliver strong results, setting the stage for smarter, data-driven campaigns.
How to Turn Insights Into Action
You’ve dug into competitor ads, spotted winning trends, and now it’s time to turn those insights into campaigns that deliver better results. Let’s break this down step by step to create actionable, data-driven strategies.
How to Create Data-Driven Campaigns
Start by organizing everything you’ve learned into a creative log. Think of it as your go-to library of ideas, categorized by competitor, specific ad elements (like background colors or CTAs), and performance metrics. This saves you from starting from scratch every time. Why is this so important? Because only 5% of new ads outperform an existing control. Borrowing from proven concepts can give you a serious advantage.
To figure out what to test first, try the ICE Scoring Model. Score each potential change from 1 to 10 based on Impact (potential return), Confidence (how successfully competitors have used it), and Ease (how simple it is to implement). Add up the scores, and the highest ones should be your top priorities.
Next, map out a 4-week testing calendar. Here’s a simple structure:
- Week 1: Test quick changes like headlines or CTAs.
- Week 2: Update static creative elements.
- Week 3: Analyze the results.
- Week 4: Launch high-impact tests that require more investment.
As you roll out these tests, track your performance carefully. Use Auction Insights in Google Ads to monitor whether your changes are making an impact. One key metric to watch is "Position Above Rate", which shows how often your ad ranks higher than a competitor’s. If this number improves after your updates, you’re gaining visibility. Also, keep an eye on "Impression Share" to see if your budget and bidding adjustments are helping you compete more effectively.
Here’s a real-world example: In 2024, Safely Finance revamped its Google Ads strategy using competitor insights. The result? A 651% increase in conversions, a 3x boost in key conversion points, and an 80% cut in cost per offer. It’s proof that systematically applying competitor insights can drive measurable growth.
Now, let’s take it a step further and explore how to uncover opportunities your competitors might be missing.
How to Gain a Competitive Edge
Adapting proven tactics is great, but the real game-changer is spotting gaps your competitors have overlooked. MonsterInsights sums it up well:
"PPC competitor analysis isn’t about copying your competition. It’s about finding the gaps they’ve missed and the opportunities they’ve overlooked." – MonsterInsights
Start by categorizing your competitors’ keyword lists based on intent: Informational (research stage), Commercial (comparison stage), and Transactional (ready-to-buy stage). Pay close attention to high-volume keywords in the Commercial and Transactional categories that aren’t being targeted aggressively. These are golden opportunities to capture demand your competitors are ignoring.
Timing can also give you an edge. Search for your target keywords at different times of day and from various locations. You’ll often find moments when competitors have exhausted their daily budgets or pulled back their bids. Running ads during these windows can get you premium placements for less money. Also, keep an eye on seasonal trends – launch your campaigns to either ride the wave of increased interest or stand out when competitors are less active.
For fresh ideas, look outside your industry. Follow successful advertisers in completely different fields. A clever hook from a fitness brand, for instance, could inspire a standout campaign for your SaaS product with just a few tweaks.
Don’t stop at the ads – audit the entire user journey. Click on competitor ads and study their landing pages. Pay attention to details like form lengths, trust signals (testimonials, security badges, guarantees), and how well the page messaging aligns with the ad copy. If you notice any disconnects, that’s your chance to outshine them by ensuring your campaigns maintain a seamless message-match from ad to conversion.
Finally, address buyer fears that others might be ignoring. Most competitors focus on benefits but skip over the concerns that hold buyers back – things like implementation challenges, switching costs, or long-term commitments. Tackle these head-on in your landing pages, and you could see conversion rates jump by 80%.
The key to staying ahead? Make competitor analysis a regular habit, not a one-and-done task. Set aside time each week to review competitor activity, score new opportunities using the ICE framework, and launch at least one new test. This consistent rhythm transforms competitor research into a powerful engine for growth.
Conclusion: Using Competitor Display Ad Analysis for Growth
Competitor display ad analysis isn’t just a one-time task – it’s an ongoing process that can significantly boost your Return on Ad Spend (ROAS). As Brian Bowman, CEO of Consumer Acquisition, explains:
"Competitive analysis is the single most important step to generate better creative for your user acquisition ads".
And the results speak for themselves. Teams that commit to structured, weekly competitor analyses see 2.3x higher ROAS compared to those who only check in sporadically.
To get started, use the 3-Ring Model to identify direct competitors, budget competitors, and attention competitors. Leverage free ad libraries and premium intelligence tools to monitor their campaigns, especially ads that have been running for 30–90+ days. These longer-running ads often reveal what’s resonating with audiences. Break down their success by analyzing key elements like visual design, emotional appeal, value propositions, and landing page flow.
Take these findings and document them in a creative log. Use the ICE Scoring Model to prioritize your tests and map them out on a structured 4-week calendar. By reverse-engineering what works for others, you can adapt those strategies to fit your brand’s unique voice. Essentially, you’re learning from your competitors’ costly experiments, which can save time and resources while improving your results.
But don’t stop at replication. The real edge comes from spotting what others may have missed – whether it’s untapped audience segments, overlooked messaging opportunities, or friction points in the user journey. For instance, while businesses generally see a $2 return for every $1 spent on PPC, achieving this level of ROI requires a thoughtful, informed approach rooted in competitor insights.
Set aside time every week to review competitor activity, evaluate new opportunities, and test at least one new idea. This regular cadence transforms competitor analysis into a powerful system for driving sustained growth and keeping your campaigns ahead of the competition.
At Growth-onomics (https://growth-onomics.com), we specialize in turning competitor insights into actionable strategies that fuel growth-focused campaigns. With the right tools and a disciplined approach, you can transform competitor research into a key driver of success.
FAQs
What’s the best way to track competitor display ads over time?
To keep an eye on competitor display ads, rely on automated ad-tracking tools. These tools make it easier to monitor their ad creatives, placements, and even their ad budgets. You can gather valuable insights into their campaigns, including ad copy, visuals, and targeting tactics.
Dedicate 30 minutes every week to reviewing any changes, logging updates, and analyzing patterns. This consistent effort can reveal trends, highlight opportunities, and help you fine-tune your own strategies to maintain an edge in the competitive market.
What are the best tools for analyzing competitor display ads?
To effectively analyze competitor display ads, a few tools stand out for their simplicity and the depth of information they provide. SpyFu and SEMrush are great options for spotting live ads, tracking creative elements, and identifying keyword and budget trends. These tools are perfect for quick comparisons and ongoing ad performance monitoring. Meanwhile, Adbeat dives deeper, offering insights into publishers and traffic sources, which can help you pinpoint successful placements and refine media buying strategies.
For those interested in historical data, iSpionage and WhatRunsWhere are invaluable. They archive variations of creative assets and provide spending estimates, giving you a clearer picture of past campaigns. On the other hand, Moat specializes in visual analytics and brand safety metrics, making it a go-to for assessing how ads align with branding goals.
If you’re looking for free options, Google Auction Insights and Meta’s Ad Library are excellent tools to gather baseline data. They provide insights into auction performance and ad disclosures, adding an extra layer to your understanding of competitor strategies. Together, these tools form a well-rounded toolkit for analyzing and refining your approach to display advertising.
How can I use competitor insights to improve my display ad strategies?
To turn competitor insights into actionable display ad strategies, begin by pinpointing 2–3 major competitors in your industry. Leverage tools like keyword research platforms or ad intelligence software to dig into their ad copy, targeted keywords, landing pages, budget allocations, and scheduling tactics. This analysis can reveal gaps in your own campaigns, such as overlooked keywords or untapped targeting options.
With these insights in hand, tweak your strategy by refining your targeting, enhancing your ad creatives, and reallocating your budget toward areas that show strong potential. Taking a data-driven approach like this can sharpen your campaigns, improve performance, and boost your return on investment.