

Bounce rate is the percentage of visitors who leave your site without interacting further. A high bounce rate can hurt conversions, waste ad spend, and damage search rankings. Here’s what you need to know:
- What it is: The portion of visitors who leave without engaging (e.g., additional clicks, conversions, or extended time on site).
- Why it matters: High bounce rates signal poor user experience or mismatched content, leading to lost opportunities.
- Key causes: Slow load times, unresponsive design, irrelevant content, or technical issues.
- How to fix it: Improve site speed, align content with user intent, and ensure mobile-friendliness.
Quick Stats:
- Average bounce rate: ~44.04% (varies by industry)
- 53% of mobile users leave if a page takes over 3 seconds to load.
- Blogs often have higher bounce rates (65%-90%) due to quick intent satisfaction.
To reduce bounce rate:
- Speed up load times (aim for <2.5 seconds).
- Match content to user expectations (e.g., search intent or ad copy).
- Optimize navigation and mobile usability.
- Use tools like Google Analytics 4 to track and improve performance.
Improving bounce rate isn’t just about keeping users on your site – it’s about turning visits into meaningful actions.
How to Reduce Bounce Rate 6 Simple Proven Methods
What Is Bounce Rate?
Bounce Rate Benchmarks by Industry 2025-2026
Bounce Rate Definition
Bounce rate refers to the percentage of visitors who arrive on your site and leave without interacting further. In the past, it was simply defined as single-page sessions. However, the definition has evolved.
In Google Analytics 4 (GA4), bounce rate is now calculated as the percentage of sessions that fail to meet specific engagement criteria. A session is considered "engaged" if it meets at least one of these conditions: it lasts more than 10 seconds, triggers a conversion or key event, or includes two or more pageviews or screenviews. Sessions that don’t meet any of these criteria are classified as bounces.
Put simply, bounce rate is the opposite of engagement rate. For example, if your engagement rate is 60%, your bounce rate will be 40%. Neil Patel, Co-Founder of NP Digital, sums it up well:
If you can make your site as engaging as possible, your bounce rate will take care of itself.
It’s important to note that bounce rate is different from exit rate. Bounce rate applies only to the first page a visitor lands on – if they leave without exploring further, it’s a bounce. Exit rate, on the other hand, tracks how often people leave from a specific page, regardless of whether they viewed other pages before.
How to Measure Bounce Rate
GA4 automatically calculates bounce rate using this formula: (Unengaged Sessions / Total Sessions) × 100. This differs from the older Universal Analytics, which used a simpler formula based on single-page sessions: (Single-Page Sessions / Total Sessions) × 100.
This change is significant because, under GA4, a visitor who spends 30 seconds reading your page without clicking anything wouldn’t count as a bounce. In contrast, under the old system, time spent on the page wasn’t factored in.
To check your bounce rate in GA4, navigate to the engagement metrics section in your reports. GA4 tracks this data automatically across all pages and traffic sources. You can also segment your data by device type, traffic channel, or landing page to pinpoint where bounces are most frequent.
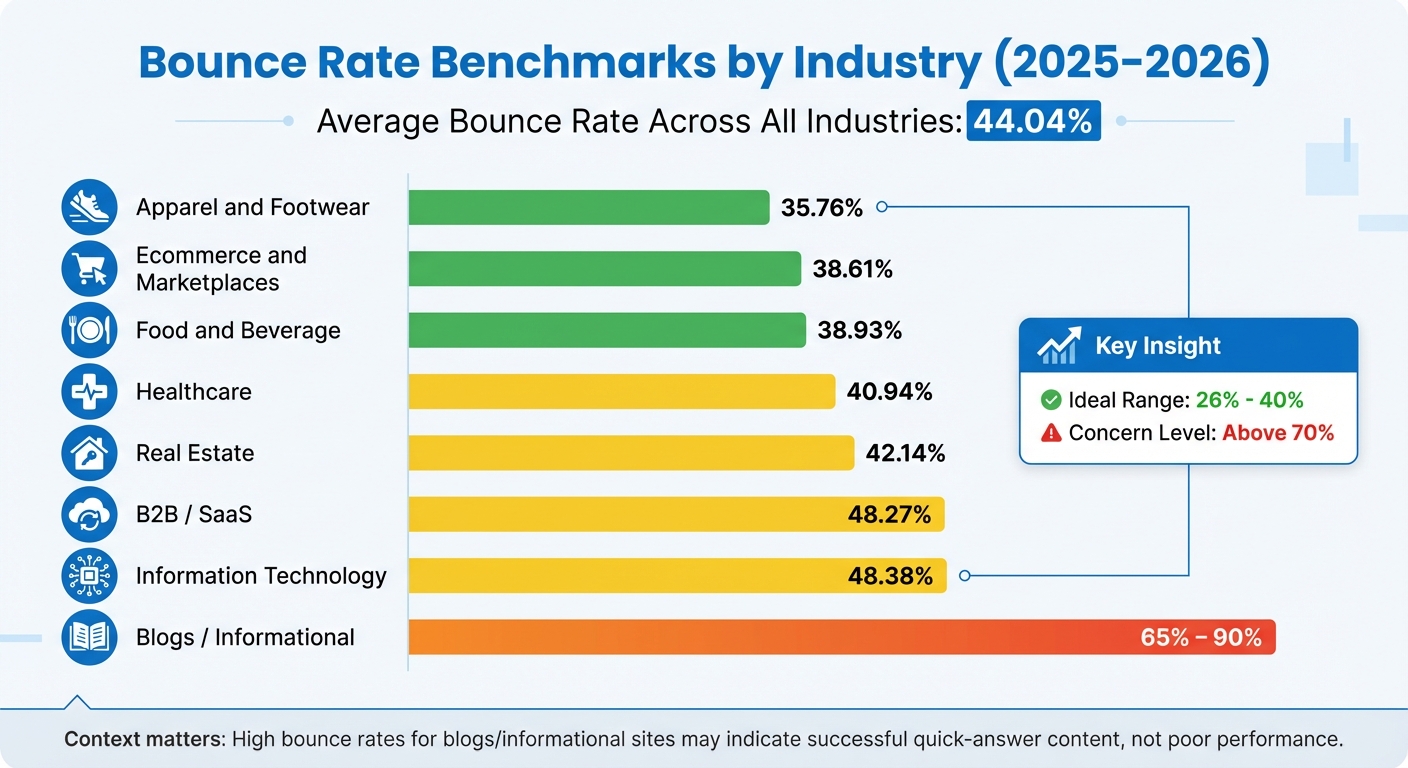
Bounce Rate Benchmarks by Industry
The average bounce rate across industries is 44.04%, but this figure varies widely depending on the type of business and its goals. Here’s a breakdown by industry:
| Industry | Median Bounce Rate |
|---|---|
| Apparel and Footwear | 35.76% |
| Ecommerce and Marketplaces | 38.61% |
| Food and Beverage | 38.93% |
| Healthcare | 40.94% |
| Real Estate | 42.14% |
| B2B / SaaS | 48.27% |
| Information Technology | 48.38% |
| Blogs / Informational | 65% – 90% |
Source: 2025/2026 industry data
Notice that blogs and informational sites often have much higher bounce rates. That’s not necessarily a bad thing. As Dmytro Sokhach, Co-Founder & CEO of Editorial.Link, explains:
Some pages exist to satisfy intent quickly. When they succeed, users leave fast. Not because they’re disengaged, but because they got exactly what they came for.
For most websites, a bounce rate above 70% may indicate problems, while an ideal range is typically between 26% and 40%. However, context is crucial. A high bounce rate might be acceptable for a blog providing quick answers, but for ecommerce sites that rely on users exploring multiple products, it could signal a major issue.
These benchmarks provide a useful starting point for identifying the reasons behind high bounce rates, which will be explored further in the next sections.
How to Identify High Bounce Rate Causes
Figuring out why visitors leave your site is the first step to tackling high bounce rates. These rates often arise from technical glitches, mismatched expectations, or a less-than-ideal user experience. To address the issue, you’ll need to dive into your data systematically, break down your traffic, and assess your site’s performance. Let’s look at how to pinpoint the root cause.
Analyze Traffic Segments
Not all traffic behaves the same. By segmenting your traffic based on source, device type, browser, and geography, you can uncover patterns and anomalies. For instance, if your paid search traffic has a much higher bounce rate than organic search, it could mean your ad messaging isn’t aligning well with your landing page content.
Since mobile devices now account for over 63% of web traffic, a high mobile bounce rate compared to desktop might suggest responsiveness issues. Also, certain browsers or operating systems could reveal unique problems – like a broken element that only appears in specific environments.
Take a closer look at your landing pages with the highest bounce rates and focus on optimizing those first. Geographic data can also provide valuable insights. For example, if visitors from a specific region are bouncing more, it might be due to slow server response times or localization issues.
Google Analytics 4 (GA4) doesn’t show bounce rate by default, so you’ll need to customize your "Pages and screens" or "Traffic acquisition" reports to include this metric. You can also create custom segments – such as comparing logged-in users to guest users or free subscribers to premium ones – to identify differences in behavior.
"A high bounce rate can indicate your website has a problem. But to learn what the problem is, you’ll need more information".
Once you’ve identified the troublesome segments, the next step is to assess your site’s technical performance to uncover any speed or usability issues.
Run a Website Performance Audit
Technical hiccups can drive visitors away, even if your content is on point. Running a performance audit helps you spot speed issues, broken elements, and mobile-specific problems. Tools like Google PageSpeed Insights can highlight common culprits like uncompressed images, render-blocking JavaScript, or missing browser caching.
Here’s a key stat: 53% of mobile users will leave if a page takes longer than three seconds to load. Even small tweaks can make a big difference – improving mobile site speed by just 0.1 seconds can lower bounce rates on informational pages by 8.3%.
Check for broken links, 404 errors, or faulty scripts that might frustrate users right away. Pay attention to Core Web Vitals, including metrics like Largest Contentful Paint and Cumulative Layout Shift, to ensure a smooth experience. On mobile, watch out for overlapping content, buttons that are too small to tap, or navigation menus that don’t work properly.
Also, be aware of tracking errors, such as duplicate tracking codes, which can give you false bounce rate data. Manually test your high-traffic pages on both desktop and mobile to catch any visual or interactive issues. These insights are essential for improving your site’s performance and boosting engagement.
Check for User Intent Mismatch
Even if your page functions perfectly, it can still have a high bounce rate if it doesn’t meet visitor expectations. User intent – the reason behind a search query – typically falls into four categories: Informational, Navigational, Commercial, and Transactional.
If your content doesn’t align with what users are looking for, they’ll leave quickly. For example, someone searching for "symptoms of gum disease" (informational intent) won’t stick around if they land on a page about "financing for periodontal treatments" (transactional intent).
"High bounce rates will torpedo keyword rankings faster than any other quality issue. When Google and other search engines observe high bounce rates, they infer the content does not adequately match and satisfy user intent".
To address this, analyze the top-ranking pages for your target keywords to see what format or content Google favors – whether it’s a numbered guide, a comparison chart, or a video tutorial. If paid traffic has a higher bounce rate than organic, it might mean your ads are setting expectations that your landing page fails to meet. Aligning your content with user intent is critical for improving engagement and keeping visitors on your site.
Proven Methods to Reduce Bounce Rate
Once you’ve pinpointed the reasons behind high bounce rates, it’s time to take action. Here are some targeted strategies to keep visitors engaged and avoid losing potential conversions.
Speed Up Page Load Times
When it comes to your website, speed is everything. In fact, ecommerce sites perform 2.5 times better with a one-second load time compared to four seconds.
To achieve faster load times, start by compressing images and videos without compromising quality. Implement lazy-loading so media only loads as users scroll. Use browser caching to store static files locally for returning visitors, and consider a Content Delivery Network (CDN) to deliver content from servers closer to your audience. Minify CSS, JavaScript, and HTML to reduce file sizes, and load non-critical JavaScript asynchronously to avoid delays.
For better backend performance, reduce Time to First Byte (TTFB). This can be done by upgrading to VPS or dedicated servers, optimizing database queries, and using the latest PHP versions. For example, SiteGround’s ultrafast PHP setup can improve page load speeds by about 30%. Switching to HTTP/2 or HTTP/3 also allows multiple files to transfer at once, speeding things up even more.
Tools like Google PageSpeed Insights and Semrush Site Audit can help you identify bottlenecks and monitor Core Web Vitals, such as Largest Contentful Paint (LCP). Aim to keep your LCP under 2.5 seconds so users see your main content quickly. Here’s a quick reference for key metrics:
| Metric | Good (Fast) | Poor (Slow) |
|---|---|---|
| Largest Contentful Paint (LCP) | ≤ 2.5 seconds | > 4.0 seconds |
| First Input Delay (FID) | ≤ 100 ms | > 300 ms |
| Cumulative Layout Shift (CLS) | ≤ 0.1 | > 0.25 |
| Time to First Byte (TTFB) | < 200 ms | > 600 ms |
Beyond speed, ensuring your site works smoothly across all devices is equally important.
Make Your Site Mobile-Friendly
With mobile devices accounting for over 63% of web traffic, a poor mobile experience can send users packing. Responsive design is key – your site should adapt seamlessly to various screen sizes. Simplify forms with autofill options, and make buttons large enough for easy tapping to avoid frustration.
Match Ad Copy to Landing Pages
Nothing drives users away faster than a bait-and-switch. If your ad promises “Free SEO Tools,” but the landing page pushes a paid product, visitors are likely to leave. Users clicking on specific ads expect to find exactly what was offered.
Regularly review your ad copy, title tags, and meta descriptions to ensure they align with the page content. Place the most valuable information – like answers to users’ primary questions – above the fold so it’s immediately visible. Use analytics to segment traffic sources and identify any mismatched messaging. Keep in mind that email and referral traffic often have lower bounce rates because these visitors are already familiar with your brand.
Consistency builds trust, but clear navigation keeps users exploring further.
Improve Site Navigation
Confusing navigation can frustrate users and lead to quick exits. Keep your main menu simple – stick to five to seven options to avoid overwhelming visitors. Group related pages under clear categories, and make sure important pages are accessible within three clicks.
Use descriptive anchor text for internal links so users know exactly where they’re headed, instead of vague phrases like “click here”. Add a search bar so users can quickly find what they need, and for longer pages, include a Table of Contents with jump links to improve scannability, especially on mobile.
Place internal links near the top of your pages to encourage exploration. Setting these links to open in new tabs can help keep the original page active. Including “Related Content” sections at the end of articles provides a natural way for users to continue browsing. For example, Wikipedia’s extensive internal linking keeps users engaged, with an average of 3.25 pages per session and a bounce rate of 53.42%.
Don’t forget to regularly check for broken links using crawlers – 404 errors can result in immediate bounces. On mobile, ensure your hamburger menu is clearly labeled for easy navigation.
Write Better Content
Even the fastest site with perfect navigation won’t retain visitors if the content doesn’t deliver. Make your content easy to read by using clear headings, short paragraphs, and bullet points where appropriate. Start with the most valuable information – answer the user’s primary question right away instead of burying it below the fold.
Use bold text to emphasize key points and break up long blocks of text. Include clear calls-to-action (CTAs) that guide users to their next step, whether it’s reading another article, signing up for a newsletter, or making a purchase. Match your CTA to the user’s intent, whether it’s informational, navigational, or transactional.
Avoid misleading headlines or “bait and switch” tactics. If your content doesn’t match what users expect based on how they arrived at your page, they’ll leave. Meeting user expectations is essential to keeping them engaged and encouraging further exploration.
sbb-itb-2ec70df
Advanced Optimization Techniques and Tools
Once you’ve nailed down the basics, it’s time to up your game with more advanced strategies. Techniques like A/B testing and using the right analytics tools can help you pinpoint what truly keeps visitors engaged.
Use A/B Testing to Optimize Pages
A/B testing takes the guesswork out of optimization by letting data guide your decisions. Start with your current page as the "champion" and create a "challenger" version, changing just one element – like the headline, call-to-action placement, or hero image. Split your traffic between the two versions and measure which one performs better in keeping visitors engaged.
By tweaking only one element at a time, you can confidently identify what helps reduce your bounce rate. If the challenger outperforms the champion, it becomes your new baseline for further testing. For reliable results, most tests require at least two weeks of data collection, though high-traffic sites may reach statistical significance sooner.
"The core function of A/B testing is to transform conversations from ‘we think this will work’ to ‘we know this works.’" – Adobe Communications Team
Focus your initial tests on above-the-fold content, especially if visitors are leaving within the first five seconds. Try experimenting with headline variations, adjusting call-to-action button colors for better visibility, or moving key information higher on the page.
Once you’ve fine-tuned the page, specialized tools can help you uncover and address deeper issues impacting your bounce rate.
Tools for Bounce Rate Analysis
After implementing foundational strategies, analytics tools can help you dig deeper into what’s driving bounces. Google Analytics 4 (GA4) is a must-have for understanding bounce rates. In GA4, an "engaged session" is defined as one where a visitor stays longer than 10 seconds, triggers a key event, or views multiple pages. Segmenting your data by traffic source or device type can reveal which channels or platforms are contributing to high bounce rates.
For speed-related issues, Google PageSpeed Insights is invaluable. Since 53% of mobile users abandon a page if it takes longer than three seconds to load, monitoring your Core Web Vitals is crucial.
If you’re looking for more visual insights, tools like Hotjar or Crazy Egg provide heatmaps and session replays. These can show you exactly where users lose interest or encounter friction on your site.
To tie bounce rate directly to your conversion goals, platforms like Growth-onomics Data Analytics (https://growth-onomics.com) offer detailed insights that connect performance metrics with user experience analysis. This helps clarify not just what’s happening but why visitors are leaving.
How to Track Optimization Results
Monitor Changes Over Time
When tracking your bounce rate, the key is to measure progress against your own historical data rather than relying solely on industry averages. Your baseline is what truly matters. For example, if your ecommerce site initially had a bounce rate of 55% and, after optimization, it dropped to 42%, that’s a clear improvement – even if the industry median for ecommerce is 38.61%.
To keep an eye on these trends, you can set up custom reports in GA4. Navigate to "Reports" > "Engagement" > "Pages and screens", click the pencil icon, and add "Bounce rate". This setup makes it easy to track changes week-over-week or month-over-month.
It’s also helpful to segment your data by traffic source. Different channels often behave differently. For instance, social and display traffic tends to have higher bounce rates, while email and referral traffic often perform better.
These insights can provide a clearer picture of how bounce rate improvements align with overall site performance and user engagement.
Connect Bounce Rate to Other CRO Metrics
Bounce rate is just one piece of the puzzle. To get a full view of your website’s performance, it’s important to connect bounce rate data with other key metrics. For instance, if your bounce rate drops from 60% to 45% but your conversions don’t increase, it may signal that while visitors are more engaged, they’re still not taking the desired actions.
Keep in mind that in GA4, bounce rate and engagement rate are inversely related. To dig deeper, set up key events like form submissions or video plays, and track scroll depth (e.g., triggering at 90%) to ensure these interactions count as engaged sessions.
Pairing bounce rate with metrics like average engagement time and pages per session can give you a more complete understanding of user behavior. For instance, a visitor who spends three minutes reading a detailed product guide shows a much higher level of intent than someone who bounces after a few seconds. As Neil Patel puts it:
If you can make your site as engaging as possible, your bounce rate will take care of itself.
Conclusion
After diving into the causes and solutions for high bounce rates, here’s a quick recap of the key points.
Reducing bounce rates isn’t just about numbers – it’s about turning brief visits into meaningful interactions. As Chris Kirksey, CEO of Direction.com, explains:
Lower bounce rates indicate visitors are engaging with content, clicking deeper into websites and finding relevant information.
To improve engagement, focus on three core areas: speeding up page load times, creating content that aligns with user intent, and embracing mobile-first design. These strategies not only enhance user experiences but also contribute to higher conversions.
Think of bounce rate as a tool to diagnose engagement issues, not just a metric to chase. Use GA4 to segment traffic and track how bounce rate improvements tie directly to conversion growth. And don’t forget – 53% of mobile users will leave a page if it takes more than three seconds to load.
For businesses ready to act on these insights, working with a performance marketing agency like Growth-onomics can provide the expertise needed to uncover problems, test solutions, and see measurable results. Start with the basics: audit your site speed, ensure mobile compatibility, and tailor content to match user needs. From there, explore advanced tactics like A/B testing and heatmap analysis to deepen user engagement and drive growth.
FAQs
What is bounce rate, and how does it affect SEO and conversions?
Bounce rate is the percentage of visitors who leave your website after viewing just one page. While it’s not a direct ranking factor for search engines, a high bounce rate can suggest that your page isn’t meeting user expectations. This can indirectly impact your SEO, as search engines may interpret it as a sign that your content doesn’t align with what users are looking for. To combat this, focus on creating pages that load quickly, align with user intent, and are easy to navigate. These factors can help keep visitors engaged, reducing bounce rates and improving your site’s overall visibility.
From a conversion standpoint, every bounce is a missed chance to guide a visitor toward taking an action – whether that’s completing a form, making a purchase, or signing up for a newsletter. By improving page relevance, speeding up load times, and enhancing the user experience, you can encourage visitors to stick around and interact with your content. This not only improves engagement but can also lead to higher conversion rates.
Growth-onomics offers expertise in reducing bounce rates and optimizing site performance. Their strategies help businesses improve both search engine rankings and conversion outcomes, creating a win-win for online success.
How can I create content that matches user intent and reduces bounce rates?
To create content that resonates with your audience and keeps them engaged, it’s essential to understand why they’re searching in the first place. Are they looking for information (e.g., "How does this work?"), trying to navigate to a specific page, or ready to take action, like making a purchase? These intents – informational, navigational, and transactional – are the backbone of search behavior. Tools like keyword research and behavior analytics can help you spot these trends.
Once you’ve nailed down the intent, tailor your content to match. For informational searches, start with a straightforward answer that gets to the point quickly, then expand with details, step-by-step guides, or bullet points for clarity. Don’t clutter the page with unnecessary details or pushy sales tactics when users are simply seeking answers. To keep them exploring, add internal links to related content that might catch their interest. And don’t forget to track metrics like engagement and bounce rates – these insights will help you fine-tune your content to better meet user needs.
How do I track and improve bounce rate using Google Analytics 4 (GA4)?
In Google Analytics 4 (GA4), tracking bounce rate is straightforward. You can add the Bounce Rate or Engagement Rate metric to the Pages & Screens report. Bounce rate measures sessions where users show minimal engagement – like those lasting under 10 seconds, involving no key interactions, or consisting of just a single page view.
To improve bounce rate, start by tweaking pages with higher rates. Consider actions like speeding up page load times, crafting compelling calls-to-action, or designing content that motivates users to explore more of your site. The team at Growth-onomics stresses the importance of a data-driven strategy to keep visitors engaged and foster meaningful interactions.