Most experiment mistakes come from bad measurement, not bad ideas. If I had to boil this topic down, I’d say this: pick one main metric, a few support metrics, and a small set of safety checks before the test starts.
Here’s the short version:
- I use a North Star Metric to link tests to business results
- I match metrics to the funnel stage: acquisition, activation, engagement, retention, monetization, or efficiency
- I choose one primary metric for each test
- I add secondary metrics to explain what happened later
- I set 2–4 guardrail metrics to catch tradeoffs
- I define win rules in advance, such as 95% confidence and a minimum lift
- I check data quality issues like sample ratio mismatch, missing events, and duplicate conversions
- I turn results into a simple dashboard with trend lines and $ impact
A good growth metric system answers three questions fast:
- Did the test move the number I care about?
- Did it hurt anything else?
- Is the result solid enough to act on?
For example, if a page test lifts conversion from 4.0% to 4.7% on 50,000 monthly visitors, that can mean 350 more customers and about $26,250/month in first-month revenue at $75 per customer. That’s the kind of math that turns test results into decisions.
What I like about this article is that it treats metrics as a system, not a pile of reports. The main point is simple: every experiment metric should connect to a KPI, and every KPI should connect to the one business number that matters most.
Create Better Experiment Metrics With Goal Trees
sbb-itb-2ec70df
Core Growth Experiment Metrics by Funnel Stage
Once you’ve set your metric hierarchy, the next move is simple: pick the metric family that fits the funnel stage you’re testing.
Good experiment metrics should point straight at the bottleneck you want to fix. When you group metrics by stage, measurement stays tight. You avoid drowning in numbers that look useful but don’t help you decide anything.
The table below links each metric category to sample metrics, the question it helps answer, and when it makes sense to use it:
| Metric Category | Example Metrics | Decision It Answers | When to Use It |
|---|---|---|---|
| Acquisition | New users, visitor-to-sign-up rate, CAC | Are we attracting the right people at a reasonable cost? | Traffic is low or acquisition costs are rising |
| Activation | Activation rate, time to first key action, time to value | Do new users reach a meaningful outcome quickly? | Sign-ups are healthy but users do not take next steps |
| Engagement | Daily active users (DAU), monthly active users (MAU), DAU/MAU ratio, feature usage, repeat visits | How often and how deeply do users interact? | Post-sign-up activity is weak |
| Retention | Cohort retention, churn rate, reactivation rate | Do users return across cohorts? | Early engagement looks fine but users drop off later |
| Monetization | Conversion rate, AOV, revenue per user, LTV | Does the experiment improve revenue quality and volume? | Traffic and usage are healthy but revenue is weak |
| Efficiency | LTV:CAC ratio, page load time, error rate, support tickets | Is growth hurting margins or experience? | Growth is hurting margins or experience |
The key is to match the metric category to the current bottleneck. If onboarding is stuck, look at activation. If revenue is soft, look at monetization. If growth starts hurting margins or the user experience, shift to efficiency.
Each stage metric should connect back to the KPI chain that rolls up to the North Star Metric.
Use this map to trim the metric set before you choose primary, secondary, and guardrail metrics.
Acquisition and Activation Metrics
Start at the top of the funnel when the problem is traffic volume or first-step conversion.
Acquisition metrics answer a basic question: are your experiments bringing in more of the right people? When traffic is thin or acquisition costs are climbing, track new users or visitors, visitor-to-sign-up rate, and cost per acquisition (CAC).
Activation rate shows how many new users complete a first meaningful action – the behavior most likely to signal future value. For e-commerce, that could mean a first purchase. For a B2B service business, it might be submitting a lead form or booking a consultation.
Time to value is an early activation metric worth watching closely. If sign-ups look fine but users aren’t getting to value fast, that’s your cue to move from acquisition metrics to activation metrics.
Engagement, Retention, and Churn Metrics
Go further down the funnel when a test affects repeat use or long-term behavior.
Daily active users (DAU), monthly active users (MAU), and the DAU/MAU ratio help you see whether users are building a habit or just dropping in once. That’s especially useful for products where repeat use matters.
Cohort retention shows whether users who saw a test keep coming back over days, weeks, or months. Churn rate shows how many leave. Reactivation rate shows how many return.
When staying power is the issue, these metrics matter more than traffic. A test that lifts sign-ups but also pushes churn up isn’t a win.
Monetization and Efficiency Metrics
Use revenue and guardrail metrics when a test affects pricing, checkout, or operating cost.
Conversion rate, average order value (AOV), revenue per user, and lifetime value (LTV) each show a different part of the revenue story. It helps to track conversion and order value together, because a lift in conversion rate can still lead to lower total revenue.
The LTV:CAC ratio, page load time, error rate, and support tickets work as guardrails. They help you spot cases where an experiment improves a revenue metric while making the user experience worse or creating technical problems.
How to Choose the Right Metrics for Each Experiment
Growth Experiment Metrics: Primary vs Secondary vs Guardrail
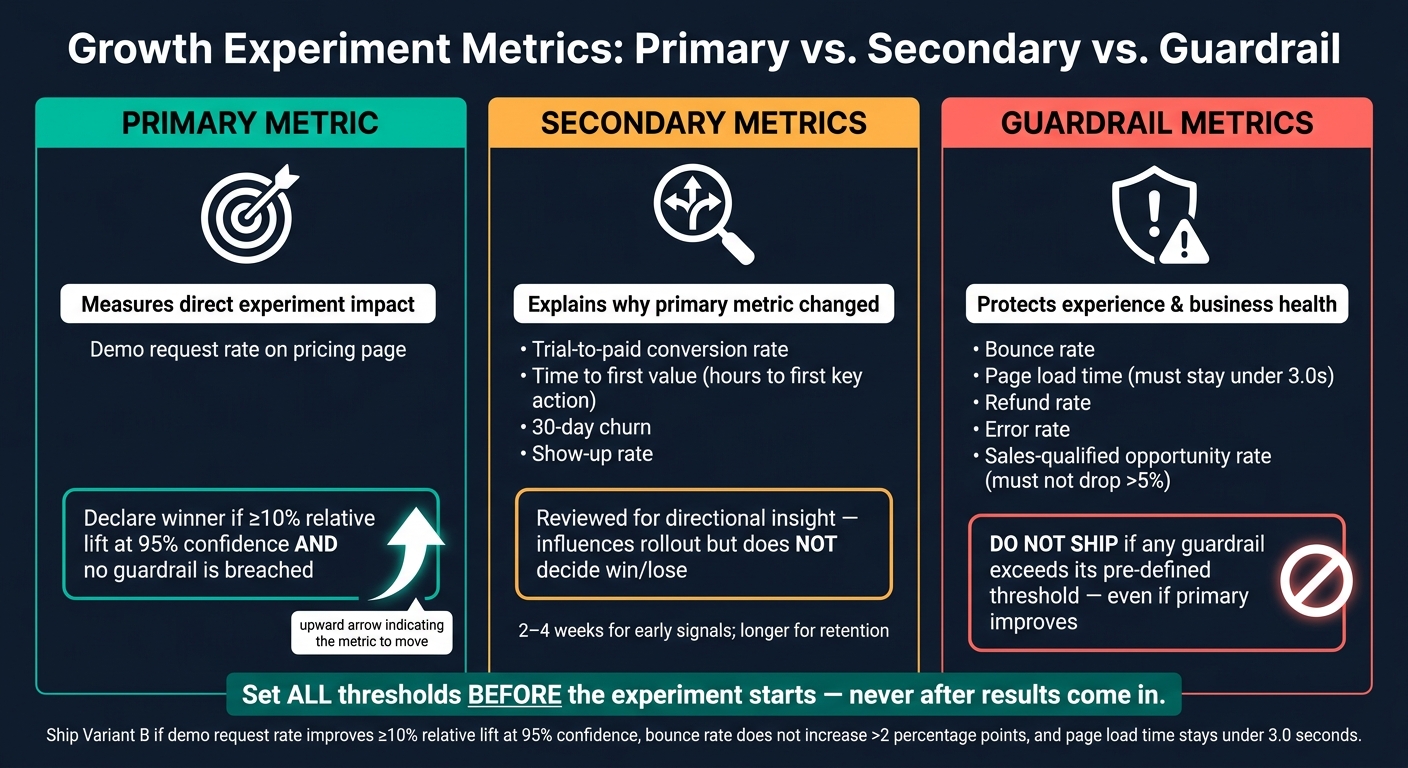
Once you’ve picked the right metric family, the next step is simple: choose one primary metric, a few secondary metrics, and 2–4 guardrail metrics. That’s it.
Every experiment should have exactly one primary metric, a small group of secondary metrics, and a few guardrails. Add too many metrics, and things get muddy fast. More data doesn’t always mean more clarity. Sometimes it just means more noise.
Map Goals to Primary and Secondary Metrics
Start with the business goal, then work backward from there. Your primary metric should be the conversion rate closest to the action you want the experiment to change. It should not be a downstream outcome like pipeline value or revenue, because those depend on things the experiment can’t fully control.
Secondary metrics help explain why the primary metric changed and whether that change led to real value later on. For example, if you’re testing ways to increase trial starts, make trial start rate the primary metric. Then pair it with secondary metrics like trial-to-paid conversion rate, time to first value, measured as hours to first key action, and 30-day churn.
A good rule of thumb: secondary metrics should track value that happens after the primary action. They should also be measured over a time window that makes sense. In many cases, that means:
- 2–4 weeks for early adoption signals
- Longer windows for retention
These metrics are there for directional insight. They help you read the full picture, but they should not decide the winner on their own.
Set Guardrail Metrics and Win Criteria
Primary and secondary metrics tell you whether a change worked. Guardrails tell you whether it caused damage somewhere else.
That’s their whole job. Guardrail metrics are safety checks, not success metrics. They help catch bad tradeoffs, like when a primary metric goes up but something else quietly gets worse.
Here’s a common example: adding urgency messaging to a pricing page might increase demo requests while lowering lead quality. A guardrail like "sales-qualified opportunity rate must not drop more than 5%" helps catch that problem before you ship something that looks good on the surface but hurts the business underneath.
The table below shows how these metric types differ and how each one affects the final call:
| Metric Type | Purpose | Example | Decision Rule |
|---|---|---|---|
| Primary | Measures the direct impact the experiment is designed to move | Demo request rate on pricing page | Declare a winner if ≥10% relative lift at 95% confidence and no guardrail is breached |
| Secondary | Captures downstream value and explains why the primary moved | Trial-to-paid conversion rate, show-up rate | Reviewed for directional insight; influences rollout decisions but does not decide win/lose |
| Guardrail | Protects customer experience and business health | Bounce rate, page load time, refund rate, error rate | Do not ship any variant where a guardrail exceeds its pre-defined threshold, even if the primary improves |
Set every threshold before the experiment starts. If you wait until results come in, it’s too easy to move the goalposts.
A clean win criterion looks like this:
"Ship Variant B if demo request rate improves by at least 10% relative lift at 95% confidence, bounce rate does not increase by more than 2 percentage points, and page load time stays under 3.0 seconds."
How to Measure Experiment Results Correctly
Once you’ve set win criteria, the next job is to make sure the result is both statistically sound and tracked the right way. This is what protects the primary, secondary, and guardrail metrics you defined earlier.
There are two main ways an experiment can fool you:
- The stats point to a result that’s just noise
- The data is broken, even if the numbers look good
Either one can create what looks like lift.
Significance, Confidence Intervals, and Sample Size
A lift percentage on its own doesn’t tell you much. What matters is whether the sample was large enough for you to trust the result at all.
Statistical significance tells you that the difference you saw is unlikely to come from chance variation alone. A 95% confidence level means you accept a 5% false-positive risk, which is common in growth experiments. P-values show the probability of seeing a result at least this extreme if no real effect exists. A low p-value, usually below 0.05, suggests the result may not be random. But that still doesn’t tell you whether the effect is big enough to matter to the business.
Confidence intervals add that missing context. They show the plausible range of the effect. If the interval crosses zero, the result is inconclusive.
Statistical power is the chance that your experiment will detect a real effect if one exists. The standard target is 80% power. [2][4][6] Power is tied directly to sample size. Small samples create wide confidence intervals and can miss real gains completely. Before launch, calculate sample size using the baseline conversion rate, minimum detectable effect, 95% confidence, and 80% power. [3][5][8]
One more trap: don’t stop a test early just because the numbers look good. If you keep checking results and end the test the moment p < 0.05, the false-positive rate can climb well past 5%. Simulations show rates around 26% to 40%. [9][10] Set a fixed end date before the experiment starts, then stick with it.
Stats alone aren’t enough if the tracking layer is broken.
Data Quality Checks That Protect Decisions
An experiment can be statistically clean and still lead you in the wrong direction if the tracking is off. Before you call any variant a winner, check the data first.
Sample ratio mismatch (SRM) should be your first check. If you planned a 50/50 split but one variant got far more or fewer users than expected, something likely broke in assignment or delivery. SRM is usually checked with a chi-squared test. If the split p-value is below 0.001, treat the experiment as invalid. [7]
When assignment or tracking fails, you can’t use the test to support a rollout decision. Common causes include JavaScript errors, caching, bot traffic, and assignment bugs. [7]
Four other issues can also warp results without making much noise:
- Missing events: If one variant doesn’t fire a conversion event consistently, it can look worse than it is.
- Delayed tracking: Events that show up hours or days late can skew short-window reporting.
- Duplicate conversions: Counting one conversion twice pushes the conversion rate up.
- Attribution errors: If outcomes get tied to the wrong variant or source, both groups can look different from what users actually saw.
If your dashboards, warehouse tables, and product logs don’t match, stop there. Treat the result as invalid until tracking is confirmed.
These checks feed the dashboards, reporting, and financial tie-back described next.
Building a Metrics System Across Your Growth Program
Once your data quality checks are in place, the next step is to turn measurement into a repeatable process. The point is simple: connect experiment results to business outcomes and keep the team on the same page over time.
Dashboards, Reporting, and Financial Tie-Back
After validation, turn each test into a dashboard people can actually use.
Keep the growth dashboard simple. Put the North Star metric, a small set of funnel metrics, and experiment results in one view. [15] Add at least 4–8 weeks of trend data for each metric so you can spot steady movement instead of getting distracted by one-week noise. [11][12][15]
For the experiment layer, use a table that shows the test name, date range, primary metric lift, confidence level, sample sizes, and estimated financial impact in USD, such as added monthly revenue, profit, or CAC savings. A lift from 4.0% to 4.7% on 50,000 monthly visitors means 350 more customers and $26,250 in monthly revenue at $75 in first-month revenue. Putting results in dollars makes prioritization much clearer than looking at percentage lifts alone. [14][15][17]
Use the dashboard on a fixed reporting cadence. A weekly growth standup should cover active experiments and short-term anomalies. A monthly experiment review should go deeper, with each closed test getting a full readout of the hypothesis, primary and guardrail metric results, statistical validity, and dollar impact. [14]
Each experiment also needs standard documentation before launch. At minimum, record:
- the hypothesis
- the primary metric
- guardrail metrics and their thresholds
- the target audience
- sample size assumptions
- expected business impact
- the decision rule
This gives you a record the team can come back to for future tests. [1][16][18]
Conclusion: The Metrics System That Supports Better Experiments
A metrics system works when every layer ties back to business value. Anchor your North Star metric to revenue, retention, or another outcome tied to long-term growth. Then map funnel and experiment metrics to that structure so no test sits off on its own. [11][12][13][17]
Once the reporting system is in place, the last step is using it to make faster rollout decisions. Set up every experiment around one primary metric and guardrail metrics with rollback thresholds defined before launch. Keep reporting consistent. Then use what each test teaches you to shape roadmap decisions instead of letting the results sit in a spreadsheet no one opens again.
The goal isn’t more experiments. It’s better decisions.
FAQs
How do I choose the right primary metric for a test?
Start by picking one business outcome that connects straight to your experiment’s hypothesis. Then choose a primary metric that tracks the exact user action you want to change, like conversion rate or click-through rate.
Keep it tight: two or three metrics total is usually enough. Add guardrail metrics to spot harmful side effects in nearby areas, such as bounce rate or average order value.
The key is alignment. Every metric should connect back to your company’s broader goals, not just the test in front of you.
What guardrail metrics should I track?
Guardrail metrics help you make sure a growth test doesn’t damage the business or the user experience while you’re chasing a main KPI. They track side effects that can show up alongside your core success metric.
Say you’re testing a new checkout flow to improve conversion rates. You’d also want to watch metrics like bounce rate, cart abandonment rate, and customer satisfaction. That way, if conversions go up but the checkout experience gets worse, you’ll spot it before it turns into a bigger problem.
How much traffic do I need to trust test results?
You can trust test results when three things line up:
- The sample size is large enough to be statistically valid
- The test runs long enough to reflect normal user behavior
- The results hit 95% statistical significance with a p-value of 0.05 or less
How much traffic do you need? It depends on your baseline conversion rate and the lift you expect to see.
Here’s a simple example: if your baseline conversion rate is 5% and you’re aiming for a 20% relative improvement, you’ll need about 7,600 visitors per variation.
If the expected lift is smaller, the sample size needs to be larger. And if you want to check that your traffic split is sound, a chi-squared test can help confirm it.