

Tracking push notification engagement is about more than just knowing how many messages you send. It’s about understanding user behavior – tracking metrics like opens, clicks, conversions, and revenue. Here’s why this matters:
- Personalized messages drive 202% more conversions than generic ones, often outperforming standard lead generation services.
- 70% of online shopping carts are abandoned, but win-back campaigns recover up to 26% of customers.
- Real-time tracking helps you adjust campaigns to improve performance instantly.
Key metrics include delivery rate, open rate, conversion rate, click-through rate (CTR), and opt-out rate. These metrics help identify what’s working and allow for quick fixes to avoid app uninstalls or user frustration.
To start tracking engagement:
- Choose a platform with real-time event tracking.
- Integrate SDKs to log actions like opens and clicks.
- Set up dashboards to monitor performance in real time.
Businesses using these strategies have seen increases in revenue, engagement, and retention. Tracking push notifications effectively can turn them into a powerful tool for growth.
How to Track Push Notification Outcomes in OneSignal
sbb-itb-2ec70df
Why Track Push Notifications in Real Time
Push Notification Engagement Metrics and Benchmarks
Tracking push notifications in real time helps distinguish between notifications that drive user engagement and those that may irritate users or lead to app uninstalls. Without immediate insights, you risk overlooking critical issues like expired certificates or broken SDK integrations, which can derail your campaigns before you even notice. Real-time tracking also captures influenced opens – cases where users open the app later without directly tapping the notification.
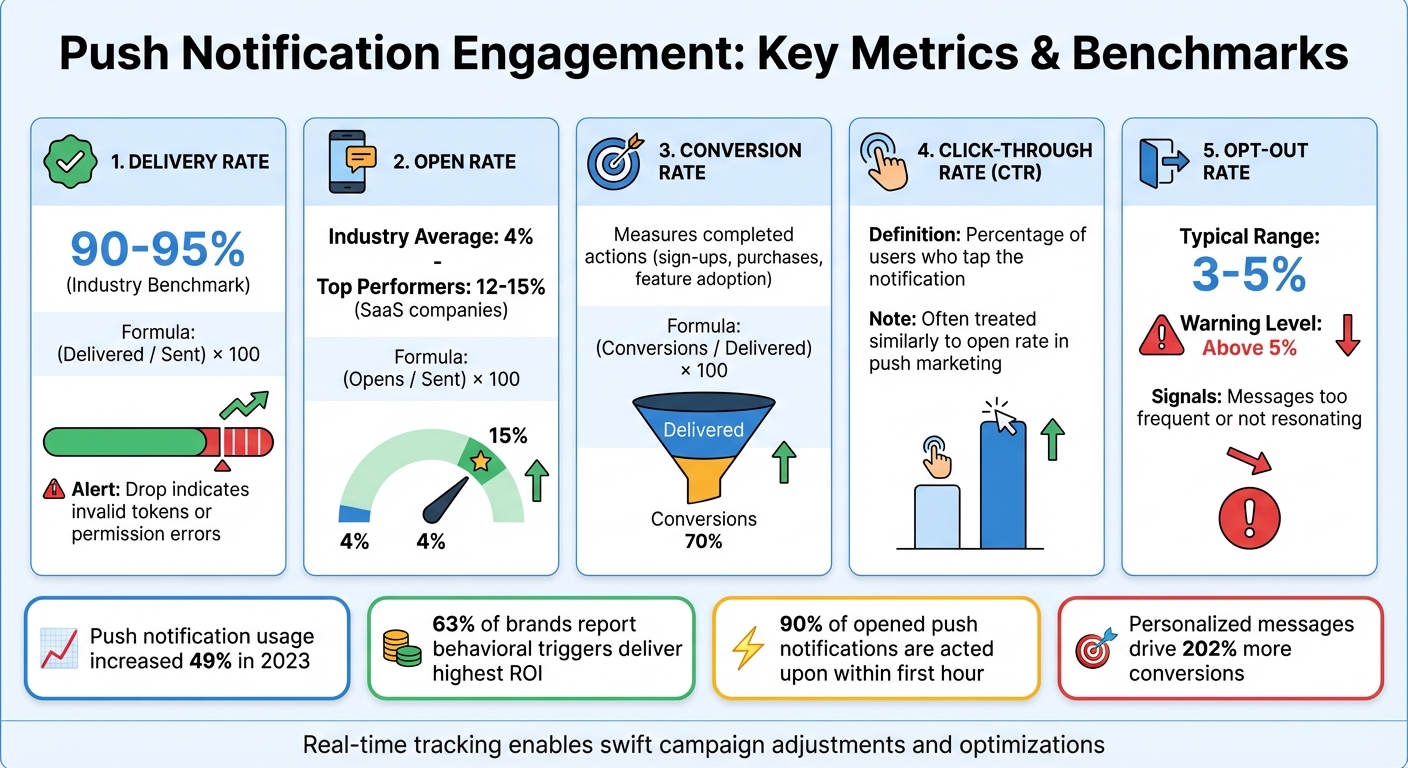
The stats speak for themselves. In 2023, brands increased their push notification usage by 49% compared to the previous year. Additionally, 63% of brands report that behavioral triggers – notifications sent in response to real-time user actions – deliver the highest ROI. Real-time tracking allows you to act quickly, whether it’s addressing a spike in unsubscribes by adjusting your messaging or reallocating your budget to capitalize on a high-performing message variant. These actionable insights are measured through specific metrics outlined below.
Key Metrics to Track
When tracking push notifications, focus on metrics like delivery rate, open rate, conversion rate, CTR, and opt-out rate.
- Delivery rate: This tells you what percentage of notifications actually reach users’ devices. It’s calculated as (Delivered / Sent) × 100, with industry benchmarks falling between 90–95%. A sudden drop might indicate issues like invalid tokens or permission errors.
- Open rate: This measures how many users tap the notification, calculated as (Opens / Sent) × 100. While the industry average is around 4%, some top SaaS companies achieve rates of 12–15%.
- Conversion rate: Since many users view notifications on their lock screens without tapping, conversion rate – calculated as (Conversions / Delivered) × 100 – provides a clearer picture of whether users complete the desired action, such as signing up, making a purchase, or adopting a feature.
- CTR (click-through rate): In push marketing, CTR is often treated similarly to open rate, as tapping the notification is the main form of engagement.
- Opt-out rate: This serves as an early warning system. If it surpasses the typical 3–5% average, it may signal that your messages are too frequent or not resonating with users.
These metrics, combined with real-time insights, enable swift campaign adjustments and more effective optimizations.
Benefits of Real-Time Insights
Real-time data is essential for fine-tuning your push notification strategies. It allows for immediate retargeting – if a user misses the first message, you can send a follow-up within minutes. It also supports on-the-fly A/B testing, letting you test different calls-to-action, rich media, or send times to see what drives faster engagement. Considering that 90% of push notifications that are eventually opened are acted upon within the first hour, speed is everything.
A great example comes from January 2023, when Busuu improved relevance through dynamic personalization in real time, boosting direct opens by 70%. As Customer.io aptly puts it:
"Success in marketing never solely boils down to metrics. Instead, success hinges on the connections you forge with your customers by creating relevant, engaging experiences for them at every turn".
Setting Up Real-Time Push Notification Tracking
To track push notification engagement in real time, you’ll need to follow three main steps: choose a platform, integrate SDKs, and set up analytics dashboards. These steps work together to give you a complete picture of your notifications’ performance.
Choose the Right Push Notification Platform
Start by selecting a platform that supports real-time event tracking. Look for features like Event Streams, which send live data – such as notifications sent, opened, clicked, or dismissed – straight to your data warehouse or analytics tools. Platforms like OneSignal are a good option, as they also offer Confirmed Delivery, ensuring that a notification reached the device itself, not just Apple’s APNs or Google’s FCM.
When comparing platforms, pay attention to how they handle data retention. For example, API-sent data might only be available for 30 days, while dashboard-sent messages could have lifetime retention. This is important if you plan to analyze trends over time. Additionally, check if the platform supports Influenced Opens, which track when users open your app within a specific window (typically 24 hours) after receiving a notification, even if they didn’t click on it.
Once you’ve selected a platform that meets your needs, the next step is to integrate its SDKs and enable event tracking.
Integrate SDKs and Enable Event Logging
Your platform should support features like live event streams, confirmed delivery, and influenced opens. Install the appropriate SDK for iOS, Android, or web. When a user opens your app for the first time, the SDK will automatically create user and subscription records. For mobile apps, enable key events like os_notification_opened (clicks), os_notification_received (Android delivery), and os_notification_influence_open (app opens within two minutes).
To ensure everything is working, use tools like LogCat for Android or Xcode logs for iOS. If you’re using Firebase, the DebugView tool can show how events propagate in real time, including details like notification_id and campaign. For mobile apps, set up a Notification Opened Event Handler to capture data from the notification payload, such as UTM values or custom parameters, and send it to your analytics provider. On the web, enable automatic UTM tagging to track clicks and conversions directly in Google Analytics.
After confirming that event logging is functioning correctly, move on to setting up your analytics dashboard.
Set Up Real-Time Analytics Dashboards
With the SDK integration complete, connect your platform to real-time analytics tools. For example, in OneSignal, you can link to Firebase through Data > Integrations > Firebase. Your dashboard should display key metrics like Confirmed Delivery (notifications that reached devices), Influenced Opens (app opens without clicks), and Confirmed CTR (click-through rates based on confirmed deliveries rather than total sends).
Adjust your Influence Window to match user behavior – while 24 hours is the default, you may need a shorter or longer window depending on your audience. For an influenced action to count, users must open the app and stay active for at least 30 seconds, then close or background it for at least 60 seconds. Set up attribution models to categorize user actions as Direct (clicked the notification), Influenced (opened the app within the influence window without clicking), or Unattributed (actions outside the attribution window). For web push notifications, use webhooks to track events like receipts and dismissals, even when the user’s browser isn’t actively open.
Analyzing and Optimizing Push Notification Campaigns
Monitor Engagement Trends
Once your real-time tracking is set up, the next step is to dig into the data and fine-tune your campaigns. A good dashboard should show engagement trends over 30- to 90-day periods, giving you a baseline for how different campaign types perform. Key metrics to watch include Click-Through Rate (CTR), Confirmed Delivery, and Influenced Opens – these help you understand how users are interacting with your notifications. Platforms like OneSignal store engagement data for up to two years, while Pushwoosh keeps hourly aggregated metrics for one year.
It’s also smart to break down performance by operating system – like iOS and Android – to better segment your data. Pay close attention to Influenced Opens, which track app launches within 24 hours of a notification, even without a click. This metric helps you measure passive engagement and can be adjusted based on user behavior.
For users who don’t engage, retargeting can be effective. Use audience activity reports to send follow-up messages via push notifications or email. Also, keep an eye on your Unsubscribe Rate immediately after each campaign. If users are opting out in large numbers, it could be a sign that your frequency or content needs adjusting. The impact of this will usually show up within hours.
These insights provide a foundation for improving your campaign strategies.
Refine Campaign Strategies Using Data
Leverage A/B testing to identify what works best for your audience. Use real-time CTR data and segment comparisons to see which timing, content, or approach resonates most. For example, a 12% CTR for recent abandoned cart notifications compared to just 3% for older ones suggests the need for quicker follow-ups. Influenced Opens can also be a useful metric for understanding the passive reach of your campaigns.
For deeper, long-term insights, make it a habit to export or stream your data regularly, as many platforms only store detailed records for 30 to 40 days. Instead of analyzing individual messages, focus on template analytics. This approach aggregates performance data across all campaigns using the same template, helping you spot patterns in high-performing content more easily.
Growth-onomics‘ Approach to Data-Driven Push Notification Tracking
Growth-onomics takes real-time tracking to the next level by combining advanced attribution techniques with multi-channel integration. By leveraging real-time event data – such as notifications sent, opened, clicked, or dismissed – the agency ensures that businesses can monitor campaign performance instantly, without waiting for delayed reports. This real-time feedback loop allows for quicker adjustments and smarter decision-making.
A standout feature of their approach is verifying when devices actually receive notifications. This step ensures businesses know their messages are reaching users, providing confidence that the content is visible. To further refine insights, Growth-onomics applies attribution models that categorize engagement into three types: Direct, Influenced, and Unattributed. This helps businesses differentiate between immediate interactions and passive engagement.
Their expertise in multi-channel integration enables businesses to track user engagement across push notifications, email, and SMS simultaneously. By analyzing cross-channel trends, businesses can identify which platforms deliver the best results and fine-tune message timing for maximum impact. This side-by-side analysis helps uncover which channels drive the highest return on investment (ROI).
Growth-onomics also uses real-time engagement data to build dynamic audience segments with user-level relevance models. Campaigns are then tracked against specific goals, like purchases or sign-ups, to calculate the ROI of each notification sent. This granular approach provides insights into not only who clicked but also who converted, along with how much revenue each campaign generated. This seamless integration of data and strategy enables highly targeted audience outreach.
The results speak for themselves. Businesses using these strategies report an average revenue increase of 45%, a 27% boost in engagement, and a 17% improvement in retention rates. One company even drove 1.5 million additional pageviews over four years through targeted re-engagement efforts. These data-driven methods clearly deliver measurable growth and lasting impact.
Conclusion
Real-time tracking gives you the tools to make quicker, informed decisions that directly impact your bottom line. By keeping tabs on metrics like delivery rates, click-through rates, conversion rates, and time-to-action, you can spot what’s working and adjust before an entire campaign veers off course. These insights allow you to catch technical hiccups – like delivery failures – right away, fine-tune messaging, and optimize send times to align with user activity. The result? Engagement rates that could soar 4 to 7 times higher compared to generic broadcasts.
The setup process – selecting the right platform, integrating SDKs, and creating real-time dashboards – pays off in a big way. For instance, effective strategies can increase app retention by as much as 190% and drive open rates up to 800% higher. Tracking the entire funnel, from delivery to conversion, also lets you measure clicks and calculate the exact ROI of every notification you send.
Growth-onomics takes this a step further with a data-focused approach that combines real-time event tracking with advanced attribution models and multi-channel integration. Their strategies are designed to help businesses improve performance, deepen engagement, and retain users – turning push notifications into a powerful tool for growth.
If you’re ready to move past basic metrics and adopt a system that delivers real results, check out Growth-onomics’ tailored marketing solutions. With expertise in data analytics, performance marketing, and customer journey mapping, they’ll help you create campaigns that not only capture attention but also build lasting customer relationships.
FAQs
How do I track influenced opens accurately?
To effectively track app opens influenced by push notifications, it’s important to measure both direct and indirect opens. Direct opens occur when users tap on the notification to open the app immediately. On the other hand, indirect opens happen when users open the app later, after noticing the notification, without tapping it.
By analyzing these behaviors within specific attribution windows – such as a 12-hour window for indirect opens – you can gain a clearer picture of how notifications drive user engagement. This approach helps you understand the broader impact of your push notifications on user behavior.
Which events should my SDK log for real-time reporting?
To capture real-time data on how users interact with push notifications, your SDK should track and log the following events:
- Notification delivery: Monitors when notifications are sent and successfully received, helping to measure delivery rates.
- Acknowledgment: Logs when devices confirm they’ve received the notification.
- Opens: Tracks when users click or interact with a notification.
- Custom user actions: Records specific in-app actions, such as making a purchase or logging out, to provide more detailed insights.
These logs can help you refine and improve your engagement strategies based on user behavior.
How do I attribute revenue to a push notification?
To connect revenue with a push notification, monitor user behavior within a set time frame – usually 72 hours – after the notification is sent or clicked. Utilize UTM parameters in platforms like Google Analytics to pinpoint conversions and generate custom reports. When working with an API, assign the channel attribute as "app" and submit purchase information within this attribution window to ensure precise tracking.