Stage conversion rates are essential for understanding how deals progress through your sales funnel. They measure the percentage of deals that move from one stage to the next, helping you identify bottlenecks and inefficiencies. Without analyzing these rates, you risk wasting resources on the wrong parts of your funnel.
Key Takeaways:
- What are stage conversion rates? They track how deals move through stages like Lead → MQL → SQL → Opportunity → Closed-Won.
- Why they matter: They help pinpoint problem areas in your funnel. For example, a 10% improvement in three stages can boost revenue by 33%.
- How to calculate: Use simple formulas like:
- Stage-to-Next Conversion Rate: (Deals advanced ÷ Deals entered) × 100
- Stage-to-Win Rate: (Deals won ÷ Deals entered) × 100
- Steps to analyze:
- Define clear funnel stages with specific entry/exit criteria through customer journey mapping.
- Gather clean, reliable data (timestamps, deal values, UTM parameters).
- Analyze trends and segment results by device, traffic source, and user type.
- Focus on fixing drop-offs, especially in bottom-of-funnel (BOFU) stages.
By breaking down data at each stage, you can stop guessing and focus on where improvements will have the most impact. Small changes in critical areas can lead to significant revenue gains.
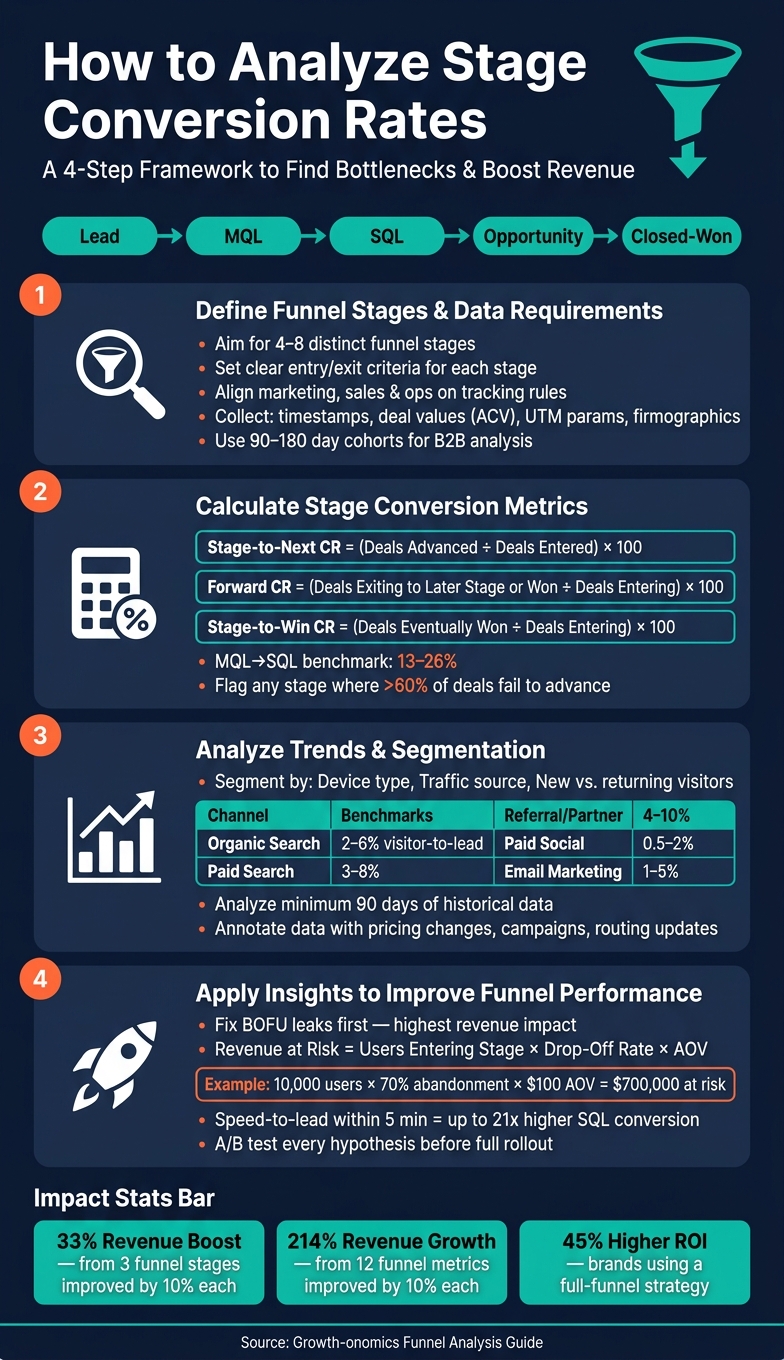
How to Analyze Stage Conversion Rates: 4-Step Framework
Step 1: Define Funnel Stages and Data Requirements
Map Out Your Funnel Stages
Start by designing a funnel that reflects your actual customer journey – not a one-size-fits-all template. Aim for 4–8 distinct stages. Fewer than four stages might leave you without enough actionable insights, while more than eight can overwhelm you with unnecessary complexity.
Each stage should have clear entry and exit criteria. For example, what qualifies a lead to move from MQL (Marketing Qualified Lead) to SQL (Sales Qualified Lead)? Is it a completed discovery call or a budget discussion? Misaligned criteria can lead to inconsistent data interpretation. Before collecting any data, ensure that marketing, sales, and operations are all aligned on how these transitions are tracked.
As Cometly warns:
"The mistake most teams make? They define their funnel based on what’s easy to track rather than what actually matters. Don’t let your analytics tools dictate your strategy."
Focus on tracking specific actions like form submissions, demo requests, or trial activations – rather than generic metrics like page views. Once your funnel is defined, you can move on to gathering the data needed for analysis.
Gather and Clean Your Data
For each stage of the funnel, collect the following data points: entry and exit timestamps, unique opportunity IDs, deal values (ACV), UTM attribution parameters, and firmographic details like company size and industry.
Data quality is key. Deduplicate records, remove test entries, and standardize currency formats. Pay attention to consistency in UTM naming conventions – if one campaign uses "Facebook" and another uses "fb", your channel attribution will be fragmented and unreliable. Aligning these identifiers across your CRM and marketing automation tools enables seamless cross-platform analysis.
Here’s a quick breakdown of essential data categories and their purpose:
| Data Category | Key Data Points | Why It Matters |
|---|---|---|
| CRM Stage History | Opportunity ID, Stage Name, Entry/Exit Timestamps, Outcome | Tracks stage-to-stage conversion rates and velocity |
| Financial Data | ACV/ARR, Currency, Expected Close Date | Helps analyze conversion rates weighted by deal value |
| Attribution Data | UTM Source, Medium, Campaign | Identifies which channels generate high-quality leads |
| User Context | Device Type, Region, Segment (SMB/Enterprise) | Pinpoints audience-specific bottlenecks |
Set a Timeframe for Analysis
Once your data is clean, establish a timeframe for analysis. The observation window you choose should be 1.5–2 times your median days-to-close. For instance, B2B sales cycles often range from 60 to 120 days, so a 30-day window wouldn’t capture the full journey, leading to artificially low conversion rates.
For most B2B teams, 90- to 180-day cohorts are ideal. Only include deals where the cohort has fully matured beyond this window to avoid "right-censoring", where incomplete deals skew your data. Rolling 90-day cohorts are a solid option for identifying trends without being affected by short-term fluctuations.
Don’t forget to account for seasonality. Factors like a Q4 budget rush or a slow summer month can distort your results. Use data spanning 4–8 quarters to establish reliable baselines, separating actual improvements from seasonal variations. These steps will help you measure your funnel accurately and set the stage for meaningful improvements.
sbb-itb-2ec70df
What is funnel analysis? (And how to fix conversion bottlenecks)
Step 2: Calculate Stage Conversion Metrics
Once your funnel stages are clearly defined and your data is organized, the next step is to turn that information into actionable insights. These metrics will give you a clear picture of how each stage is performing and help you spot any bottlenecks that might be slowing things down.
Calculate Basic Conversion Rates
The simplest way to start analyzing your funnel is by calculating conversion rates. Here’s the formula:
Stage-to-Next Conversion Rate = (Deals Advanced to Next Stage ÷ Deals That Entered Current Stage) × 100
For example, if 200 leads enter the MQL stage and 40 advance to SQL, the conversion rate is 20%. This falls within the typical benchmark range of 13–26%. It’s important to include all deals in your calculation – even stalled or lost ones – because leaving them out can give you an inflated view of your performance.
Once you’ve nailed down the basics, you can expand your analysis by looking at metrics that show broader progression and overall win probability.
Measure Forward and Stage-to-Win Conversion
While the Stage-to-Next Conversion Rate focuses on movement from one step to the next, two additional metrics give you a bigger picture of how deals progress through the funnel and where they might be getting stuck:
- Forward Conversion Rate: This measures the percentage of deals that leave a stage and make it to later stages or end as Closed-Won.
- Stage-to-Win Rate: This predicts the likelihood that deals entering a stage will eventually close.
These metrics are especially helpful for forecasting. For instance, if the Stage-to-Win Rate at the Proposal stage is 35%, you can use that percentage to estimate the revenue you’re likely to generate from your current pipeline.
| Metric | Formula | Purpose |
|---|---|---|
| Stage-to-Next CR | (Deals Advanced to Next Stage ÷ Deals Entering Stage) × 100 | Measures how effectively deals move to the next step |
| Forward CR | (Deals Exiting to Any Later Stage or Won ÷ Deals Entering Stage) × 100 | Tracks overall progression toward the funnel’s end |
| Stage-to-Win CR | (Deals Eventually Won ÷ Deals Entering Stage) × 100 | Helps refine stage probabilities and improve forecasting accuracy |
Calculate Drop-Off and Leakage Rates
Not every deal makes it through the funnel, and those that don’t can provide valuable insights. The Drop-Off Rate is the flip side of the Stage-to-Next Conversion Rate. For example, if 40% of deals advance, then 60% drop off. Similarly, the Leakage Rate – calculated as 1 − Forward Conversion Rate – shows the percentage of deals that fail to move further.
To prioritize which stages need attention, you can calculate Revenue at Risk. Multiply the number of deals entering a stage by the drop-off rate and your average deal value. For instance, if a stage has a 45% drop-off rate and an average deal value of $50,000, it represents a much larger financial risk than a stage with a 70% drop-off rate and $5,000 deals.
"A 3% conversion rate could mean everyone drops off evenly across your site. Or it could mean 90% of people bail at checkout. Same number. Very different problems. Very different fixes." – Randy Wattilete, Founder, Kirro
Any stage where more than 60% of deals fail to advance should be flagged as a priority for deeper analysis.
Step 3: Analyze Trends and Segmentation
Now that you’ve got your stage metrics, it’s time to dig deeper and figure out what’s really going on. Numbers alone aren’t enough – you need to uncover patterns, pinpoint bottlenecks, and track how things have changed over time. This step is all about turning raw data into actionable insights.
Identify Stage Bottlenecks
Bottlenecks happen when deals stall or drop off at a particular stage more than expected. The clearest red flag? A sharp decrease in your Stage-to-Next Conversion Rate compared to benchmarks. But before jumping to conclusions, double-check your data for accuracy. Once you’re confident in your numbers, look at the time-to-next-step metric. If deals linger in a stage longer than they should, the issue might not be quality – it could be confusion, a slow process, or even a gating problem.
Another thing to watch for is whether drop-offs cluster around sessions with errors or slow page load times. If that’s the case, it’s likely a technical reliability issue rather than a problem with your messaging or user experience.
"The most important metric isn’t the overall conversion rate – it’s the biggest drop-off point. That’s where you’ll find the highest-leverage optimization opportunity." – Wonster Analytics
When prioritizing bottlenecks, focus on stages closer to the bottom of the funnel. A small improvement at the Proposal or Negotiation stage can often bring in more revenue than a larger improvement at the top.
Segment Performance by Key Dimensions
Looking at overall conversion rates can be misleading. For example, a 70% abandonment rate might break down into 85% on mobile and 55% on desktop – two very different problems requiring different solutions. Start by splitting your data by device type since mobile and desktop users behave differently.
Next, analyze performance by traffic source. For instance, SEO leads typically convert to SQL at around 51%, while PPC leads hover closer to 26%. Combining these into a single metric doesn’t give you the full picture and can lead to poor budget decisions. The table below highlights how visitor-to-lead rates vary by channel:
| Channel | Typical Visitor-to-Lead Rate | Key Conversion Lever |
|---|---|---|
| Organic Search | 2%–6% | Content relevance and CTA placement |
| Paid Search | 3%–8% | Ad-to-landing-page message match |
| Referral/Partner | 4%–10% | Trust transfer from the referring source |
| Paid Social | 0.5%–2% | Audience targeting precision |
| Email Marketing | 1%–5% | Segmentation and personalization |
Also, compare new vs. returning visitors. If returning visitors convert well but new ones don’t, the problem might be trust or unclear messaging. If both groups are underperforming, it could point to a deeper issue – like the offer itself.
Review Historical Trends
Once you’ve analyzed segments, take a step back and look at historical trends to understand how performance is shifting over time. A snapshot of your current conversion rates is helpful, but a trend line reveals whether things are improving or declining – and why. To get meaningful insights, analyze at least 90 days of data.
Pay close attention to early warning signs. For example, if your Lead-to-Opportunity conversion drops in January, it could signal a revenue shortfall in March or April. Identifying patterns like this early allows you to take corrective action before the impact hits your bottom line. When reviewing trends, make sure to annotate your data with any major changes – like pricing updates, new campaigns, or routing adjustments – so you can differentiate between real performance shifts and seasonal effects.
"The most valuable benchmark is not an external industry average. It is your own historical best. If you converted at 4% six months ago and now convert at 2.8%, the question is not whether you are ‘good’ relative to the industry but what changed in your own system to cause the decline." – KPI Tree
Also, pay attention to the pattern of a decline. If it’s sudden, you might be dealing with a technical issue. A slower, more gradual decline could point to factors like rep turnover, rising competition, or small UX issues piling up over time.
Step 4: Apply Insights to Improve Funnel Performance
Now that you’ve analyzed trends and segmented your data, it’s time to tackle specific issues in your funnel to boost revenue. Use the insights from your metrics to guide improvements that will have the biggest impact.
Focus on Weak Funnel Stages
Start by identifying the stages where high traffic coincides with high drop-off rates. These are the areas where you’re losing the most potential revenue. To calculate the revenue at risk, multiply the number of users entering the stage by the drop-off rate and the average order value (AOV). For example, if 10,000 users reach your checkout page, 70% abandon, and your AOV is $100, you could be losing around $700,000.
"Most B2B funnel problems are not lead volume problems. They are conversion problems hiding at one or two specific stage transitions." – Kushal Magar, SyncGTM
Focus on fixing leaks at the bottom of the funnel (BOFU) first. Problems here have the most direct impact on revenue. Trying to drive more traffic to a broken stage will only amplify your losses.
Once you’ve identified the weak spots, it’s time to plan precise fixes.
Make Targeted Improvements
Each stage of your funnel will have unique challenges, so your solutions need to be tailored. Here’s a breakdown of common problems and their fixes:
| Funnel Stage | Symptom | Fix |
|---|---|---|
| TOFU | High bounce rate | Match ad copy to landing pages; speed up page load times |
| MOFU | High exits on product pages | Add trust signals like reviews; clarify costs like shipping |
| BOFU | Cart abandonment | Enable guest checkout; display all costs upfront |
| MQL to SQL | Sales rejects leads | Improve lead scoring; establish a service-level agreement (SLA) with sales |
Before implementing any changes, create a testable hypothesis. For example: "Reducing the number of fields in the sign-up form from eight to four will decrease abandonment by reducing friction." Validate your hypothesis with an A/B test.
A great example comes from Bunzl, which used funnel analysis to spot a drop-off before checkout. After optimizing the checkout process, they saw a 9% increase in total sales and a 9.5% rise in click-through rates to checkout.
Another often-overlooked improvement is speed-to-lead. Following up on inbound leads within five minutes can increase SQL conversion rates by as much as 21x compared to waiting 30 minutes. If your follow-up times lag, this could be a process issue disguised as a conversion problem.
Project Revenue Impact
Before committing resources to a fix, estimate the potential revenue gain. For example, improving a 10% conversion point in a funnel with 100 purchases and a $100 AOV could add $4,000 in revenue without increasing traffic. Compare this to a 10% improvement earlier in the funnel – such as the landing-to-product stage – which might only generate $1,200. This shows why BOFU fixes often yield the highest immediate returns.
When you improve three stages by 10% each, the compounding effect can lead to a 33% increase in revenue. Running these "what-if" scenarios for your funnel helps you prioritize fixes and align them with your revenue goals.
Conclusion: Making Stage Conversion Analysis Part of Your Growth Strategy
Stage conversion analysis isn’t a one-and-done task. It’s an ongoing process that can have a massive impact on your bottom line. For example, improving three funnel metrics by just 10% each can result in a 33% revenue boost, while making twelve 10% improvements could drive an incredible 214% revenue growth.
Key Takeaways
This guide boils down to four essential steps: define your funnel stages clearly, calculate the right metrics, analyze trends and segments, and act on the data. Skipping any of these steps can undermine your efforts.
Here are a few principles to keep in mind as you refine your strategy:
- Segment your data. Aggregated numbers often mask critical insights. Break performance down by device, traffic source, and user type to uncover the full picture.
- Focus on revenue at risk. A small drop-off in a high-volume bottom-of-funnel (BOFU) stage can cost far more than a larger drop early in the funnel.
- Combine quantitative and qualitative insights. Metrics show where users are leaving; tools like session recordings and heatmaps can reveal why.
- Test before implementing. Use A/B testing to confirm that your proposed changes actually improve downstream conversions.
"Conversion funnel analysis is not a one-time audit. It’s the foundation of any optimization program that compounds over time." – Erin Choice, CRO Specialist, CROforce
Brands that adopt a full-funnel strategy often see a 45% higher ROI compared to those that focus on just one stage. By following these principles, you can create a continuous cycle of improvement, turning insights into measurable revenue gains.
How Growth-onomics Can Help
If you’re ready to take your funnel optimization to the next level but aren’t sure where to begin, Growth-onomics can help. Their expertise spans Data Analytics, Customer Journey Mapping, UX, and Performance Marketing, making them well-equipped to diagnose funnel issues and implement tailored solutions. Instead of relying on guesswork, Growth-onomics uses data-driven strategies to prioritize changes that directly impact your revenue.
FAQs
How do I choose the right funnel stages for my business?
To create an effective funnel, start by mapping out the steps your customers typically take – from their first interaction with your brand to achieving your primary conversion goal. Aim for 3 to 8 well-defined steps to maintain clarity without overwhelming yourself with unnecessary details.
For instance, an e-commerce funnel might include these stages: visiting the website, viewing a product page, adding an item to the cart, proceeding to checkout, and completing a purchase. Each stage should represent a clear, measurable action that aligns with how your customers naturally move through their journey.
How can I prevent incomplete deals from skewing conversion rates?
To keep your conversion data accurate, consider using cohort-based tracking. This method lets you monitor specific groups of deals as they move through your pipeline over time. Aim for a sample size of 30–50 deals per stage to ensure reliable insights. Additionally, give these deals enough time to move through the entire sales cycle.
It’s also important to establish clear, verifiable exit criteria for each stage. This helps reduce manual mistakes and ensures every opportunity is properly recorded in your system.
Which stage should I optimize first to increase revenue fastest?
To increase revenue in a short time, target the stage in your funnel where the drop-off is most significant compared to industry averages. Use analytics tools to measure conversion rates at each stage and identify where users are falling off the most. Focus your efforts using the PIE framework, which helps prioritize projects based on three factors: potential impact, importance of stage traffic, and ease of implementation. Platforms like Growth-onomics provide strategies rooted in data to help you identify and tackle these high-priority issues efficiently.