

Marketing ROI is all about proving that your efforts are worth the investment. But with only 37% of CMOs confident in showing short-term ROI and just 31% in demonstrating long-term ROI, it’s clear that tracking results is a challenge. That’s where ROI templates come in.
These five templates simplify ROI calculations, helping you track costs, revenue, and efficiency across campaigns, websites, leads, events, and product initiatives. They give you clear metrics like ROI percentage, cost per lead, and break-even points – all in a structured format. Whether you’re managing ad spend, website performance, or event budgets, these tools help you make data-driven decisions.
Here’s what each template offers:
- Marketing Campaign Template: Tracks ROI for multi-channel campaigns like ads, email, and SEO.
- Website ROI Calculator: Measures website performance, from traffic to conversions and revenue.
- Leads and Customers Template: Evaluates lead-to-customer efficiency and acquisition costs.
- Event and Acquisition Template: Analyzes the ROI of events and customer acquisition efforts.
- Product & Initiative Template: Assesses the financial impact of new features or strategic projects.
1. Marketing Campaign ROI Template
Input Metrics and Customization Options
Getting accurate data is the backbone of any ROI calculation. This template relies on two main inputs: Total Marketing Cost (your investment) and Sales Revenue (your return). What makes it versatile is the ability to customize inputs for different channels – whether that’s paid ads, email campaigns, influencer collaborations, or content marketing. You can track fixed costs (like ad spend or production fees) alongside variable expenses (such as labor or hourly rates).
For businesses with multi-stage funnels, the template can also handle metrics like "Conversion Rate to Lead" and "Conversion Rate Lead to Sale." Depending on your business model, you can adapt the "Value of Sale" field to reflect either Customer Lifetime Value (CLV) for subscription models or Average Order Value (AOV) for e-commerce.
"This tool helps quantify marketing effectiveness by tying campaign-level costs directly to leads, deals, and revenue." – American Marketing Association
Pro Tip: To focus specifically on marketing-driven results, subtract "Organic Sales Revenue" from your total revenue. Also, include labor costs for a complete picture of your investment. Once you’ve input these tailored metrics, the template transforms raw numbers into actionable insights.
Output Metrics and Insights Provided
Using the input data, the template generates a range of metrics to help you evaluate performance. It calculates ROI as both a percentage and a dollar value, while also providing efficiency metrics like Cost Per Lead (CPL), Cost Per Acquisition (CPA), Return on Ad Spend (ROAS), and Cost Per Sale (COS). For an added layer of analysis, advanced versions include break-even calculations, showing the minimum results needed to avoid losses.
The template goes beyond basic figures by offering insights into funnel performance. It tracks conversion rates at different stages, such as visit-to-lead, lead-to-customer, and overall visit-to-customer. These insights help you identify where prospects are dropping off, making it easier to refine your strategy. Most templates are available in Excel or Google Sheets, complete with built-in charts and graphs to simplify data presentation for stakeholders.
Use Cases and Applicability to Marketing Goals
This template works for nearly any marketing channel. Whether you’re analyzing paid social campaigns, SEO efforts, email sequences, or influencer partnerships, it helps you evaluate performance and compare results. Free and subscription-based versions are widely available, enabling you to track metrics across multiple channels and set benchmarks.
For example, you can compare a Facebook ad campaign with a 300% ROI to an SEO initiative delivering a 200% ROI, even if their input metrics differ. This kind of analysis helps you allocate budgets more effectively. Over time, tracking multiple campaigns allows you to establish benchmarks for metrics like average CPL and ROI by channel, making it easier to plan future investments.
Ease of Comparison Across Campaigns or Channels
The real strength of this template lies in its consistency. Regardless of whether you’re measuring Cost Per Click (CPC) for an ad campaign or cost-per-article for SEO, the ROI percentage remains the same. This standardization makes cross-channel comparisons simple, allowing you to quickly reallocate budgets based on actual performance.
2. Website ROI Calculator Template
Input Metrics and Customization Options
Expanding on the campaign ROI framework, the website ROI calculator takes a more comprehensive look at your site’s overall performance. This template requires a broader range of inputs compared to the campaign-specific version. You’ll need to gather traffic data like monthly visitors, pageviews, and traffic directed to high-intent pages (e.g., pricing, demo, or product pages). Additionally, factor in costs such as development, hosting, internal labor, and website-specific marketing expenses. Conversion metrics like your lead conversion rate and sales conversion rate (lead-to-close) are also essential.
On the value side, include metrics such as your average sale amount, Customer Lifetime Value (LTV), and gross profit margin. For more detailed analysis, advanced templates allow you to add custom cost rows for items like product samples or allocated employee time. Depending on your business model, you can adjust the "Value of Sale" field – for example, using Average Order Value (AOV) for e-commerce or LTV for subscription-based businesses.
Output Metrics and Insights Provided
After entering the necessary data, the calculator delivers key metrics like total ROI, net profit in dollars, and revenue generated by the website. You’ll also get efficiency ratios, including Cost per Lead (CPL), Cost per Visitor, Cost per Buyer, and Revenue per Lead. More advanced templates may include projections such as "Days to Break Even" and "Days to Reach ROI Goal", tailored to your current activity levels.
"As soon as we implemented the new website, our traffic increased by 100%, and our conversions jumped by 120%." – Brandon Redlinger, CMO, Avarra AI
Use Cases and Applicability to Marketing Goals
Website ROI templates are particularly useful for justifying redesign investments by comparing performance before and after launch. They also come in handy when seeking budget approval from finance teams, as they present a clear and defensible view of returns on spending. Additionally, these templates help you assess immediate conversion improvements alongside long-term SEO growth, enabling you to set realistic expectations with stakeholders.
To ensure accurate ROI calculations, connect your marketing channels to tracking tools like Google Analytics 4. This will allow you to properly attribute traffic and conversions. When analyzing traffic, focus on pages with commercial intent rather than total site traffic to get a more precise picture of revenue impact.
Ease of Comparison Across Campaigns or Channels
This template aligns with the broader ROI measurement approach, making it easy to compare website performance with other marketing channels. Advanced versions include roll-up sheets that aggregate data from individual campaign tabs, offering a side-by-side comparison of different initiatives. By using standardized metrics like CPL and ROI percentage, you can evaluate your website’s performance against other channels, such as paid social or email marketing. This makes it easier to allocate budgets based on actual performance data.
Marketing ROI Calculator Excel and Google Sheets
3. Leads and Customers ROI Template
This template dives deep into the journey from lead acquisition to customer conversion, focusing on actionable metrics that help you evaluate the effectiveness of your marketing efforts.
Input Metrics and Customization Options
The full funnel journey is the centerpiece of this template, tracking everything from the first interaction with a prospect to their transformation into a paying customer. To get started, you’ll need to input key data points: total marketing activity costs, the number of leads generated, closed sales figures, and the total revenue or sales value generated. For those looking to refine their analysis, advanced options include adding the average profit per sale, total audience reach, and historical lead-to-customer conversion rates.
Customization options allow you to adjust attribution models, letting you credit either the final touchpoint or distribute credit across all touchpoints. To isolate the marketing impact, subtract organic sales revenue from your calculations. If your focus is purely on lead generation without immediate sales, you can estimate lead value by multiplying the number of new leads by your historical conversion rate and average sale price.
Output Metrics and Insights Provided
This template calculates Cost Per Lead (CPL) and Cost Per Acquisition (CPA) to give you a clear picture of your financial efficiency. It also provides insights into your "Lead Close Rate" – the percentage of leads that convert into paying customers – and measures total revenue and profit uplift. Additionally, it calculates the specific dollar value of your marketing return. Advanced templates go a step further by including break-even metrics, helping you determine the minimum conversion rate required to cover your costs.
"Calculating ROI on lead acquisition is critical as the goal is to keep Cost Per Lead (CPL) in line with your company’s revenue goals." – HubSpot
Use Cases and Applicability to Marketing Goals
For campaigns focused on lead generation, this template emphasizes metrics like the visit-to-lead conversion rate and CPL, which measure the efficiency of your efforts at the top of the funnel. If you’re working on customer retention or subscription-based models, you can replace single transaction values with Customer Lifetime Value (CLV) in the "Value of Sale" field. The template also supports multi-stage funnels, tracking both traffic-to-lead and lead-to-sale conversion rates. This dual-layered approach aligns with the framework established in earlier templates, ensuring consistency across campaigns. Additionally, segmenting by channel allows for more precise analysis, seamlessly integrating with prior ROI comparisons.
For accurate results, it’s crucial to establish a Service Level Agreement (SLA) between marketing and sales. This agreement should define an acceptable CPL in relation to CLV. Also, keep in mind that ROI may appear lower in the early months due to longer sales cycles, so tracking leads by source is key.
Ease of Comparison Across Campaigns or Channels
This template simplifies side-by-side comparisons by standardizing rows for different activities, such as email campaigns, events, or paid ads. A marketing ROI of 5:1 is considered strong, while 10:1 is exceptional. However, anything below 2:1 often fails to cover production and sales costs.
sbb-itb-2ec70df
4. Event and Acquisition ROI Template
This template is designed to evaluate the return on investment (ROI) for events and acquisition campaigns by accounting for all costs – both visible and hidden. Like earlier templates, it ensures data consistency across channels, making ROI comparisons more straightforward.
Input Metrics and Customization Options
For events, you’ll need to track hard costs (like travel, registration, venue rentals, and entertainment) and soft costs (calculated by multiplying team hours by hourly rates). When working on acquisition campaigns, key inputs include the total initiative cost, audience reach, response rate (percentage of leads generated), conversion rate (percentage of leads that make a purchase), and average profit per sale.
You can also tailor the template to fit your specific needs. Tools like the AMA ROI calculator allow you to adjust activity rows for different channels – whether it’s magazines, email, or events – ensuring a standardized approach for comparison. By maintaining consistent metrics, you’ll simplify cross-channel evaluations.
Output Metrics and Insights Provided
Once you’ve entered the metrics, the template calculates several key figures. For events, it determines cost per person, overall ROI in dollar terms, and ROI percentage. For acquisition campaigns, it tracks metrics such as number of leads generated, closed deals, cost per lead (CPL), and cost per acquisition (CPA). It also provides deeper financial insights, including total revenue uplift, profit uplift (margin), and a break-even analysis based on response rates, conversion rates, and profit per sale. A particularly useful feature is the cost avoidance factor, which compares traditional in-person expenses (like travel and lodging) with virtual alternatives to quantify potential savings.
Use Cases and Applicability to Marketing Goals
This template is an excellent tool for justifying event budgets to finance teams. For example, you can use historical ROI data to determine whether a large formal event or a smaller gathering, like a cocktail party, is more effective at acquiring customers. In influencer marketing, it factors in costs like outreach labor, influencer fees, product samples, and creative production, then measures returns based on traffic, click rates, and conversions. By documenting multiple campaigns, you can calculate average CPL and ROI percentages over time, helping you set realistic goals and spot trends in rising costs. Keep in mind that precise digital acquisition tracking requires integrating marketing channels with tools like Google Analytics before using the template.
Ease of Comparison Across Campaigns or Channels
By using standardized metrics such as CPL and ROI, the template makes it easier to compare performance across different channels. This simplifies budget decisions and helps identify which channels are delivering the best returns. Additionally, it supports cost avoidance analysis by comparing direct expenses (like airfare and lodging) and indirect costs (like preparation time) for physical events against virtual alternatives.
"ROI provides leaders with information about a project’s worth, and can help garner their support by removing uncertainty and subjective benefits." – Andy Marker, Smartsheet
5. Product Feature and Initiative ROI Template
This template builds on established ROI frameworks to focus specifically on evaluating the financial impact of product features and initiatives. It tracks both immediate costs and long-term value by accounting for hard costs (like software, materials, and ad spend) and soft costs (internal labor, calculated by multiplying employee hourly rates by the hours spent). To calculate an hourly rate, use this formula: (Yearly Salary ÷ 52 weeks) ÷ 40 hours. Then, multiply the result by the estimated hours each team member dedicates to the project.
Input Metrics and Customization Options
To calculate returns, input key metrics tailored to your specific initiatives. For product initiatives, track metrics like R&D costs, scrap reduction, inventory cost changes, and new product revenue. For marketing initiatives, record data such as reach, traffic, lead volume, and funnel conversion rates. Include value metrics like Average Order Value (AOV), Customer Lifetime Value (CLV), or average profit per sale. To isolate the impact of your initiative, subtract organic sales revenue from the total.
Output Metrics and Insights Provided
This template expands on traditional ROI calculations by including advanced financial metrics like Net Present Value (NPV) and Internal Rate of Return (IRR), alongside standard marketing indicators. After entering your data, the template calculates:
- NPV: Determines whether a product or feature will generate sustained value over time.
- IRR: Estimates the percentage profitability of your investment.
- Operational improvements, such as scrap reduction, rework savings, and ECO labor cost reductions.
- Time to Market (TTM) benefits: Helps align product launches with key market opportunities.
For marketing initiatives, the template also provides metrics such as ROI percentage, Net Profit, Cost Per Lead (CPL), and Cost Per Acquisition (CPA).
Use Cases and Applicability to Marketing Goals
This tool is particularly valuable when prioritizing multiple product features or initiatives. Outputs like NPV and IRR allow you to rank projects side by side, with any project showing an NPV greater than zero being considered financially viable. It’s also useful for presenting long-term investment justifications to leadership. When tracking revenue from a new feature or content piece, ensure consistency by applying the same trial period (e.g., 30 days or 6 months) across all initiatives. For accurate results, make sure your digital tracking is properly set up – tools like Google Analytics are essential for attributing metrics correctly.
Ease of Comparison Across Campaigns or Channels
By logging multiple initiatives in one template, you can calculate average CPL and ROI percentages for each channel. These benchmarks help forecast future investments and monitor rising costs. The standardized framework allows you to rank initiatives by financial impact, making it easy to spot high-performing versus low-performing channels. For product-focused initiatives, compare unique efficiency metrics – such as scrap reduction, part standardization benefits, and ECO labor cost savings – alongside traditional marketing metrics. This consistent approach simplifies cross-channel comparisons and supports more informed budgeting decisions.
Template Comparison Table
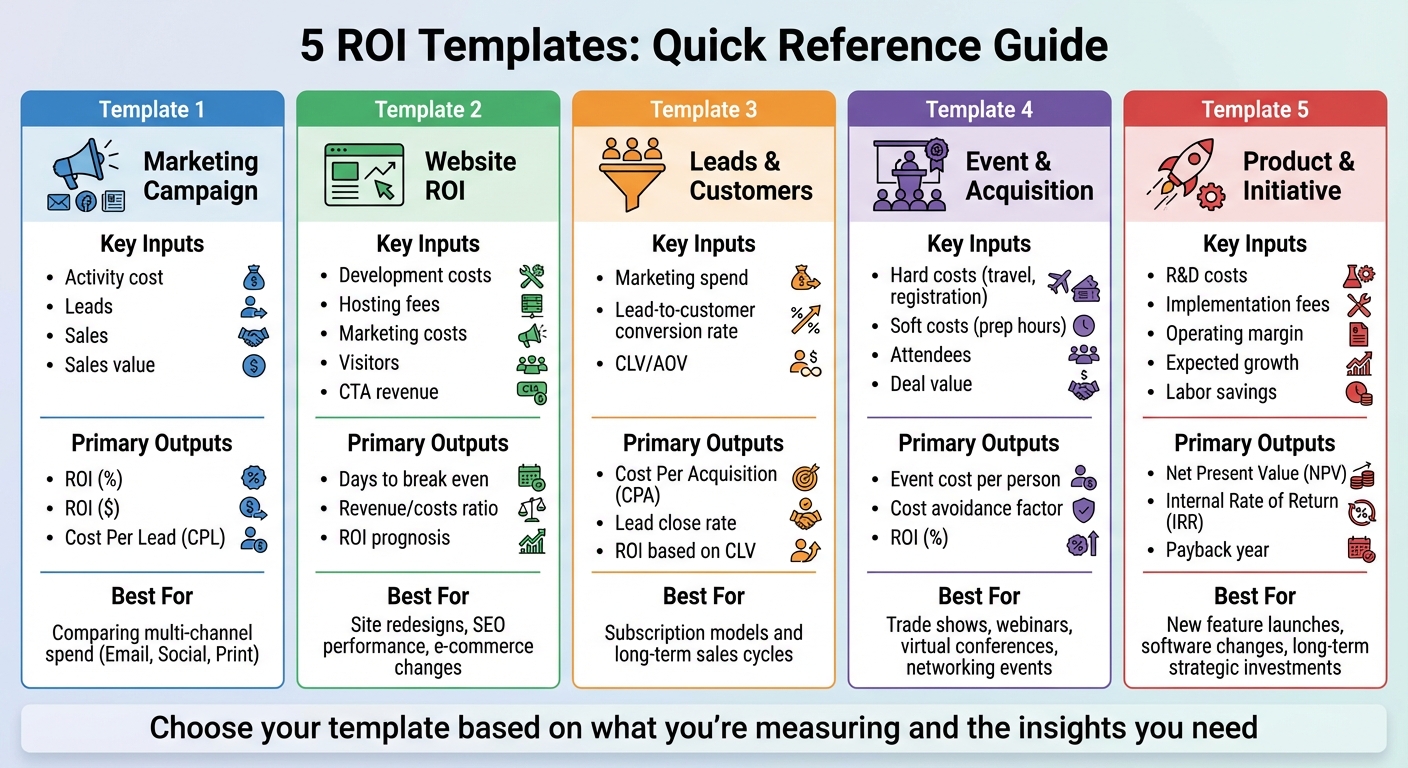
Marketing ROI Template Comparison: Key Metrics and Use Cases
Having a unified ROI framework is essential for comparing campaign performance and making smart budget choices. To simplify the process, this table highlights key differences across various ROI templates, building on the detailed calculations discussed earlier.
The right ROI template depends on what you’re analyzing and how you intend to use the results. Each one focuses on specific inputs and delivers tailored insights for different scenarios. Whether you’re evaluating multi-channel campaigns, planning a website redesign, tracking funnel performance, assessing events, or strategizing long-term investments, this table can help you pinpoint the best fit for your goals.
| Template Type | Key Input Metrics | Primary Output Insights | Best Use Case |
|---|---|---|---|
| Marketing Campaign | Activity cost, number of leads, number of sales, sales value generated | ROI (%), ROI ($), Cost Per Lead (CPL) | Comparing multi-channel spend (e.g., Email, Social, Print) |
| Website ROI | Development costs, hosting/support fees, marketing costs, unique visitors, revenue from CTAs | Days to break even, revenue/costs ratio, ROI prognosis | Evaluating site redesigns, SEO performance, or e-commerce platform changes |
| Leads & Customers | Marketing spend, lead-to-customer conversion rate, CLV or Average Order Value | Cost Per Acquisition (CPA), lead close rate, ROI based on CLV | Subscription models and long-term sales cycles |
| Event & Acquisition | Hard costs (travel, registration fees), soft costs (prep hours), number of attendees, deal value | Event cost per person, cost avoidance factor, ROI (%) | Trade shows, webinars, virtual conferences, and high-touch networking events |
| Product & Initiative | R&D costs, implementation fees, operating margin, expected growth, labor savings | Net Present Value (NPV), Internal Rate of Return (IRR), payback year | New feature launches, software system changes, or long-term strategic investments |
For quick budget decisions, the Marketing Campaign template helps identify which channels deliver the best returns. If you’re monitoring funnel performance, the Leads & Customers template highlights where prospects drop off during the journey from visit to purchase. For long-term planning, the Product & Initiative template uses metrics like NPV and IRR to evaluate investments, while the Event & Acquisition template compares costs and benefits of in-person versus virtual events using cost avoidance factors.
"Whether you’re managing a small marketing team or overseeing a multi-channel program, this template clarifies investment returns, ensuring marketing decisions are based on performance data rather than guesswork." – AMA Marketing ROI Calculator
Conclusion
The ROI frameworks outlined earlier serve as powerful tools for making smarter marketing decisions. By using these templates, teams can justify their budgets, fine-tune campaigns, and clearly showcase the impact their efforts have on business outcomes.
These templates offer three major advantages: securing necessary resources, improving campaign performance, and prioritizing investments effectively. Demonstrating that marketing activities lead to measurable results can open doors to bigger budgets and new opportunities. They also help track ROI trends over time, compare the performance of different channels, and pinpoint areas that need improvement. As a decision-making tool, ROI metrics highlight which projects deserve funding and which ones might not be worth pursuing.
To maximize their effectiveness, tailor your templates with specific data points like cost per click, email engagement rates, or influencer fees. The best template for you will depend on what you’re measuring and the insights you need. Whether it’s comparing spending across multiple channels, assessing the impact of a website redesign, monitoring funnel performance, or planning for long-term growth, these frameworks ensure your decisions are backed by solid, actionable data.
FAQs
How do I select the best ROI template for my marketing goals?
To pick the right ROI template for your marketing goals, start by pinpointing what you want to achieve with your campaign. Are you zooming in on the performance of a specific channel, like paid ads, or analyzing how a multi-channel strategy is working overall? Different templates cater to different needs – some focus on short-term results like ad spend and conversions, while others dig into long-term metrics, such as customer lifetime value.
Think about the level of detail and flexibility you require. If you’re looking for a quick overview, basic templates work well for high-level insights. On the other hand, if you need deeper analysis, there are templates designed for more advanced calculations. Choosing one that aligns with your goals and the metrics that matter most to your campaign will ensure you’re equipped to make smart, data-backed decisions.
What are the key metrics to evaluate the success of a website redesign?
To gauge the success of a website redesign, it’s important to focus on metrics that reflect both user experience and the impact on your business. One key metric to monitor is conversion rate – a well-executed redesign can make a noticeable difference in how visitors interact with your site and complete desired actions. Another crucial factor is page load time. Websites that load in under 3 seconds tend to perform better, reducing bounce rates and encouraging users to stick around longer.
You should also keep an eye on organic traffic growth, which can indicate whether your SEO efforts have improved post-redesign. Other valuable metrics include lead generation, revenue impact, and user engagement indicators like bounce rate and time spent on the site. By analyzing these data points, you can measure the redesign’s return on investment (ROI) and ensure it supports your broader business goals.
How can I calculate ROI effectively for multi-channel marketing campaigns?
To figure out ROI for multi-channel marketing campaigns, start with the basic formula: ROI = (Revenue – Cost) / Cost. For multi-channel efforts, though, you’ll need to break it down further by looking at the costs and revenue tied to each specific channel. This includes things like ad spend, content creation costs, and management fees.
Tracking accurately is essential. Use tools or templates to log channel-specific investments and returns. Many templates can automatically calculate total costs, revenue, and ROI percentages, helping you see which channels are pulling their weight. Adding attribution models and factoring in customer lifetime value (LTV) can give you a more precise picture by assigning proper credit to each channel’s role.
With detailed tracking and smart attribution, you’ll have the insights needed to understand your campaign’s performance and make better decisions about where to allocate your marketing budget.