

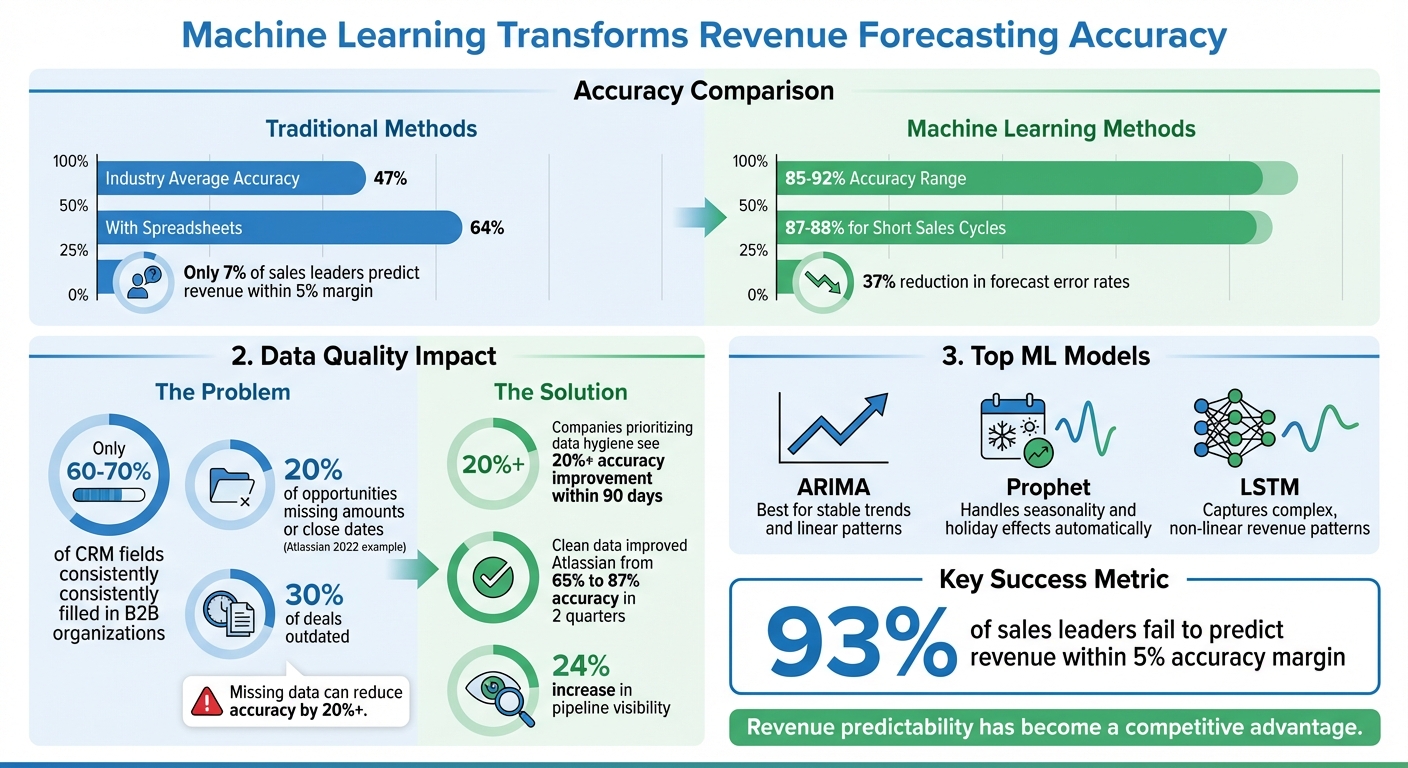
Machine learning is transforming revenue forecasting, enabling businesses to achieve accuracy rates between 85% and 92%, compared to the 47% industry average for traditional methods. By analyzing CRM data, emails, and historical trends, ML models eliminate bias and detect patterns that static spreadsheets miss. Here’s what you need to know:
- Why it matters: Accurate forecasts improve resource allocation, cash flow management, and investor confidence. Yet, 93% of sales leaders fail to predict revenue within a 5% margin of accuracy.
- How ML helps: Advanced techniques like LSTM networks and Gradient Boosted Trees analyze complex sales cycles, identifying risks weeks earlier than human analysis.
- Data preparation: Clean, consolidated CRM data is critical. Missing or outdated data can reduce accuracy by 20% or more. Automate data collection and standardize formats to ensure reliability.
- Top models:
- ARIMA: Great for stable trends.
- Prophet: Handles seasonality and irregular patterns.
- LSTM: Best for dynamic, non-linear revenue patterns.
- Validation & deployment: Use metrics like RMSE and MAPE to evaluate models. Automate retraining to keep forecasts aligned with market changes.
Machine learning isn’t just a tool – it’s a competitive edge for businesses aiming to improve revenue predictability and decision-making.
Machine Learning vs Traditional Revenue Forecasting: Accuracy Comparison and Key Statistics
Time Series Forecasting with XGBoost – Predict Store Revenue Using Python and Machine Learning
sbb-itb-2ec70df
Preparing Historical Revenue Data for Analysis
Having reliable revenue data is the backbone of accurate machine learning forecasts. Yet, in B2B organizations, only about 60% to 70% of CRM fields are consistently filled in. This incomplete data can seriously hinder forecasting accuracy. By focusing on collecting, cleaning, and preparing historical revenue data, companies can boost their forecasting accuracy to between 85% and 92%.
Collecting Revenue Data from Your Systems
Revenue data often lives in multiple systems – CRMs like HubSpot and Salesforce, accounting platforms, ERP systems, sales databases, and even Point of Sale (POS) terminals. To begin, consolidate all these sources into a single database or data warehouse. This ensures that your analysis is built on a complete and unified dataset. Instead of just looking at high-level summaries, collect transaction-level details, such as individual sales orders, subscription renewals, and contract specifics. These granular details allow machine learning models to detect patterns that broader metrics might miss.
Where possible, automate the data collection process using API integrations and scheduled imports. Relying on manual exports and spreadsheets not only wastes time but also increases the risk of errors.
"If your RevOps stack is fragmented, it’s on you and your team to make sure your data is fully consolidated before you start forecasting. That manual process costs you time and accuracy".
- Maria Akhter, Editor at Outreach
Beyond revenue totals, make sure to include data like stage progression history, win-loss outcomes, and changes in account ownership or sales territories. These details help account for structural changes in your sales process. Once all the data is consolidated, the next step is rigorous cleaning to ensure accuracy.
Cleaning Data and Handling Missing Values
Poor data quality can cripple forecasting efforts. For instance, in 2022, Atlassian faced a forecasting accuracy of just 65% because 20% of their opportunities were missing amounts or close dates, and nearly 30% of deals were outdated. By implementing quality checks and holding teams accountable, their Director of Revenue Operations improved accuracy to 87% within two quarters, while also increasing pipeline visibility by 24%. Clean data doesn’t just refine forecasts – it can transform your entire revenue operation.
Start by identifying and addressing gaps in critical fields like deal amounts, close dates, or recent activity. Set up automated alerts to flag missing or stale data. Companies that prioritize data hygiene can see forecast accuracy improve by 20% or more within 90 days. Standardize formats for dates (MM/DD/YYYY), currencies ($), and field names to maintain consistency across your dataset. With clean and consistent data in hand, you’re ready to move on to preprocessing it for machine learning.
Preprocessing Data for Machine Learning
To integrate historical data into machine learning models, you’ll need to preprocess it into consistent formats and create engineered features. Start by organizing revenue data into regular intervals, such as monthly or quarterly. Then, develop features like days in stage, time since last activity, or engagement score to capture subtle behavioral trends.
"No forecasting model, no matter how sophisticated, can produce reliable results from messy data".
- Nathan Thompson
Separate your data into categorical fields (e.g., industry, region) and numerical fields (e.g., deal size, contract length). Standardize these formats to reduce processing errors. Double-check that CRM stage progression follows logical patterns and that close dates align with actual bookings. Finally, set up a regular retraining schedule – whether weekly or monthly – to ensure your models stay aligned with market conditions and don’t fall victim to data drift.
Machine Learning Models for Revenue Prediction
Once your data is preprocessed and cleaned, the next critical step is selecting the best model for revenue prediction. Different models work well for different revenue patterns, and knowing when to use each can significantly improve forecast accuracy.
ARIMA Models for Baseline Trends
ARIMA (AutoRegressive Integrated Moving Average) is a go-to choice for analyzing linear trends, seasonality, and autocorrelation in historical revenue data. This model thrives in industries like retail or energy, where revenue patterns are relatively stable and consistent from month to month. By examining how past values influence future outcomes, ARIMA adjusts for trends over time.
However, ARIMA has its limitations. It struggles with sudden market changes and requires stationary data, making it better suited for businesses with predictable cycles and minimal volatility.
Prophet for Seasonality and Holiday Effects

Prophet, developed by Meta, is tailored for scenarios where seasonality and irregular intervals – like holidays or missing data – play a significant role. Unlike ARIMA, Prophet automatically identifies trend changepoints and handles multiple seasonal patterns, such as daily, weekly, and yearly fluctuations.
"Prophet’s key innovation was practical: it handles missing data gracefully, automatically detects changepoints in trend, and allows users to inject domain knowledge (holidays, known events) without statistical expertise."
- AI Code Invest
This makes Prophet especially useful for retail businesses that see revenue spikes during events like Black Friday or Cyber Monday. By incorporating holiday effects as parameters, the model can account for irregular but predictable events. If your data includes gaps or your sales cycles follow clear seasonal trends, Prophet offers a straightforward way to generate reliable forecasts without requiring advanced statistical expertise.
LSTM Neural Networks for Complex Patterns
For capturing intricate, non-linear patterns, LSTM (Long Short-Term Memory) networks are a powerful tool. These models shine in dynamic markets – like e-commerce – where buyer behavior frequently shifts, and revenue patterns involve multi-touch funnels or extended sales cycles. Unlike ARIMA or Prophet, LSTMs are capable of identifying subtle, long-term dependencies. For example, they can link a prospect’s engagement months ago to a purchase made today.
In 2022, the Bosch Center for Artificial Intelligence showcased how deep learning could tackle volatile market conditions. By integrating a masked attention mechanism, their LSTM-based framework ignored outlier data from April–May 2020, a period heavily impacted by COVID-19, leading to more accurate 12-month forecasts. This highlights how neural networks can adapt to unpredictable scenarios.
While LSTMs require large datasets, significant computing power, and are harder to interpret compared to statistical models, they deliver excellent results in complex B2B environments. To achieve consistently strong performance, consider ensembling your forecasts. Combining predictions from 3–5 models – such as one statistical, one gradient boosting, and one deep learning model – can often outperform any single approach.
Combining Historical Trends with Machine Learning Models
Blending historical revenue trends with machine learning can significantly improve forecasting accuracy. This isn’t about choosing between traditional statistical methods and AI – it’s about merging the best of both worlds to get the most out of your data.
Creating Features from Historical Data
Revenue data by itself doesn’t tell the whole story. To make it meaningful, you need to transform historical data into actionable features. For example, time-based variables like "Time Since Last Activity" (days since the last logged interaction) and "Days in Current Stage" (how long a deal has stalled in a pipeline phase) can uncover patterns of momentum or stagnation that directly affect close rates.
Performance metrics also add depth. Take "Rep Quota Attainment History", for instance – tracking the average quota percentage achieved over the past three quarters can help identify whether deals assigned to top-performing reps are more likely to close. Similarly, engagement scores based on email activity or meeting frequency can reveal behavioral patterns that static revenue figures simply can’t.
But none of this works without clean data. Missing data in even 30% of cases can cause models like ARIMA to falter. By enriching your dataset with these features, you set the foundation for hybrid models that can capture both straightforward trends and more intricate patterns.
Building Hybrid Model Architectures
Hybrid models combine the strengths of statistical techniques (like ARIMA or Prophet) with machine learning algorithms (like XGBoost or LSTM) to analyze both linear trends and complex relationships. These models use either additive residuals – where statistical model errors are added to machine learning outputs – or feature-based integration, where predictions from one model are used as inputs for another. Leveraging the clean, feature-rich data you’ve prepared earlier helps these hybrid models deliver more precise forecasts.
"The advantage of model combination lies in the fact that selecting a random hybrid model is less risky in terms of forecasting performance than selecting a random individual method."
- Dominik Stempień, Faculty of Economic Sciences, University of Warsaw
For companies with high-quality data, ML-based models can achieve 88% accuracy, compared to just 64% using traditional spreadsheet methods. Start with impactful features like deal age and rep performance history before adding more variables, as too many inputs can introduce noise and lower performance. Also, ensure your forecasts are tied to actionable planning elements like territories, quotas, and capacity rather than treating them as isolated statistical outputs.
Validating Model Performance
Once you’ve built your hybrid models, it’s critical to validate their reliability. Split your historical data into training and test sets, and use cross-validation techniques to test their consistency across different time periods. Compare machine learning outputs with traditional stage-weighted forecasts using metrics like RMSE (Root Mean Square Error) and MAPE (Mean Absolute Percentage Error).
| Metric | Purpose |
|---|---|
| MAPE | Measures the average percentage difference between predicted and actual values |
| RMSE | Evaluates the standard deviation of prediction errors, penalizing larger errors |
| ROC-AUC | Assesses how well classification models distinguish between "closed-won" and "closed-lost" deals |
To ensure your model can handle uncertainty, test forecasts under different scenarios – for example, how hiring delays or a 10% price change might impact outcomes. This approach transforms ambiguity into measurable risk ranges. Companies that prioritize data quality see a 37% reduction in forecast error rates. Regularly monitor your data for drift and retrain models weekly or monthly to keep up with evolving buyer behavior and market dynamics.
Model Evaluation and Deployment
Metrics for Evaluating Model Accuracy
Selecting the right metrics is key to determining whether your forecasting model is practical and reliable. Let’s start with Mean Absolute Error (MAE), which calculates the average dollar amount your predictions are off by. This metric is especially useful for planning critical areas like cash flow and hiring budgets. For instance, an MAE of $50,000 could directly influence how much cash buffer you maintain.
Root Mean Squared Error (RMSE) takes it a step further by penalizing larger errors more heavily. This is crucial in situations where even one major misstep could disrupt an entire quarter. On the other hand, Mean Absolute Percentage Error (MAPE) can sometimes be misleading. It treats a 50% error on a $10,000 deal the same as a 50% error on a $1 million deal, which can distort priorities. Enter Weighted Mean Absolute Percentage Error (WMAPE) – a more refined approach that accounts for sales volume, ensuring high-value deals get the attention they deserve.
"Measurement is the precursor to trust. When revenue leaders cannot define their accuracy with precision, they lose credibility with the board and finance."
- Ben Kain-Williams, Regional Vice President of Sales, Terret
Another valuable metric is Forecast Bias (Mean Error), which highlights whether your team consistently over-forecasts (known as "Happy Ears") or under-forecasts ("Sandbagging"). Companies leveraging machine learning with clean CRM data often achieve forecasting accuracy between 85% and 92%, far surpassing the industry average of 47%. A best practice is to capture a snapshot of your pipeline on Day 1 of the quarter and compare it to Day 90 results. This method evaluates predictive performance, not just how well the model fits historical data. Once accuracy is measured, the next step is embedding these models into your day-to-day operations.
Deploying Models at Scale
After evaluating metrics, the next challenge is operationalizing your forecasts. Deployment isn’t just about running the model; it’s about seamlessly integrating predictions into your workflow. A great example is the Bosch Center for Artificial Intelligence, which implemented a system in 2022 to deliver 12-month revenue forecasts through REST API endpoints. These forecasts were integrated directly into business dashboards.
An API-first architecture ensures real-time integration with tools like Salesforce or HubSpot. To speed things up, parallelized training using services like AWS Lambda can handle multiple models simultaneously, significantly reducing training time. For a practical workflow, consider this cadence: refresh AI scores on Mondays, review at-risk deals on Wednesdays, and have sales reps update the CRM by Friday. This ensures your model always works with the freshest data.
Continuous Model Retraining
Markets are always changing, which means your models need to keep up. Regular retraining – weekly or monthly – is vital to address data drift, where the statistical properties of your input data evolve over time. Companies that prioritize clean CRM data and frequent retraining often see accuracy rates of 87–88% for short sales cycles.
Set up automated pipelines to monitor for drift and trigger retraining when necessary. A rolling 12-month data window ensures your model stays relevant by learning from current trends instead of outdated patterns. Additionally, automate field validation to flag missing or incorrect CRM entries, like close dates or deal amounts. The best systems retrain automatically as new data becomes available – whether from transcribed calls, refreshed enrichment data, or changes in macroeconomic indicators.
Advanced Techniques and Growth-onomics Support

Hyperparameter Tuning for Better Performance
Fine-tuning hyperparameters can significantly improve model accuracy, but it requires a separate optimization process. Tools like GridSearchCV systematically test every possible parameter combination you define, offering thorough results. However, this approach is resource-heavy. For instance, GridSearchCV took 17.81 seconds to evaluate 60 candidates for a linear SVM, while RandomizedSearchCV achieved nearly identical validation scores (around 0.99) in just 4.67 seconds by testing only 15 candidates.
For faster and smarter optimization, consider Bayesian methods using tools like Optuna or BayesSearchCV. Unlike grid searches, which grow exponentially as parameters increase, Bayesian optimization uses a "surrogate" model to efficiently explore the search space and pinpoint ideal values. To save time during any search, set the n_jobs parameter to -1 – this activates all available processors and significantly reduces computation time. Better-tuned hyperparameters directly enhance the precision of revenue forecasts.
Adding External Variables to Your Models
Relying solely on historical revenue data often falls short. Adding external factors like market indices, economic trends, or marketing spend can make models more robust. For B2C companies, variables such as pricing shifts, promotional campaigns, or macroeconomic changes can heavily influence revenue, making it crucial to go beyond historical trends. Tools like Prophet allow seamless integration of external data, such as weather patterns, holidays, or competitor activity, to improve forecasting accuracy.
The real game-changer lies in feature engineering. Incorporate predictors that directly impact revenue, such as customer acquisition cost (CAC), churn rate, or lead-to-opportunity conversion rates. You can also create multiple forecast scenarios to test your model’s resilience – what happens if interest rates rise or a competitor disrupts the market? Scenario planning not only strengthens your model but also prepares you for unpredictable market shifts. These advanced techniques set the foundation for expert support, as outlined below.
How Growth-onomics Supports Revenue Forecasting
Growth-onomics builds on these advanced techniques to elevate your revenue forecasting capabilities. By combining external variable integration, hyperparameter optimization, and hybrid modeling approaches, Growth-onomics delivers scalable, real-time solutions. Their methods blend traditional statistical models with machine learning to provide a comprehensive approach to forecasting.
Whether you’re dealing with poor data quality, need help identifying the right external variables for your industry, or want to automate retraining pipelines, Growth-onomics offers the expertise to transform forecasting into a strategic advantage. Their data-centric approach ensures your models adapt as market conditions shift, enabling confident decisions about hiring, budgeting, and growth strategies.
Conclusion and Key Takeaways
Steps for Effective Revenue Forecasting
To successfully integrate machine learning into your revenue forecasting, start by clearly defining your goals. Decide whether you’re predicting quarterly revenue, deal closure rates, or individual sales rep performance. Once your objectives are set, focus on data collection and preparation. Collect structured CRM data from platforms like HubSpot or Salesforce, clean up null values, and standardize formats for dates and currencies. This ensures your data is ready for analysis.
Next, go beyond basic CRM fields by creating advanced features like Time Since Last Activity or Engagement Scores. These additional data points can provide deeper insights. Then, choose the right forecasting model for your needs. For instance, ARIMA models work well for baseline trends, while Prophet or LSTM models handle more complex patterns. You might even combine models to get the best of both approaches. To ensure accuracy, validate your model using metrics like RMSE or MAPE, which measure how well it reflects historical data.
Once your model is ready, integrate its forecasts into your CRM or BI tools so predictions become part of your daily workflow. Finally, set up a regular retraining schedule – weekly or monthly – to ensure your model adapts to changing market conditions and data patterns.
Companies using machine learning models often achieve accuracy rates between 85% and 92%, compared to just 64% for those relying on spreadsheets. As Alex Zlotko, CEO of Forecastio, puts it:
"Revenue predictability has become a competitive advantage".
By following these steps, you can improve forecasting precision and lay the groundwork for advanced analytics solutions like those from Growth-onomics.
Partner with Growth-onomics for Data-Driven Growth
Taking these steps is a strong start, but partnering with experts can elevate your forecasting even further. Growth-onomics turns revenue forecasting into a strategic tool, replacing guesswork with objective, AI-driven insights. Their expertise addresses common challenges, such as cleaning up CRM data, identifying external factors that influence revenue, and automating retraining processes.
With Growth-onomics, businesses can eliminate inflated projections and human bias, creating forecasting systems that adapt to ever-changing market conditions. By combining these techniques with expert guidance, you can transform your revenue forecasting into a reliable engine for growth and long-term success.
FAQs
What’s the minimum CRM data needed to start ML revenue forecasting?
To get started with machine learning revenue forecasting, you’ll need a few key data points: historical sales data, current pipeline information, and activity signals such as calls, meetings, and buyer engagement. These elements form the foundation for building a forecast that’s both reliable and precise.
How do I choose between ARIMA, Prophet, and LSTM for my revenue data?
Choosing the right forecasting model – ARIMA, Prophet, or LSTM – depends on the nature of your data and specific requirements:
- ARIMA: Works well with stable, stationary datasets that exhibit consistent patterns and limited seasonality.
- Prophet: A great choice if your data includes holidays, has missing values, or features multiple seasonal patterns.
- LSTM: Best for large, noisy datasets with complex, non-linear trends, though it demands more data and computational resources.
Your decision should align with the structure of your data, its seasonal characteristics, and the resources available for analysis.
How often should I retrain my forecasting model to prevent drift?
Retraining your forecasting model on a regular basis is key to keeping it accurate and relevant. How often you should do this depends on how much your data changes and your specific business requirements. For many organizations, updating models on a weekly or monthly basis works well.
It’s also crucial to keep a close eye on your model’s performance. Patterns and external factors can shift over time, and continuous monitoring helps you stay ahead of these changes. As your model processes new data, periodic retraining or using drift detection methods can ensure your revenue forecasts remain dependable.