

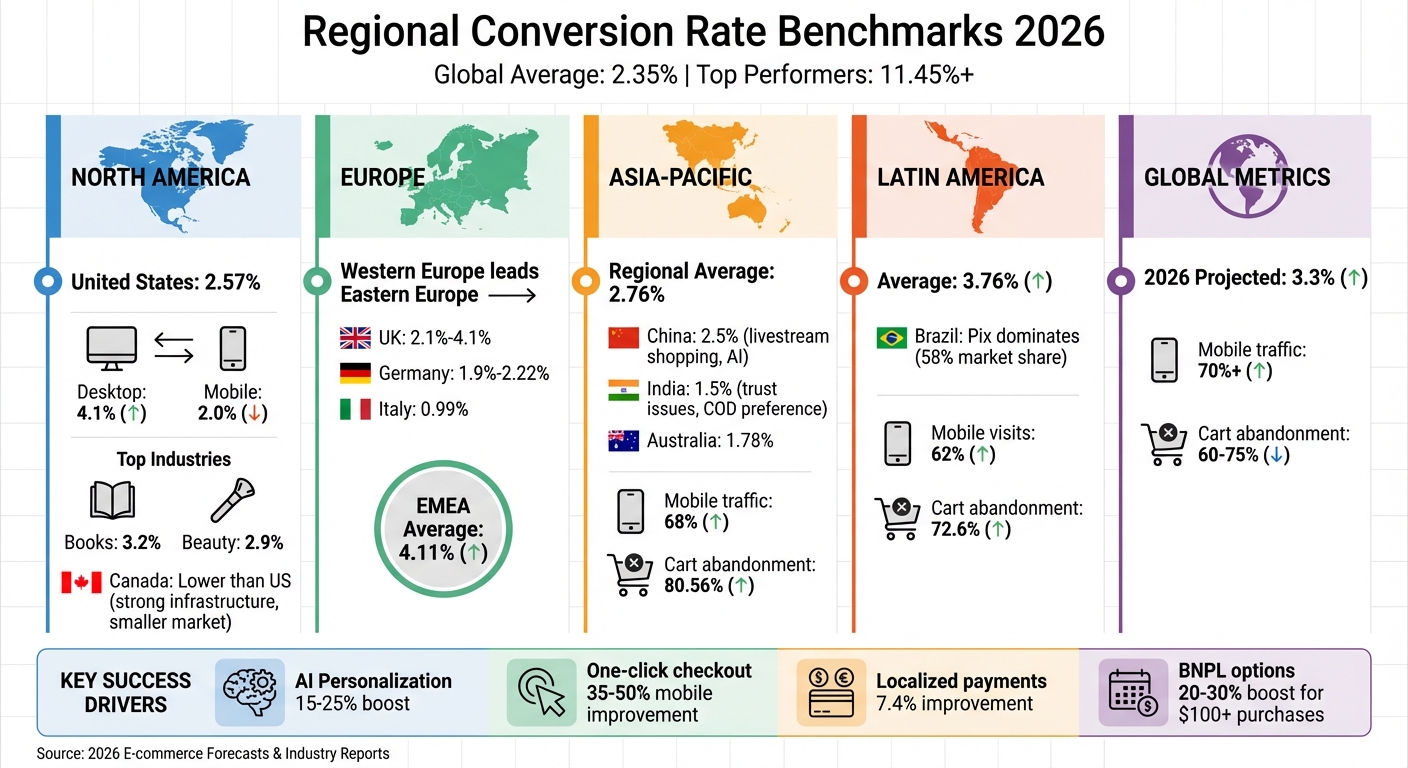
Conversion rates in 2026 highlight a global average of 2.35%, with top performers exceeding 11.45%. These rates vary by region due to differences in consumer behavior, infrastructure, and payment preferences. Here’s a quick summary:
- United States: Average 2.57%; desktop leads with 4.1%, mobile lags at 2.0%. Top industries include Books (3.2%) and Beauty (2.9%).
- Canada: Slightly lower rates than the U.S., hindered by market size despite strong digital infrastructure.
- Europe: Western Europe outperforms Eastern Europe. UK ranges from 2.1%-4.1%, while Italy lags at 0.99%.
- Asia-Pacific: China leads with 2.5%, while India struggles at 1.5% due to trust issues and COD preferences.
- Latin America: Average 3.76%, driven by tools like Pix in Brazil.
Key drivers of success include AI personalization, faster checkout options, and localized payment methods. To improve, focus on reducing friction in the customer journey, optimizing for mobile, and tailoring strategies to regional behaviors.
2026 Global E-commerce Conversion Rates by Region: Benchmarks and Key Drivers
North America Conversion Rates
United States
In 2026, U.S. e-commerce stood out with a conversion rate of 2.57%. Across industries, rates typically ranged from 2.7% to 3.5%, with top-performing stores hitting 3.5% to 5%. This success can be attributed to well-established consumer behaviors and the use of advanced AI for personalization.
When breaking it down by device, desktop conversion rates averaged 4.1%, while mobile lagged behind at approximately 2.0%, even though mobile devices accounted for about 58% of all traffic. Interestingly, one-click payment options have significantly improved mobile conversions, boosting them by 35–50%. In the realm of digital advertising, Google Ads reported an impressive average conversion rate of 7.52% in 2026, reflecting a 6.84% increase from the prior year. Similarly, Facebook lead campaigns achieved an average of 7.72%.
Conversion rates vary widely by industry. For instance:
- Books & Stationery: ~3.2%
- Beauty & Health: ~2.9%
- Grocery & Essentials: ~2.8%
- Electronics: ~1.4%
- Home Furniture: ~1.5%
- Fashion: ~1.7%
AI tools play a significant role in improving these numbers. For example, AI-powered product recommendations can boost conversions by 15–25%, while personalized call-to-action buttons have been shown to convert up to 202% better than generic ones. However, privacy changes like the deprecation of third-party cookies and iOS updates have introduced challenges for retargeting efforts.
These benchmarks provide a roadmap for refining strategies at every stage of the sales funnel.
Canada
Although the U.S. leads in conversion performance, Canada’s e-commerce sector benefits from its strong digital infrastructure. With 95.1% internet penetration and 42.4 million cellular connections, Canada boasts a connectivity rate exceeding 100%. Over the year leading up to late 2025, median mobile download speeds rose by 15.2% to 86.23 Mbps, while fixed internet speeds jumped by 25.1% to 235.44 Mbps.
Despite these connectivity strengths, Canadian conversion rates tend to trail behind U.S. benchmarks. This is partly due to its smaller market size and differing consumer habits. Similar to trends in the U.S., desktop conversions in Canada significantly outperform mobile, largely because smaller screens often present usability challenges.
These insights highlight the importance of tailoring strategies to regional and device-specific behaviors for better performance.
European Conversion Rates
United Kingdom and Western Europe
E-commerce performance across Europe varies significantly, influenced by factors like logistics, payment systems, and consumer trust. Western Europe consistently outpaces Southern and Eastern Europe, with the United Kingdom leading conversion rates, which range between 2.1% and 4.1%. However, the UK saw a drop in performance, declining from 3.1% in Q4 2024 to 2.1% by Q3 2025.
Germany maintains rates between 1.9% and 2.22%, supported by widespread credit card usage and a strong logistics network. The Netherlands improved its rates, growing from 1.6% to 2.1% with an average of 1.78%. Meanwhile, Switzerland recorded one of the highest conversion rates in the region at 2.5% in Q3 2025, though this was a drop from its peak of 3.5% in Q1 2025.
France, on the other hand, struggles with rates between 1.1% and 1.3%, reflecting challenges in logistics and consumer confidence. When broken down by industry, the variation becomes even more pronounced: Food & Beverage leads with rates between 4.6% and 7.06%, while Fashion & Apparel achieves 1.5% to 2.7%, and Electronics sits lower at 1.2% to 1.9%.
"A ‘good’ conversion rate is relative, and businesses must benchmark their performance against the specific averages for their target country and industry rather than a single global standard." – Landmark Global
Desktop users achieve higher conversion rates, averaging 3.64%–4.1%, compared to mobile’s 2.0%, even though smartphones account for over 75% of total visits. The growing adoption of Buy Now, Pay Later (BNPL) options has helped narrow this gap, boosting conversion rates by 20–30% for purchases over $100.
Eastern Europe, however, lags behind, reflecting differences in market maturity and infrastructure.
Eastern Europe
Eastern European markets show lower conversion rates compared to their Western neighbors, with the broader EMEA region averaging just 1.1%. This is far below Great Britain’s 3.4%. Southern and Eastern European countries face ongoing hurdles with logistics and payment systems. For example, Italy reports a rate of 0.99%, while Greece performs slightly better at 1.44%.
"Europe trails the US, with greater performance variability." – NOIR & BLANCO
Despite these challenges, there are signs of potential growth. Financial advancements in countries like Romania and Bulgaria suggest future improvements. To succeed in these markets, businesses must focus on localized payment methods, clear delivery options, and trust-building measures like customer reviews. These steps can help address longer decision-making processes and reduce cart abandonment rates, paving the way for steady progress.
Asia-Pacific Conversion Rates
China and India
The Asia-Pacific region lags behind Western markets in conversion rates, averaging around 2.76%, even though it leads global e-commerce growth.
In China, the conversion rate is 2.5%, largely influenced by livestream shopping and AI-driven recommendations that encourage quick purchases. Social commerce is another major factor, as more consumers rely on social media to research brands and products before making a purchase.
India, on the other hand, faces more hurdles, with conversion rates ranging from 1.2% to 2.0%, averaging about 1.5%. Trust issues and the widespread preference for Cash on Delivery (COD) weigh down performance. Conversion rates also vary significantly by industry: Grocery & Essentials leads at 2.2%, followed by Beauty & Health at 2.0%, while Fashion and Electronics lag behind at 1.2% and 1.0%, respectively. "Quick commerce", or fast delivery, has become a key factor, particularly in the grocery sector.
"APAC resists generalization, demands localization." – Checkout.com
Mobile traffic dominates the region, accounting for 68% of visits, but mobile web still struggles with a high cart abandonment rate of 80.56%. Interestingly, mobile apps perform much better, converting at three times the rate of mobile web. Over 80% of APAC consumers have made purchases through mobile apps.
Other APAC markets also display distinct conversion trends.
Expanding to Other APAC Markets
In Australia, the conversion rate sits at 1.78%. Here, 21% of consumers prefer Buy Now, Pay Later (BNPL) options, particularly for expensive purchases.
Japan stands out for its market maturity, aligning its benchmarks with the region’s growing shift toward mobile-first commerce by 2026. Meanwhile, markets in Southeast Asia share similarities with India, where building trust and offering localized payment methods are crucial to improving conversion rates.
When compared globally, APAC’s average conversion rate of 2.76% falls short of EMEA’s 4.11% and the Americas’ 3.76%. However, APAC desktop conversion rates average 4.8%, significantly higher than the 2.9% for mobile web. Adding even one localized payment option beyond credit cards can improve conversion rates by 7.4%, highlighting the importance of tailoring payment methods to local preferences.
| Country/Region | Avg. Conversion Rate | Key Driver/Barrier |
|---|---|---|
| China | 2.5% | Livestream shopping and AI-powered recommendations |
| India | 1.5% | Trust issues and COD preferences |
| Australia | 1.78% | Strong BNPL adoption (21% preference) |
| APAC Average | 2.76% | High mobile traffic (68%) but high abandonment rates |
sbb-itb-2ec70df
Emerging Markets and Global Comparisons
Latin America
Latin America is keeping pace with global digital commerce trends, boasting a conversion rate of 3.76% across its diverse markets.
In Brazil, tools like Pix dominate, accounting for 58% of the market. Additionally, Buy Now, Pay Later (BNPL) options are gaining traction, catering to price-conscious consumers. Mobile devices drive 62% of site visits, but challenges remain – like the 72.6% cart abandonment rate – highlighting the need for smoother payment processes and better user experiences.
The table below offers a closer look at how key metrics stack up across different regions, shedding light on global performance differences.
Global Comparison Table
Here’s how regions compare in terms of mobile traffic, conversion rates, and checkout performance:
| Region | Avg. Conversion Rate | Mobile Traffic Share | Cart Abandonment Rate | Key Success Factor |
|---|---|---|---|---|
| EMEA | 4.11% | 58% | 78.38% | Advanced infrastructure and high trust |
| Americas | 3.76% | 62% | 72.6% | Localized payments like Pix in Brazil |
| Asia-Pacific | 2.76% | 68% | 80.56% | Mobile-first focus despite higher friction |
| Global Average | 3.3% (2026 proj.) | 70%+ | 60–75% | – |
Key Insights
Looking ahead, forecasts suggest the global average conversion rate will settle between 2.95% and 3.65% by 2026. However, top-performing stores could hit conversion rates as high as 3.5% to 5%. This growing disparity underscores the importance of AI-driven personalization and hyper-localized strategies, like tailored payment solutions, in helping emerging markets achieve standout results.
What Is Conversion Rate? Digital Marketing Metric Definitions
Conclusion and Next Steps
The 2026 benchmarks deliver a striking insight: only 2.35% of visitors convert, leaving a staggering 97 out of 100 inactive. Meanwhile, the top 10% of performers are hitting conversion rates of 11.45% or higher – nearly five times the average. This isn’t a matter of chance; it’s the result of carefully executed strategies, precise adjustments, and a relentless focus on removing obstacles throughout the customer journey.
To get started, analyze your data by device, channel, and visitor type to pinpoint where performance is lagging. Next, calculate your break-even conversion rate using this formula: CAC ÷ (AOV × Gross Margin). This helps you figure out the profitability threshold you need to hit. From there, tackle the low-hanging fruit:
- Improve page load times to under 2 seconds.
- Simplify forms by reducing the number of fields.
- Enable one-click checkout for a smoother experience.
Websites that meet these benchmarks often see conversion rates jump by 50–80%, with mobile conversions improving by 35–50%. These quick fixes lay the groundwork for deeper, region-specific optimizations.
If you’re targeting India, focus on fast delivery and Cash on Delivery options. In Europe, address language barriers with localized content. For the US, invest in advanced personalization tools that have been proven to drive higher conversions.
Once these basics are in place, it’s time to tackle more persistent issues in your funnel. This is where specialized strategies come into play. For example, Growth-onomics uses tools like customer journey mapping, UX optimization, and data analytics to identify weak points and craft high-impact, market-specific solutions. Whether it’s bridging the mobile conversion gap or implementing multi-touch attribution models, these tailored approaches – grounded in first-party data – help businesses move from average to top-tier performance.
As Imrana Essa from Usermaven aptly states:
If 2025 was the year of AI automation in Google Ads, 2026 is the year of precision.
The benchmarks are clear. The question is: where do you stand?
FAQs
How can businesses improve their conversion rates in different regions?
If you want to boost conversion rates in different regions, tailoring your approach to match local preferences and behaviors is key. One of the first steps is to fine-tune the user experience. This could mean adjusting your website’s design, language, and content to align with the cultural expectations of your audience. When your site feels familiar and relevant, it builds trust and makes the customer journey smoother.
Another effective approach is to use regional performance benchmarks to pinpoint areas that need attention. For example, you might focus on reducing cart abandonment or making product details clearer. Some practical strategies include:
- Running A/B tests to see what resonates best
- Improving site speed to reduce load times
- Streamlining the checkout process to minimize steps
- Ensuring your site is mobile-friendly for users on the go
In regions where trust might be a hurdle, adding features like local reviews, social proof, and clear, transparent policies can go a long way in reassuring potential customers.
By keeping a close eye on regional trends and tweaking your strategies as needed, you can deliver a more personalized experience. This not only increases engagement but also helps drive better conversion rates across all markets.
How does mobile traffic affect conversion rates worldwide?
Mobile traffic has become a driving force in shaping global conversion rates, with smartphones now accounting for a substantial share of website visits. By 2025, mobile devices were responsible for about 64% of global internet traffic, underlining the shift toward mobile-first browsing. Despite this, mobile conversion rates often lag behind those of desktops. This gap is largely due to challenges like slower page load times and less user-friendly mobile experiences.
To bridge this divide, businesses should make mobile optimization a top priority. This means focusing on faster page speeds, streamlining checkout processes, and ensuring websites are fully responsive. As mobile traffic continues to dominate, improving these areas can help boost conversions and maintain a competitive edge in today’s fast-paced digital world.
How does AI-driven personalization improve conversion rates?
AI-powered personalization can significantly boost conversion rates by crafting experiences tailored to each customer’s preferences and behavior. By tapping into real-time data, businesses can deliver customized content, precise product recommendations, and messaging that genuinely connects with users. This makes the customer journey smoother and more engaging, clearing hurdles that might otherwise stand in the way of a purchase.
What’s more, AI ensures a consistent experience across different channels and devices, tying everything together seamlessly. Companies using AI for this level of personalization often report higher engagement, larger average order sizes, and stronger overall results. It’s clear that in 2026, leveraging AI for personalization will be key to driving growth and staying ahead in an increasingly competitive market.