
Real-time dashboards simplify managing marketing campaigns across platforms like Google Ads, Facebook, email, and direct mail. Instead of relying on outdated, manual reports, these dashboards provide continuously updated insights by pulling data from multiple sources every 15 minutes or faster. This lets you monitor performance, adjust budgets, and optimize campaigns on the fly.
Key Benefits:
- Live Updates: Data refreshes automatically, eliminating manual exports.
- Multi-Channel Integration: Combines metrics from platforms like Google Ads, Facebook, and CRMs into one view.
- Actionable Insights: Pause underperforming ads, reallocate budgets, and improve ROI in real time.
Features:
- Interactive Visuals: Drill down into metrics like ROI, cost per acquisition, and audience performance.
- Revenue Attribution: Track which channels drive sales and compare attribution models.
- Custom Alerts: Get notified about performance changes instantly.
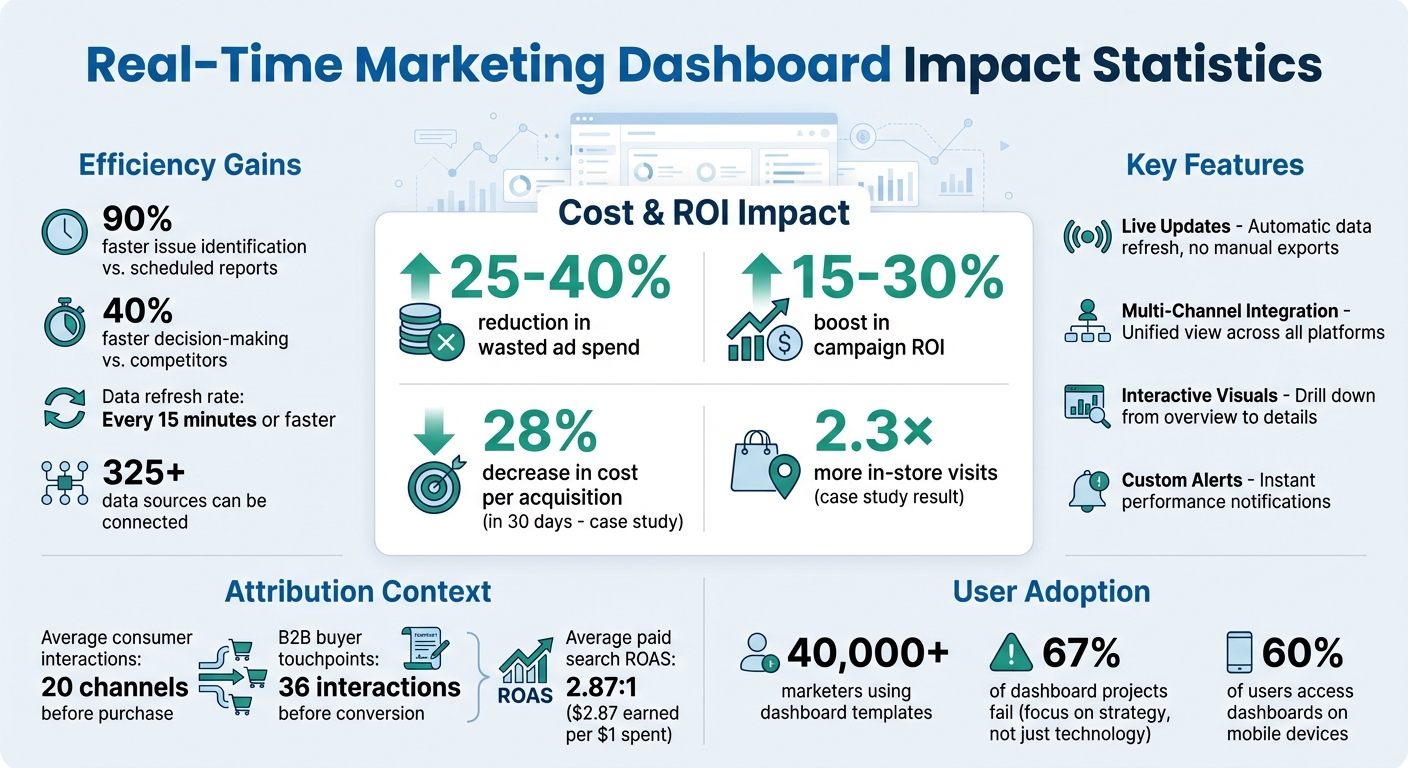
These tools help cut wasted ad spend by up to 40% and boost ROI by 15-30%, making marketing decisions faster and more effective. Whether you’re part of an in-house team or working with an agency, real-time dashboards ensure everyone operates with accurate, up-to-date data.
Real-Time Dashboard Impact: Key Performance Metrics and ROI Statistics
How to Create the Best Marketing Dashboards That ACTUALLY Make Sense
What Are Real-Time Dashboards?
A real-time dashboard pulls data from platforms like Facebook Ads, Google Analytics, and email tools, presenting it in a single, constantly updated view.
Unlike traditional reporting – which relies on manual exports and static reports that quickly become outdated – real-time dashboards connect directly to platforms using APIs. This allows them to sync data every 15 minutes or even faster, keeping your insights up to date.
"Running a campaign without a dashboard is like flying blind. You might know the destination, but you’re missing the instruments that tell you where you’re headed – or if you’re off course."
Core Features and Capabilities
Real-time dashboards stand out due to their live updates, multi-channel integration, and interactive features. With live updates, metrics refresh automatically, removing the need for manual exports or waiting for overnight data processing. Multi-channel integration combines data from various sources – email providers, programmatic ad platforms, Google Analytics, and CRMs – into one unified view.
The interactive functionality is what truly sets these dashboards apart. They let you start with a broad overview, like total spend or ROI across all channels, and then quickly drill down to specific details. For example, you can identify which creative is driving the most conversions or analyze audience segments with the lowest cost per acquisition. Filters let you refine data by date range, creative version, channel, or audience, offering precise insights without needing to rebuild reports.
Visual clarity is another hallmark of modern dashboards. Charts and graphs make it easy to spot trends and performance shifts at a glance. For instance, reallocating ad spend mid-campaign becomes simpler when you can see how it directly impacts your cost per acquisition.
These capabilities are powered by robust data integration, ensuring the insights are accurate and actionable.
How Data Integration Works
Dashboards achieve this seamless functionality by connecting directly to marketing platforms through APIs and automated connectors. When you link tools like Google Ads, Facebook Business Manager, email platforms, and analytics software, the dashboard pulls key metrics – such as spend, clicks, impressions, and conversions – and organizes them into a unified structure.
This process involves automated mapping, which standardizes metric names, currencies, and time zones. For example, "conversions" from one platform and "purchases" from another are merged into a single, consistent metric. Date formatting and data normalization are also handled automatically, reducing the chance of human error from manual data handling.
Data integration typically follows three steps: connect, map, and blend. First, platforms are securely authenticated via API connections. Next, the dashboard maps each platform’s metrics to standardized fields. Finally, it blends data from all sources into a single dataset, ready for visualizations.
This streamlined process allows marketers to make quick, data-driven decisions. With modern tools, dashboards can connect to over 325 data sources and refresh as often as every 15 minutes. Some advanced setups even integrate with AI tools like ChatGPT, enabling users to query multi-channel performance using plain English questions.
Key Metrics Tracked in Real-Time Dashboards
Real-time dashboards are designed to make marketing decisions faster and smarter by focusing on key metrics divided into three main categories: visibility, engagement, and conversion. This structure helps marketers quickly assess how their campaigns are performing.
Visibility metrics focus on how often content is seen. Engagement metrics – like likes, shares, comments, and video views – highlight how audiences are interacting with content. Finally, conversion metrics measure the ultimate impact, such as total conversions, revenue, and cost per conversion.
By pulling data from platforms like GA4, Facebook, LinkedIn, and TikTok, these dashboards standardize metrics, allowing for side-by-side comparisons. For instance, you can instantly determine if Facebook’s cost per conversion outperforms LinkedIn’s, enabling real-time budget adjustments.
"Waiting for daily or weekly reports to understand campaign performance is like driving while looking in the rearview mirror." – Gideon Banks, Founder, LDOO
More than 40,000 marketers have already leveraged dashboard templates to track multi-channel performance. The benefits are clear: real-time monitoring can cut wasted ad spend by 25-40%, boost campaign ROI by 15-30%, and reduce the time needed to identify issues by a staggering 90% compared to relying on scheduled reports.
Performance Metrics by Channel
Each marketing channel brings its own set of metrics, and dashboards make it easy to compare them. For example:
- Visibility metrics include impressions (how often your ad is shown), reach (unique users who saw it), and click-through rate (CTR).
- Engagement metrics measure audience reactions, such as likes, shares, comments, bounce rates, and session durations. These vary by platform – video views are critical on TikTok and YouTube, while shares and comments carry more weight on Facebook and LinkedIn.
Dashboards often use visual aids like color coding and traffic-light indicators to highlight performance issues at a glance. The "5-second rule" ensures the most critical insights are immediately visible within five seconds of opening the dashboard. Interactive filters let users segment data by campaign, channel, audience, content type, or date range, moving seamlessly from high-level overviews to detailed insights.
A shift toward actionable metrics over vanity metrics is essential. For example, tracking real-time cost-per-acquisition (CPA) against your target provides more meaningful insights than just monitoring total impressions.
Revenue Attribution and ROI Tracking
Revenue attribution answers a vital question: which channels are driving sales? Dashboards track return on ad spend (ROAS) to measure how much revenue is generated for each dollar spent. For example, the average ROAS for paid search ads is 2.87:1, meaning businesses earn $2.87 for every $1 spent. Dashboards allow you to compare ROAS across platforms in real time, revealing which channels deliver the best returns.
Metrics like cost-per-conversion (CPCV) dive deeper, ensuring revenue covers all campaign expenses, from impressions to clicks and video views. Dashboards also account for assisted conversions – channels that contribute to awareness even without generating the final click. This is critical since consumers typically interact with 20 channels before making a purchase, and in B2B, the average buyer encounters 36 touchpoints before converting.
To improve accuracy, dashboards let you compare attribution models side-by-side. For instance:
- Linear attribution evenly splits credit across all touchpoints.
- Time-decay models assign more weight to interactions closer to conversion.
- Position-based models emphasize the first and last touches.
- Data-driven models rely on algorithms to distribute credit based on actual impact.
This side-by-side view helps uncover biases and provides a clearer picture of campaign performance.
"You’ll first need to extract all the data from each of your customer touchpoints, clean it up, unify it, and build an account-based data model containing a timeline of every touch of every account." – Steffen Hedebrandt, Co-founder, Dreamdata
Modern dashboards also track customer acquisition cost (CAC) to ensure the cost of acquiring new customers decreases as campaigns mature. By combining CAC with average customer value (ACV) – the revenue generated within a specific timeframe – you can pinpoint which channels are not only driving conversions but doing so profitably. The key is analyzing these metrics as part of a funnel: start with broad indicators like total revenue and ad spend, then drill down to specifics like conversion rates by channel.
These insights lay the groundwork for refining how dashboards are selected and set up.
sbb-itb-2ec70df
Benefits of Real-Time Dashboards for Marketing Teams
Real-time dashboards cut out the lag of traditional reporting, giving marketing teams instant access to multi-channel insights. Instead of waiting days – or even weeks – for manual reports, teams can immediately see what’s working and what’s not across platforms like email, mobile, programmatic, and social media.
And the numbers don’t lie. Take July 2025, for example: a regional beauty retailer used a Data-Dynamix dashboard to uncover that specific email and mobile sequences drove 2.3× more in-store visits. By reallocating just 20% of their display budget, they slashed their cost per acquisition by 28% in just 30 days. These kinds of results show how live insights can lead to quick, impactful campaign adjustments.
"Running a campaign without a dashboard is like flying blind. You might know the destination, but you’re missing the instruments that tell you where you’re headed – or if you’re off course."
– Justin Warthen
Dashboards also go beyond speed. They create a clear connection between online engagement and offline actions. Marketers can zoom out for a high-level view or dive deep into tactical details, pinpointing which audience segments or creative choices are delivering results.
Faster Decision-Making with Live Data
Having live data at your fingertips means you can optimize campaigns on the fly. If a specific creative or channel isn’t performing, budgets can be shifted instantly. Filters – like date, creative, or audience – make diagnosing issues quick and easy. Plus, an integrated optimization log keeps track of all tests and adjustments, so everyone on the team understands the reasoning behind changes.
Better Team Collaboration and Transparency
Real-time data doesn’t just speed up decisions – it also makes teamwork smoother. By consolidating all key metrics into a single source, teams avoid the hassle of reconciling conflicting data and can focus on acting on insights. Clear visuals make performance data easy to understand, ensuring everyone is on the same page. For marketing agencies, white-labeled dashboards provide clean, professional visuals that reinforce client trust by showcasing real-time results and driving home the value of data-backed strategies.
"Dashboards surface data. Teams translate it into action."
– Justin Warthen, Data-Dynamix
Custom permissions allow teams to tailor views for internal users and external clients while keeping sensitive information secure. Regularly reviewing dashboard insights ensures that teams act quickly – whether it’s to capitalize on new opportunities or address emerging challenges.
How to Choose and Set Up a Real-Time Dashboard
When selecting a real-time dashboard, focus on one that directly supports your team’s key decision-making processes. This step is crucial since 67% of dashboard projects fail because teams focus more on technology than on the strategic questions they need to answer. Before diving into platform options, take a moment to map out your team’s daily decisions and identify the metrics that directly influence those actions.
Dashboard prices vary widely. For example, Looker Studio is free, while Power BI starts at $10/month, Tableau costs $70/user/month, Sisense is $1,500/month, and Looker tops the list at $4,000/month.
Evaluating Dashboard Features
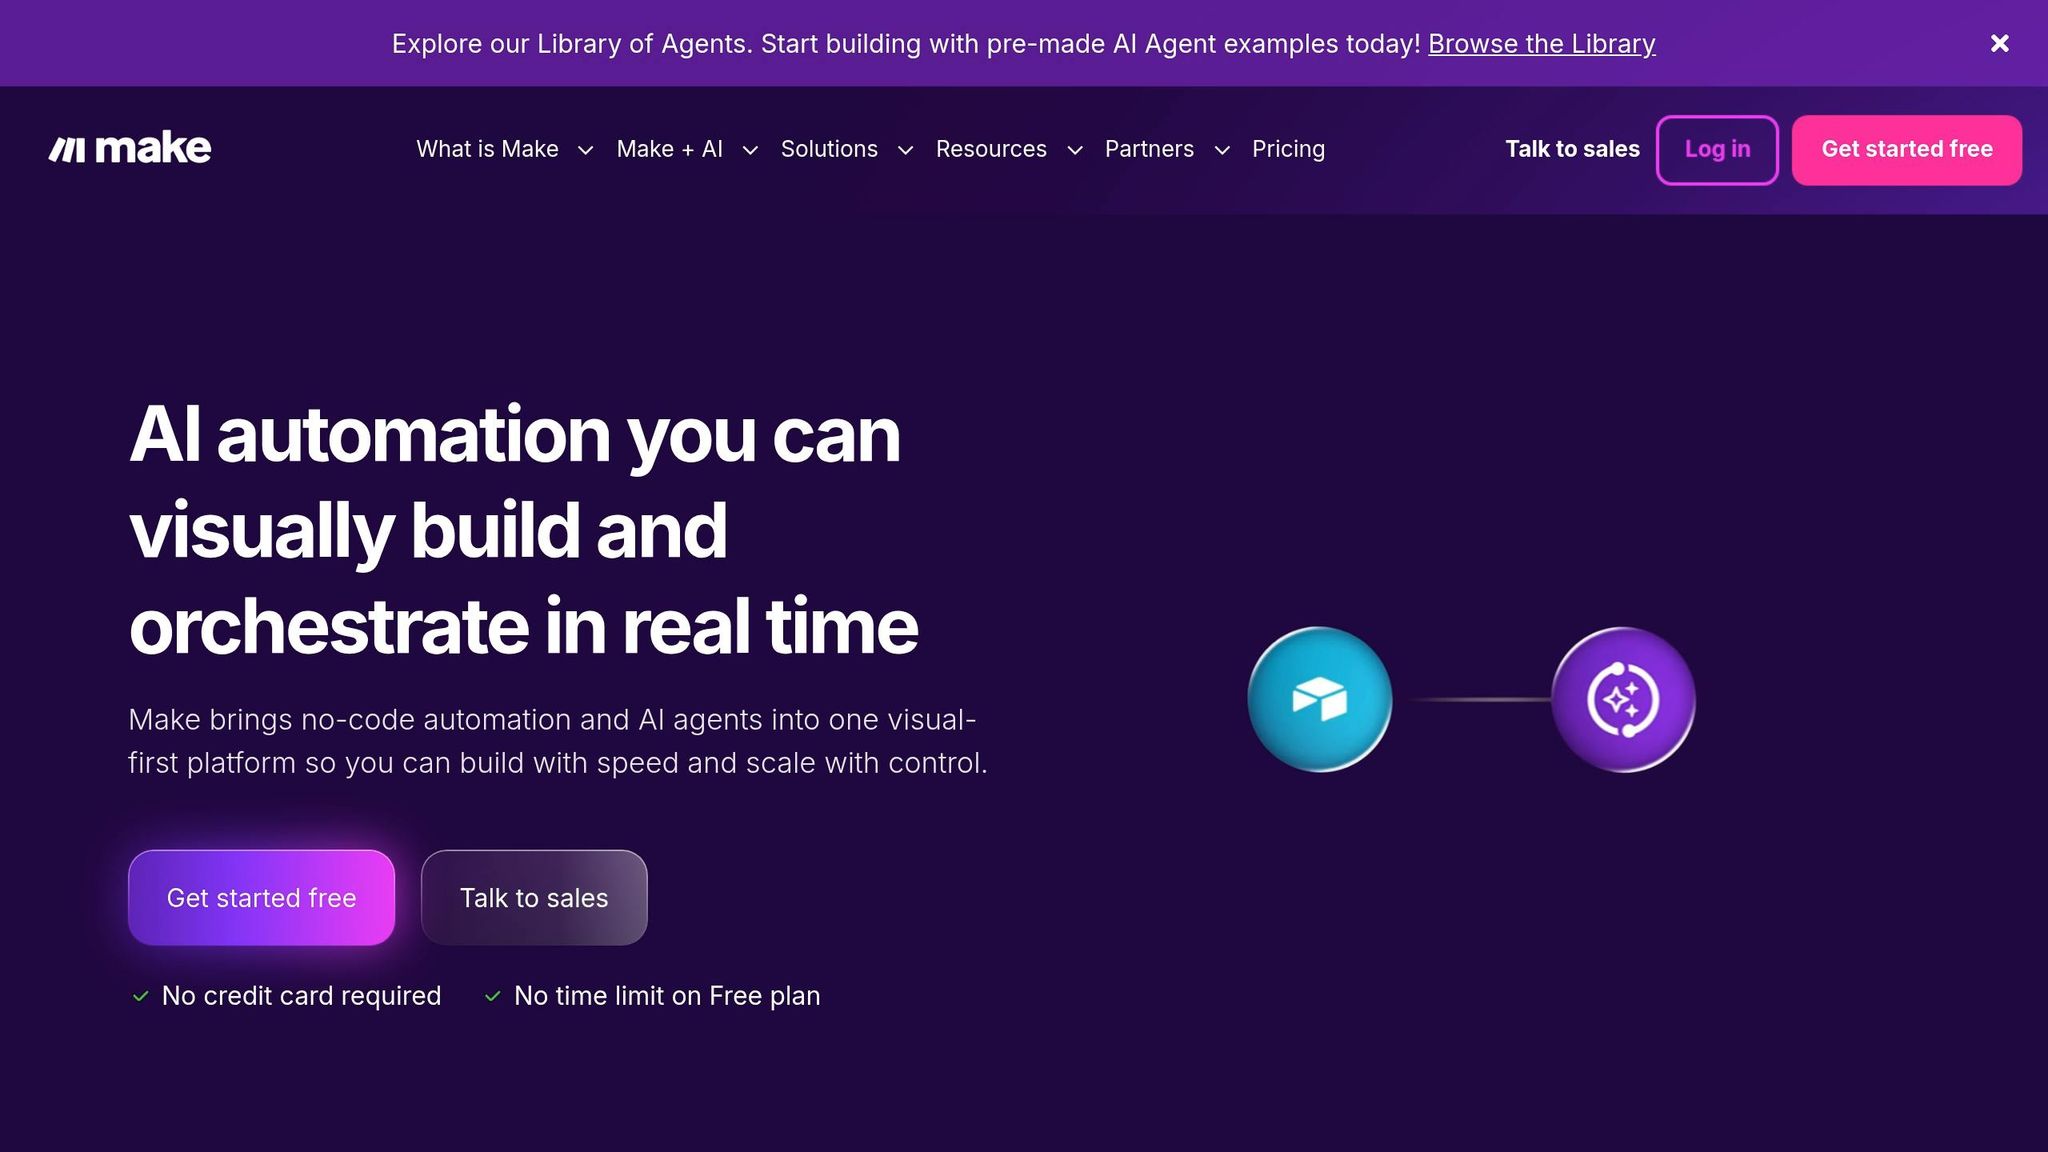
Start by assessing the integration capabilities of the platform. Look for tools that offer no-code integrations with services like Zapier or Make, built-in connectors for key marketing platforms (e.g., Google Ads, CRMs, email tools), and robust APIs for custom data sources. Quick data updates are critical, so ensure the dashboard supports API polling or webhooks for real-time information.
With 60% of users accessing dashboards on mobile devices, a mobile-first design is non-negotiable. Your platform should be responsive and easy to use on smartphones and tablets. Also, consider whether the tool can handle scalability and maintain reliability – especially during high-traffic campaigns. Aim for platforms with 99.9% uptime.
Actionable alerts are another must-have. Features like threshold-based notifications (e.g., when performance drops by a certain percentage) and automated anomaly detection using machine learning can help your team catch issues without constant monitoring. The ability to drill down from a high-level overview into specific details – like how a particular ad creative is performing – is what separates truly effective dashboards from ones that are merely decorative.
"A beautiful chart that doesn’t inform decisions is just decoration." – InfluenceFlow
Once you’ve identified a platform with the right features, it’s time to focus on implementation.
Setup Best Practices
Start by defining KPIs that align with your business objectives. Structure these KPIs into tiers:
- Outcome KPIs (e.g., Revenue, LTV) for executives.
- Performance KPIs (e.g., Conversion Rate, Retention) for managers.
- Activity KPIs (e.g., Clicks, Impressions) for day-to-day operations.
Roll out your dashboard in phases. Spend the first four weeks connecting your data sources before introducing advanced features like predictive analytics. When designing the layout, apply the "5-Second Rule" – key insights and performance indicators should be clear within five seconds. Place your most critical KPI in the top-left corner, where viewers naturally look first.
Document every step of the setup process. This includes configuration details, UTM parameters, and data tagging, ensuring consistency across campaigns and smooth transitions for new team members. A shared data dictionary can help standardize definitions for metrics like "lead" or "conversion" across all channels.
Set up automated alerts for critical events, such as sudden traffic surges or drops in conversion rates, so your team can respond immediately. Enable cross-filtering, allowing users to click on a specific channel (e.g., "Email") and instantly see related data elsewhere. Use color wisely: red for underperforming metrics, green for those exceeding targets, and add shapes or text labels to accommodate users with color blindness.
To avoid overwhelming users, limit each screen to six to eight visuals. Train your team on how to interpret and use the dashboard effectively, and establish regular verification protocols to ensure the data remains accurate. Organizations with well-implemented dashboards make decisions 40% faster than their competitors – but only if the setup is done correctly.
Conclusion
Real-time dashboards bring precision and efficiency to multi-channel marketing. Instead of waiting days or weeks for post-campaign reports, you gain instant visibility into what’s effective and what’s wasting your budget. This allows for mid-campaign adjustments that protect your resources and boost ROI – something retrospective analysis just can’t accomplish.
But it’s not just about viewing live metrics; it’s about turning them into actionable steps. By pinpointing high-performing channel combinations, you can make informed shifts in your campaigns rather than relying on guesswork. The ability to quickly transition from an overview of total spend to specific tactical details means you can catch underperforming creatives or channels and make adjustments while your campaign is still running.
These real-time improvements lead to stronger strategic alignment and quicker campaign pivots. For marketing teams juggling multiple channels – whether it’s email, social media, programmatic ads, or even offline efforts – a well-designed real-time dashboard empowers faster decisions, better teamwork, and clear ROI that earns trust from clients and stakeholders.
FAQs
How do real-time dashboards keep data accurate across channels?
Real-time dashboards keep your data accurate by constantly pulling updates from platforms like Google Ads, Meta, and email tools. This way, you avoid data silos and maintain consistent metrics across the board. Thanks to real-time refresh features, visuals and metrics update automatically as new data comes in, allowing marketers to spot and fix errors quickly. Tools like alerts and interactive visuals add another layer of reliability, helping you make smarter decisions with confidence.
What’s the best way to set up attribution for multi-touch campaigns?
To effectively attribute credit in multi-touch campaigns, it’s smart to use models that recognize all the touchpoints in a customer’s journey. Options like linear, time decay, or position-based models work well for this. Start by gathering data from sources such as website analytics, CRMs, and advertising platforms. Tools like UTM parameters or API integrations can help streamline this process. Once the data is collected, dashboards can visualize it, making it easier to fine-tune strategies and allocate budgets where they’ll have the most impact.
Which alerts should I enable to prevent wasted ad spend?
To keep your ad spend in check, set up real-time alerts for key changes, like sudden spikes in CPC, drops in conversions, high CPAs, or ads that aren’t performing well. These alerts let you respond quickly – whether that means pausing a campaign or making adjustments. It’s also smart to enable alerts for budget overruns or any unusual activity. This way, you can avoid unnecessary expenses and take advantage of opportunities as they arise.