

Most ad reports overestimate performance by 20-40%. That’s because they often credit ads for sales that would have happened anyway. Without proper testing, businesses waste 23% of their marketing budget on campaigns that don’t drive growth. Incrementality reporting fixes this by answering one critical question: “What would have happened if we didn’t run that ad?”
This approach uses controlled experiments to measure the true impact of ads, helping you make smarter budget decisions. By reallocating spend based on incrementality insights, companies typically see a 15-40% improvement in return on ad spend (ROAS). Here’s how you can implement it:
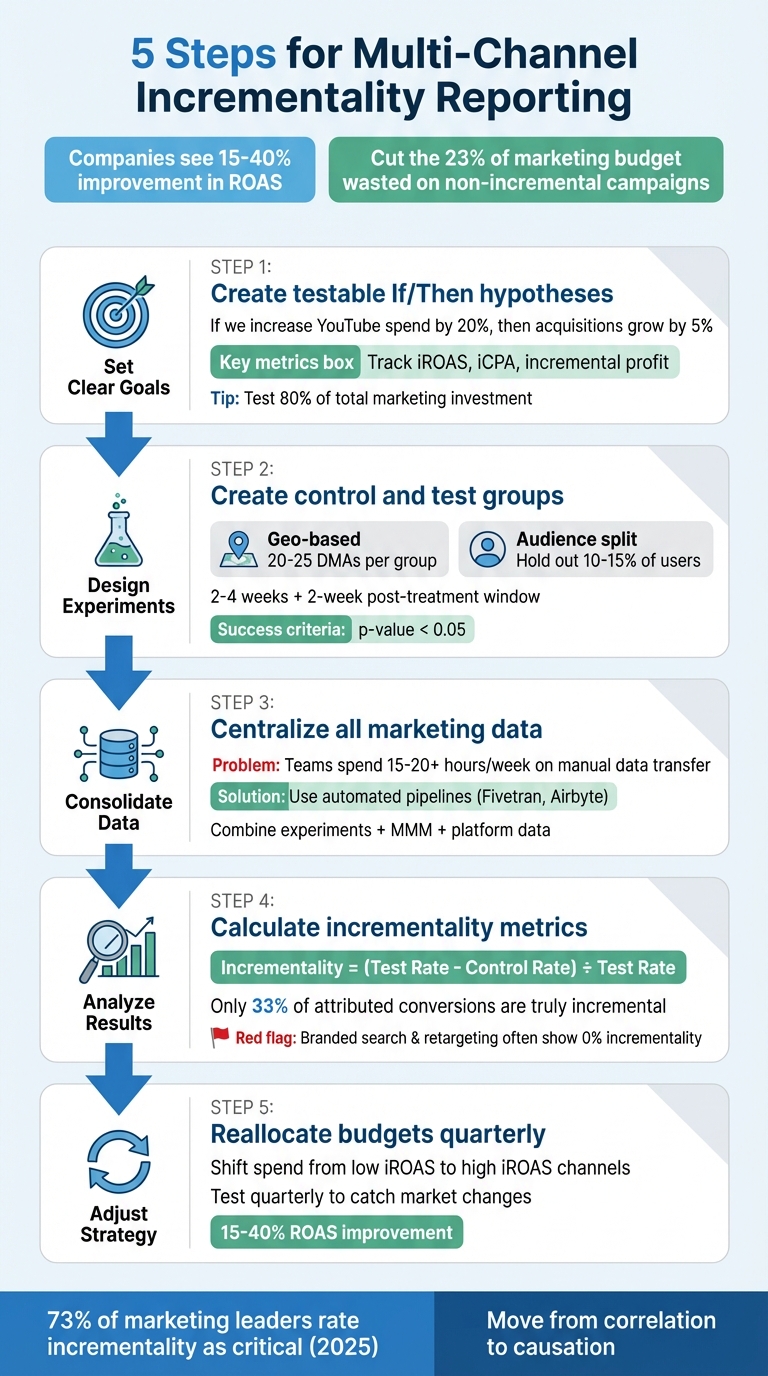
- Set Clear Goals: Use testable hypotheses like, “If we increase YouTube spend by 20%, then customer acquisitions will grow by 5%.”
- Design Experiments: Split audiences or regions into test and control groups to isolate ad impact.
- Consolidate Data: Centralize marketing data in one place for accurate analysis.
- Analyze Results: Calculate metrics like incremental ROAS (iROAS) to identify underperforming channels.
- Adjust Strategy: Shift budgets to high-performing channels and refine your approach quarterly.
Key takeaway: Incrementality testing helps cut waste, improve ROI, and adapt to privacy changes – making it critical for modern marketing success.
5-Step Multi-Channel Incrementality Reporting Framework
Marketing Measurement for Beginners | Part 3 – Incrementality & GeoLift Testing
sbb-itb-2ec70df
Step 1: Set Your Goals and Choose Channels
Start by creating clear, testable hypotheses using "If/Then" statements. Incrementality tests require specific goals – not vague aspirations like "improve marketing performance." For example: "If we increase YouTube spend by 20% in Test Region A, then we will see a 5% lift in net-new customer acquisitions compared to Control Region B." This approach sets a clear definition of success before you even begin testing.
Your main objective should be to isolate causality – determining which conversions are truly driven by your ads versus those that would have happened naturally. Many brands discover that channels like branded search or retargeting often claim credit for conversions that occur organically. As Clay Cohen, VP of Marketing at Measured, explains:
"Only incrementality can reveal which media investments contribute to business metrics and by how much. Measuring for incrementality identifies where to eliminate waste and surfaces opportunities to scale".
Once your hypotheses are in place, the next step is to identify the right metrics.
Choose the Right Success Metrics
Traditional metrics like ROAS and CPA can be misleading because they include conversions that might have occurred without your ads. Instead, focus on incremental metrics that measure the additional impact your marketing creates. The three key metrics to track are:
- Incremental ROAS (iROAS): Measures revenue generated solely by your ads relative to ad spend.
- Incremental CPA (iCPA): Captures the cost of acquiring customers who genuinely needed your ad to convert.
- Incremental profit: Reflects the actual bottom-line impact of your campaigns.
For budget discussions with your CFO, iROAS is particularly helpful as it directly ties ad spend to growth. Additionally, monitoring marginal ROAS (mROAS) – the return on your last dollar spent – can help identify when a channel has reached diminishing returns and needs to be scaled back.
Select Channels to Test
When choosing channels to test, prioritize based on factors like spend, performance uncertainty, and the potential to reallocate budgets. Focus on channels where results are often debated. As Feliks Malts, Principal Solutions Consultant at Haus, advises:
"Start testing with your most debated or uncertain channels to prove immediate value. When incrementality testing resolves longstanding disagreements about channel performance, both teams see its worth".
Begin with a major channel – such as Meta, Google Ads, or YouTube – and expand from there. Geo experiments work well for high-spend digital channels or offline media like TV and out-of-home advertising. For retargeting and email campaigns, audience segment tests are more effective. For example, Newton Baby’s CMO, Aaron Zagha, found that a large portion of their ad spend wasn’t incremental, allowing them to reallocate budgets and dramatically improve ROI. Similarly, fashion brand Seidensticker used incrementality testing to achieve an 11.5% increase in revenue while lowering ad spend by 11.7%, resulting in a 19.3% boost in iROAS.
Testing should cover at least 80% of your total marketing investments, including during peak and seasonal periods, to paint a complete picture of what’s working. Research indicates that over 40% of digital ad spend is wasted on inefficient strategies, meaning even your most trusted channels might benefit from testing. Setting clear goals and carefully choosing channels sets the stage for a thorough analysis in the next steps.
Step 2: Design and Run Your Experiments
After setting your goals and picking the right channels, the next step is to design experiments that can clearly demonstrate cause and effect. The concept is straightforward: create two comparable groups, show ads to one group while withholding them from the other, and then measure the difference.
There are two primary methods for this. Geo-based experiments split entire geographic areas – like designated market areas (DMAs) – into test and control groups. This approach is particularly valuable when privacy rules limit tracking at the user level. On the other hand, audience split tests randomly withhold ads from a segment of eligible users while showing ads to the rest. This method is often seen as the gold standard for clean comparisons, though it has its challenges, such as potential "leakage", where control group members might still encounter your ads through other channels. Both methods aim to isolate the impact of your ads and confirm their incremental value.
Create Control and Test Groups
Randomization is the backbone of any reliable experiment. Your treatment group (those exposed to ads) and your control group (those not exposed) must be as similar as possible, with the only difference being the presence of ads. For geo-based experiments, aim for at least 20–25 DMAs in each group to ensure statistical significance. For audience split tests, holding out 10–15% of users usually strikes a good balance between preserving revenue and maintaining statistical power.
You can also use synthetic controls, which involve blending untreated regions that historically align with the performance of your test region. This method provides a more accurate comparison than simply pairing regions. Another option is ghost bidding in programmatic ad environments. Here, you log a control event at the moment an ad would have been served, avoiding additional costs.
To get meaningful results, run your tests for 2–4 weeks to cover a full buying cycle. Be sure to include a two-week post-treatment window to capture delayed conversions, which can be especially relevant for platforms like YouTube, where incremental ROAS can improve by up to 79%.
Maintain Data Quality
Keeping your data clean is critical. Avoid introducing new variables during the experiment – this means no launching new campaigns, changing creatives, or running regional promotions. As Chandler Dutton, Measurement Strategy Lead at Haus, puts it:
"If you’re increasing spend on Channel A and Channel B… a well-designed experiment isolates the effect… giving you ‘ground truth’ you can actually trust".
Watch out for budget reallocation bias, where ad platforms might shift spending from control regions to test regions, skewing your results. To ensure your findings are credible, pre-register your success criteria – typically a p-value below 0.05 – and set your minimum detectable effect before starting the test. This helps avoid cherry-picking results.
A great example of this approach comes from Soft Surroundings, a women’s clothing retailer. In August 2025, they ran a retargeting incrementality test led by VP of Solutions Architect Terence Einhorn. The experiment revealed that their incremental cost per acquisition was far above target. As a result, they slashed retargeting spend by 52%, redirected those funds to Facebook prospecting, and saw a 17% month-over-month revenue increase, coupled with a 12% year-over-year sales growth.
Step 3: Gather and Combine Your Data
Once your experiments are underway, the next big task is bringing all your data into one place. Consolidating experimental data into a single source is essential for accurate analysis. On average, marketing teams spend 15–20+ hours each week manually transferring data from various platforms into spreadsheets. Not only is this time-consuming, but it also opens the door to errors that can distort your analysis.
Pull Data from All Sources
The best way to streamline this process is by centralizing all your marketing data into a single data warehouse, like BigQuery or Snowflake. Relying on native dashboards can lead to inflated performance metrics, with reported conversions sometimes exceeding actual sales by over 300%.
To avoid this, use tools like Fivetran or Airbyte to set up automated data pipelines. These tools pull raw data directly from your ad platforms, CRM, and sales systems. Automation not only saves time but also reduces errors, ensuring you’re working with up-to-date data. Once centralized in a warehouse, you can build a transformation layer to standardize your metric definitions, creating a consistent and reliable data flow for analysis.
A strong measurement strategy integrates three key perspectives: causal insights from experiments, macro-level trends from Marketing Mix Modeling (MMM), and granular real-time data from ad platforms. As Terence Einhorn, VP of Solutions Architect at Measured, puts it:
"The most advanced and future-ready approach to media measurement is triangulation, combining MMM-supported incrementality testing within a granular, always-on reporting and optimization framework".
Once your data is consolidated and standardized, the next step is refining your analytical models.
Apply Statistical Methods
With your data unified, you can apply statistical techniques to estimate incrementality with greater accuracy. Use your test results to calibrate MMM models, anchoring historical correlations in real-world causation. Techniques like Adstock transformations account for delayed impacts, while saturation curves help identify diminishing returns. These adjustments shift the focus from simple correlations to a deeper understanding of cause and effect. Brands that reallocate budgets based on these refined insights often achieve a 15–40% boost in overall return on ad spend.
With your data centralized and refined, you’re now ready to dive into analyzing incremental impact in Step 4.
Step 4: Analyze Your Results
Now that your data is centralized and your statistical models are ready, it’s time to identify which channels are actually driving growth. This is where you move past the surface-level reports from platform dashboards and dig into metrics that reveal the real story. The difference between what platforms report and what’s actually happening can be shocking – studies have shown that only about 33% of attributed conversions are genuinely incremental. Let’s break down the key metrics to measure this impact.
Calculate Incrementality Metrics
To determine incrementality, use the formula: (Test Rate – Control Rate) ÷ Test Rate. This calculates the percentage of conversions that were directly caused by your ads. From there, you can measure incremental ROAS (iROAS) by dividing incremental revenue by media spend and incremental CPA (iCPA) by dividing media spend by incremental conversions. These metrics help you understand the actual cost and return of each channel.
Next, compare your iROAS to the platform-reported ROAS to create a correction factor. For example, if your true iROAS is $2.50 but the platform reports $7.50, your correction factor is 0.33. Use this multiplier to adjust future platform data for a more accurate picture of performance between tests.
Identify Underperforming Channels
Once you’ve calculated your metrics, evaluate performance to find channels that aren’t contributing to real growth. Look for channels with low or zero incrementality or an iCPA that exceeds your customer lifetime value. Branded search and retargeting campaigns are often problematic, as they frequently take credit for conversions that would have happened without the ads. For instance, an omnichannel retailer discovered that only 5% of their attributed search revenue was genuinely incremental. By reallocating 40% of that budget to prospecting channels, they achieved a 25% increase in total revenue.
Focus only on statistically significant results, defined as lifts with a p-value below 0.05. Keep an eye out for diminishing returns – when increasing your budget no longer leads to proportional gains, it’s a sign of saturation. To stay ahead, run these tests quarterly, as incrementality can change with platform updates and audience behavior. Each test should last at least two to three weeks, or 1.5 times your typical purchase cycle, to account for delayed conversions.
"Incrementality is the difference between ‘this person saw an ad and bought’ (correlation) and ‘this person bought BECAUSE of the ad’ (causation). The gap between these two numbers is where billions in wasted ad spend hide." – Cresva Team
Step 5: Report and Adjust Your Strategy
Once you’ve analyzed your incremental metrics, the next step is to incorporate those insights into your daily reporting and budgeting. The goal is to transition from occasional testing to an "always-on" approach, where incrementality data continuously guides how you allocate marketing dollars. This involves refining your measurement systems, dynamically shifting budgets, and committing to quarterly testing to adapt to market changes.
Update Your Reporting
Use data from your incrementality tests to fine-tune your measurement models. This means adjusting platform-reported metrics in your Marketing Mix Models (MMM) or attribution dashboards. The result? A hybrid measurement system where incrementality delivers precise causal insights, MMM gives a big-picture view of your channels, and attribution tracks the customer journey in real time. For channels that aren’t tested continuously, develop proxy metrics based on quarterly test results to estimate incrementality between tests. This ensures your daily reports reflect true performance rather than overinflated platform metrics.
Shift Budgets Based on Performance
With refined data, you can make smarter, more agile budget decisions. Reallocate funds from channels with low incrementality to those with higher returns using the Equimarginal Principle – shifting budgets until the marginal returns are balanced. For example, if branded search has an iROAS of 1.1x but prospecting video delivers 6.0x, you might redirect 30% of the branded budget to video instead. Before making large-scale changes, use scenario planning to predict outcomes and test in select regions for eight weeks to validate your strategy before rolling it out nationwide. Brands that realign spending based on incremental lift often see ROAS improvements ranging from 15% to 40%. A quarterly testing schedule is key to catching market saturation and seasonal trends – 80% of senior US marketing analytics professionals report that these insights significantly boost revenue growth.
"Incrementality is the bridge between attribution (what happened) and planning (what to do next)." – Deducive
Partner with Growth-onomics

If managing a continuous incrementality testing program seems daunting, Growth-onomics can help. They specialize in performance marketing and data analytics, offering services like experiment design, data pipeline integration, and actionable budget recommendations (https://growth-onomics.com). Their expertise in customer journey mapping and data-driven strategies can help you establish a quarterly testing rhythm and hybrid measurement system to drive growth. This approach also helps eliminate the 23% of marketing spend that typically goes to non-incremental activities.
Conclusion
Multi-channel incrementality reporting helps marketers cut through inflated platform metrics, focusing instead on genuine growth by directly linking marketing spend to actual sales increases. By following a five-step process – setting clear objectives, designing robust experiments, unifying data, analyzing outcomes, and refining strategies continuously – you can move past surface-level metrics to identify which marketing investments truly drive growth, and which merely claim credit for inevitable sales.
Consider this: brands that skip testing waste an average of 23% of their marketing budgets. On the flip side, reallocating budgets based on incremental lift can improve ROAS by 15% to 40%. As Nick Stoltz, Chief Strategy Officer at Measured, puts it:
"Measurement that is independent of platform bias and future-proof against the whims of a constantly changing industry is critical for today’s marketers".
These numbers highlight the urgency of adopting a causal, data-driven approach. With third-party cookies vanishing and privacy regulations tightening, incrementality has become essential. By 2025, 73% of marketing leaders rated it as critical, a significant jump from 41% in 2023. Unlike pixel-based tracking, incrementality relies on aggregated, group-level data, ensuring its effectiveness despite evolving privacy constraints.
However, implementing this approach isn’t straightforward. It demands expertise in causal inference, advanced analytics, and a disciplined approach to ongoing testing. That’s where Growth-onomics steps in. They specialize in performance marketing and data analytics, helping businesses design experiments, integrate data, and make informed budget decisions. Their services align perfectly with the framework outlined here, offering tailored guidance to establish a sustainable incrementality program (https://growth-onomics.com).
Make incrementality testing a regular practice. Customer preferences, competition, and channel performance are always shifting. Quarterly testing is the key to staying ahead, ensuring your strategies remain sharp and your marketing ROI stays on track.
FAQs
How do I choose between a geo test and an audience holdout test?
Choosing the right testing method depends on what you’re aiming to achieve and the context of your analysis.
Geo tests are designed to measure impact by applying treatments to specific regions and comparing them to areas that remain untreated. These are particularly useful when you want to assess regional effects without needing user-level data.
On the other hand, audience holdout tests work by excluding a portion of your audience to evaluate the lift or impact of a campaign. This method is ideal for assessing the effectiveness of specific campaigns or channels.
In short, geo tests are better suited for analyzing broad, regional impacts, while audience holdout tests provide more targeted insights about specific groups.
How much ad spend and time do I need for a valid incrementality test?
To run a proper incrementality test, you’ll need to invest enough ad spend and allow sufficient time to create meaningful control and treatment groups. Testing periods usually last anywhere from a few weeks to up to 90 days. Budgets often start at $10,000 or more to achieve results that are statistically significant. These elements are critical for generating reliable insights, especially when it comes to multi-channel incrementality reporting.
How do I use iROAS results to change budgets without hurting revenue?
To make the most of your marketing budget, leverage iROAS (incremental Return on Ad Spend) results to pinpoint which channels or campaigns are driving actual incremental revenue. Once identified, shift your budget toward these high-performing areas. At the same time, cut back or pause spending on activities that show little to no incremental impact. This approach helps ensure your resources are directed toward growth opportunities without risking overall revenue performance.