

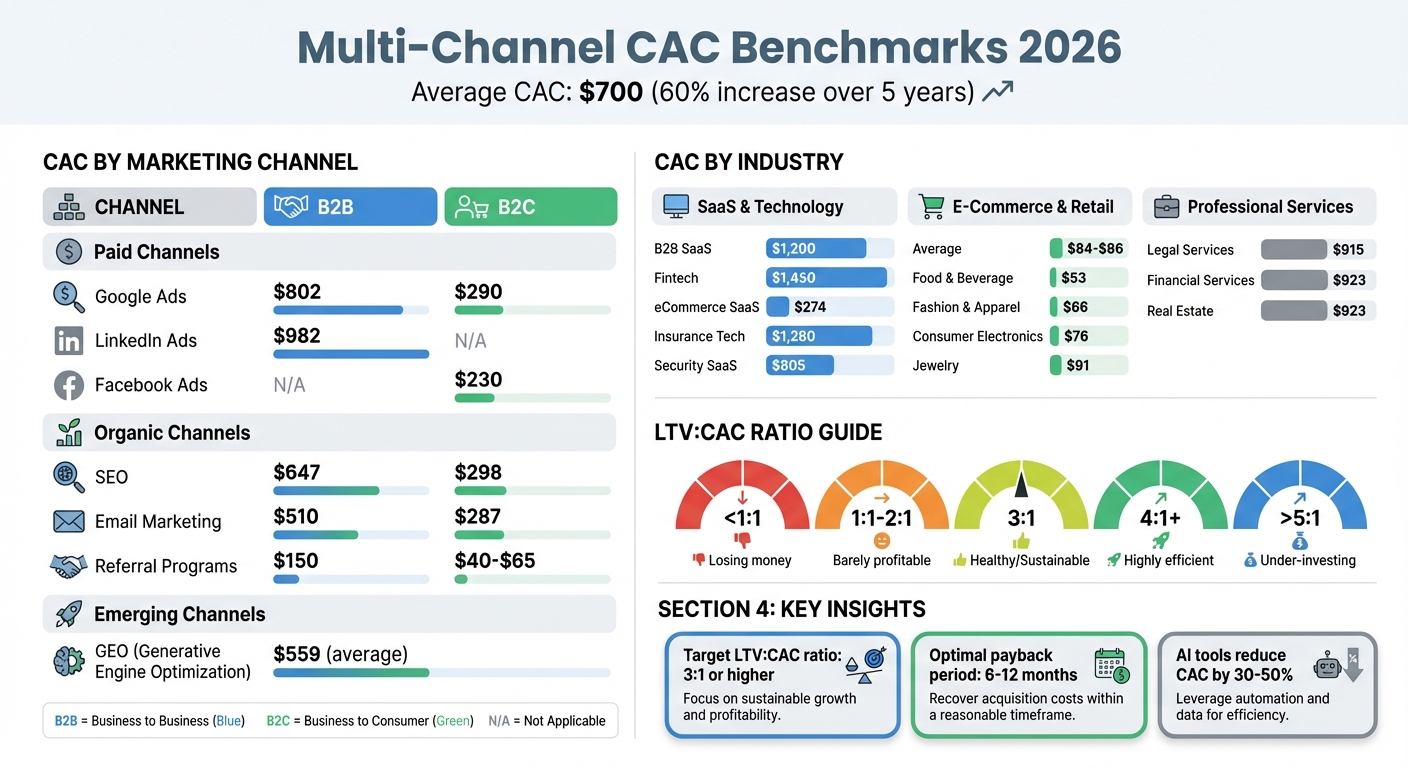
Customer Acquisition Cost (CAC) in 2026 has reached record levels, driven by rising digital ad costs, privacy regulations, and changing consumer behavior. The average CAC is now $700, reflecting a 60% increase over five years. Here’s what you need to know:
- Key Benchmarks by Channel:
- Google Ads: $802 (B2B), $290 (B2C)
- LinkedIn Ads: $982 (B2B)
- SEO: $647 (B2B), $298 (B2C)
- Email Marketing: $510 (B2B), $287 (B2C)
- Referral Programs: $150 (B2B), $40–$65 (B2C)
- CAC by Industry:
- SaaS: $1,200 (B2B SaaS), $274 (eCommerce SaaS)
- E-commerce: $84 average, $53 (Food & Beverage) to $91 (Jewelry)
- Professional Services: $915–$923 across Legal, Financial, and Real Estate sectors
- Challenges: Digital ad saturation, higher privacy-related costs, and shifting consumer expectations (e.g., demand for personalized experiences).
- Solutions: Focus on improving your LTV:CAC ratio (target 3:1 or higher), optimize underperforming channels, and leverage AI tools to reduce inefficiencies.
Staying competitive requires tracking CAC by channel, reallocating budgets effectively, and maintaining profitability through better targeting and conversion strategies.
2026 Customer Acquisition Cost Benchmarks by Channel and Industry
What Is Customer Acquisition Cost (CAC)? Digital Marketing Metric Definitions
Factors Affecting CAC in 2026
Economic shifts and market trends are pushing customer acquisition costs (CAC) higher in 2026. To stay competitive, businesses need to understand these drivers and adjust their strategies to maintain profitability in a costly digital environment.
Increasing Costs on Digital Platforms
One of the biggest contributors to rising CAC is the saturation of digital advertising platforms. With more advertisers competing on Google, Meta, and TikTok, bidding wars for limited ad inventory have intensified. In the U.S., advertising costs rose by about 12% year-over-year, driven by heightened competition among global e-commerce brands targeting the same premium audiences. For example, Meta‘s average CPM in the U.S. skyrocketed to $23.00, significantly higher than the global average of $6.59. Similarly, Google Search CPC in the U.S. reached $2.69, compared to the global average of $1.50.
Privacy changes have also made ads less effective and more expensive. Updates like iOS tracking restrictions and GDPR have reduced targeting accuracy, forcing advertisers to aim at broader, costlier audiences. This inefficiency is reflected in Google Ads’ average cost-per-lead, which hit $70.11 in 2025 – a 5.13% increase from the prior year. These challenges mean nearly half of marketing budgets are now spent inefficiently.
Geographic differences further influence acquisition costs. In the U.S., acquiring a customer costs 6–7 times more than in emerging markets like Brazil or Southeast Asia, even when engagement metrics are similar. As a result, some companies are adopting geo-arbitrage strategies, targeting Tier 2 and Tier 3 markets where CPMs are lower. But platform costs aren’t the only issue – changing consumer behavior adds another layer of complexity.
How Consumer Behavior Changes Affect Acquisition Costs
As ad platforms become more crowded, evolving consumer expectations make acquiring customers even tougher. Today, 71% of consumers expect personalized interactions, and brands that fail to deliver face higher friction and rising costs. Meeting these expectations requires advanced tools and frequent creative updates, which can be resource-intensive.
Ad fatigue is another growing challenge. With consumers bombarded by thousands of ads daily and their attention span resetting every few hours, static creatives lose their effectiveness quickly. This has led to declining click-through rates and increased costs. To combat this, brands need to produce between 50 and 500 ad variations per month. Companies leveraging AI to create personalized video content have reported CAC reductions of 30% to 50%, as fresh content keeps audiences engaged.
Search behavior is also shifting. More consumers are using AI-powered search engines and large language models instead of traditional Google searches. This shift has introduced Generative Engine Optimization (GEO), which delivers an average CAC of $559 and achieves 27% higher conversion rates compared to older search methods. In industries like electronics, where buyers often compare multiple options across various channels, brands must maintain visibility through PPC, SEO, and comparison shopping platforms.
Together, platform saturation, privacy regulations, and changing consumer habits have created a challenging landscape. Adding to the issue, only 33% of businesses were effectively using their marketing technology in 2024, meaning 67% of martech investments were wasted – further driving up CAC. Without proactive adjustments, companies risk seeing their margins shrink as acquisition costs spiral upward. These trends set the stage for understanding how specific channels are impacting CAC benchmarks in 2026.
CAC Benchmarks by Marketing Channel
Understanding the cost of customer acquisition (CAC) for each marketing channel is essential for spotting inefficiencies and reallocating your budget effectively. Below, you’ll find benchmarks for 2026 across paid, organic, and emerging marketing channels, helping you refine your strategy.
Paid Advertising CAC Benchmarks
Paid advertising delivers quick wins but often comes at a high cost. For instance, Google Ads remains a go-to for high-intent traffic, with an average CAC of $802 for B2B campaigns and $290 for B2C campaigns. If you’re targeting decision-makers, LinkedIn Ads are even more expensive, averaging $982 per customer – a whopping 4.3 times higher than Facebook Ads, which average $230 per customer.
If your paid CAC is far above these benchmarks, it might be time to review your targeting, landing pages, or conversion paths to ensure you’re not overspending without results.
Organic Marketing CAC Benchmarks
Organic channels take time to build but can pay off significantly in the long run. For example, SEO-driven acquisition typically costs between $480 and $942. However, once your content ranks consistently, CAC can drop to as low as $290.
Email marketing is another standout, with average CACs of $510 for B2B and $287 for B2C. Referral programs also shine, especially in B2B SaaS, where CAC averages just $150.
A great example is Dropbox, which used a "give and get storage" referral program to achieve a staggering 3,900% growth rate in just 15 months – all while spending almost nothing on traditional marketing.
New and Growing Channels in 2026
Emerging channels are reshaping how businesses approach customer acquisition. Generative Engine Optimization (GEO) is one such example, with an average CAC of $559 across industries. This channel focuses on optimizing content for AI-powered search engines and large language models, which are becoming key tools for research and discovery.
Platforms like TikTok are also making waves. Influencer collaborations on TikTok are proving to be 30%-40% cheaper per lead. That said, the platform’s rapid growth has led to increased competition and rising ad costs. To make the most of TikTok, prioritize authentic partnerships with creators to keep costs manageable while maintaining effectiveness.
Here’s a quick summary of these benchmarks:
| Marketing Channel | B2B CAC (2026) | B2C CAC (2026) |
|---|---|---|
| Paid Search (Google Ads) | $802 | $290 |
| LinkedIn Ads | $982 | N/A |
| Facebook Ads | N/A | $230 |
| SEO (Organic Search) | $647 | $298 |
| Email Marketing | $510 | $287 |
| Referral Programs | $150 | $40–$65 |
| Generative Engine Optimization (GEO) | $559 (average across industries) | $559 (average across industries) |
Source: Data compiled from First Page Sage and Phoenix Strategy Group.
sbb-itb-2ec70df
CAC Benchmarks by Industry
Customer acquisition costs (CAC) differ significantly across industries due to variations in sales cycles, customer lifetime value (LTV), and market competition. Here’s a breakdown of the 2026 data by sector.
SaaS and Technology Companies
SaaS businesses tend to face higher CACs, reflecting their longer sales cycles and competitive landscapes. In 2026, the average B2B SaaS CAC hit $1,200, a sharp increase from $702 in 2025, with sales cycles now averaging 134 days, up from 107 days in 2022.
Drilling down into SaaS verticals, Fintech leads with a CAC of $1,450, while eCommerce SaaS reports a much lower CAC at $274. Insurance tech and Security SaaS fall in between, averaging $1,280 and $805, respectively.
"Customer acquisition cost has become the defining metric separating sustainable B2B SaaS companies from those burning through capital." – GTM 80/20
Top-performing SaaS companies maintain a CAC-to-ARR (Annual Recurring Revenue) ratio of $1.00 per $1 of ARR, while companies in the bottom quartile spend $2.82 for the same revenue. If your CAC exceeds $1.50 per dollar of ARR, it might be time to reassess your strategy.
On the other hand, e-commerce generally enjoys lower CACs, thanks to shorter decision-making cycles.
E-Commerce and Retail Businesses
E-commerce has the lowest CAC among industries, with average costs ranging from $84 to $86. This is largely due to quicker purchases and shorter sales funnels. However, thin profit margins mean businesses must closely monitor CAC alongside customer return rates and repeat purchases to ensure profitability.
Breaking it down further, Food & Beverage brands spend around $53 per customer, while Jewelry retailers average $91. Fashion and Apparel brands fall in the middle at $66, with Consumer Electronics averaging $76. These differences often correspond to variations in average order value and purchase frequency.
Organic channels perform particularly well in e-commerce, with Organic CAC averaging $87, slightly higher than the $81 average for paid channels. Despite the small cost difference, organic customers generally deliver higher lifetime value due to stronger brand loyalty.
Professional Services Industries
Professional services can afford higher CACs because of their substantial customer lifetime values. Average CACs stand at $915 for Legal Services, $923 for Financial Services, and $923 for Real Estate.
Legal firms, for example, report an organic CAC of $584, compared to $1,245 for paid channels. Similarly, Financial Services show an organic CAC of $644, versus $1,202 for paid. These elevated costs are manageable because professional services often maintain robust LTV-to-CAC ratios – typically around 4:1 to 5:1 – with payback periods of 12–18 months.
These benchmarks highlight the importance of tailoring marketing investments to industry-specific dynamics in 2026.
| Industry Sector | Organic CAC | Paid CAC | Combined Average CAC |
|---|---|---|---|
| B2B SaaS | $205 | $341 | $273 |
| E-commerce (Retail) | $87 | $81 | $84 |
| Legal Services | $584 | $1,245 | $915 |
| Financial Services | $644 | $1,202 | $923 |
| Real Estate | $660 | $1,185 | $923 |
Data: Phoenix Strategy Group, First Page Sage.
How to Calculate CAC and Apply Benchmarks
CAC Calculation Formula and Components
The formula for calculating Customer Acquisition Cost (CAC) is straightforward:
CAC = Total Sales & Marketing Costs / New Customers Acquired.
To ensure accuracy, include every dollar spent on acquiring customers. This means accounting for marketing, sales, and overhead expenses, such as digital ad spend, content production, agency fees, salaries, CRM subscriptions, and platform fees.
It’s essential to measure costs and new customers during the same time frame – whether that’s monthly, quarterly, or annually. Exclude expenses unrelated to acquisition, like customer support or order fulfillment.
For example, in July 2025, Cozy Threads spent $5,000 on ads, $3,000 on salaries, $500 on platform fees, and $1,000 on freelance work. This brought their total acquisition spend to $9,500. With 500 new customers acquired that month, their CAC worked out to $19.
"A high CAC is only problematic if it exceeds the customer’s lifetime value (LTV). The critical metric is the LTV:CAC ratio, which determines the profitability of your acquisition cost."
– Ben Salomon, Growth Marketing Manager, Yotpo
By calculating CAC accurately, you can identify opportunities to improve spending efficiency.
Using Benchmarks to Optimize Marketing Spend
Comparing your CAC against industry benchmarks is a great way to identify inefficiencies. You can also calculate CAC for individual channels using the formula: Channel Spend / Channel-Attributed Customers.
If certain channels have high costs but low returns, consider reallocating your budget. For instance, a U.S.-based SaaS company used AI-driven analytics to cut its CAC by 18% while maintaining a healthy 3.5:1 LTV:CAC ratio. Similarly, an Amazon retailer reduced its paid CAC by 18% by shifting funds from costly ads to organic search and content strategies.
A high CAC often points to deeper problems, such as poor audience targeting, ineffective creative assets (e.g., high CPM combined with low CTR), or friction in the sales funnel. Even small improvements in conversion rates can make a big difference, as they allow you to acquire more customers without increasing spending.
Understanding the LTV:CAC Ratio
The LTV:CAC ratio is a powerful tool for evaluating the profitability of your customer acquisition efforts. This ratio compares the lifetime revenue generated by a customer (LTV) to the cost of acquiring them (CAC). A common benchmark is 3:1, meaning a customer should generate three times the revenue of their acquisition cost. Ratios above 4:1 suggest strong efficiency and may indicate it’s time to scale up your efforts.
| LTV:CAC Ratio | Interpretation | Recommended Action |
|---|---|---|
| < 1:1 | Losing money | Address funnel issues or pause acquisition efforts |
| 1:1 – 2:1 | Barely profitable | Focus on reducing costs and improving conversions |
| 3:1 | Healthy/Sustainable | Maintain current strategy and scale |
| 4:1+ | Highly efficient | Increase spending to grow market share |
| > 5:1 | Under-investing | Consider boosting acquisition efforts |
Data source: AdBid and KPI Depot.
Another important metric to consider is the payback period – the time it takes to recover your CAC. For most B2C and SMB B2B businesses, a payback period of 6–12 months is considered optimal.
In 2025, RetailCo found its LTV:CAC ratio was 1:5, which hurt profitability. After analyzing its marketing channels, the company discovered that social media generated higher-quality leads at a lower cost than traditional advertising. By reallocating its budget and improving onboarding processes, RetailCo improved its ratio to 1:7 within six months and increased average LTV by 25%.
Since acquiring a new customer can cost 5 to 25 times more than retaining an existing one, it’s crucial to focus on increasing customer lifetime value. By breaking down CAC and LTV by customer segment, you can uncover inefficiencies and use marketing automation to nurture leads at scale. This approach not only streamlines labor costs but also helps improve your overall CAC formula.
Conclusion: Using CAC Benchmarks to Improve Marketing Performance
CAC benchmarks only make a difference when you take action. Start by calculating your channel-specific CAC – divide your spending by the number of customers acquired – and compare the results to the 2026 standards.
Once you’ve nailed down your channel-specific CAC, focus on the LTV:CAC ratio as a key performance indicator. This ratio can be a compass for your strategy. A ratio of 3:1 is often considered sustainable, while 4:1 signals strong efficiency and room to scale aggressively. If your ratio climbs above 5:1, it might indicate you’re not investing enough in growth. On the flip side, a ratio below 3:1 suggests it’s time to revisit your strategy – whether that means improving conversion rates, reallocating budgets, or boosting customer retention efforts. This ties back to earlier observations about rising costs and the importance of reallocating budgets wisely across channels.
Here’s a quick reality check: the average CAC has jumped by 60% over the past five years. Ignoring CAC optimization can erode your unit economics, but managing it effectively can give you a real edge. Regularly review your channel performance, prioritize spending on the ones that deliver, and consider leveraging AI tools – already used by 88% of marketers – to minimize waste.
FAQs
What are the best ways to lower Customer Acquisition Cost (CAC) in 2026?
If cutting Customer Acquisition Cost (CAC) is on your radar for 2026, focusing on data-driven strategies is the way forward. Using tools like artificial intelligence (AI) can refine targeting and improve campaign efficiency, which, in some cases, could slash CAC by as much as 50%. But don’t stop there – keeping your existing customers happy is just as important. Why? Because holding onto customers often costs far less than chasing new ones.
Another smart move is to evaluate and fine-tune your marketing channel performance. For instance, organic search (SEO) can deliver more affordable, long-term results compared to paid options like social media or search ads. By regularly reviewing how each channel performs and shifting your budget toward the most effective ones, you can cut costs without sacrificing growth.
Lastly, think of customer acquisition as a system, not a series of disconnected campaigns. This approach helps you make smarter investments, adjust your marketing mix wisely, and stay profitable – even as CAC trends continue to shift.
What are the top marketing channels to focus on for reducing CAC in 2026?
In 2026, managing Customer Acquisition Cost (CAC) effectively will mean striking a balance between tried-and-true methods and newer, tech-driven strategies. Organic approaches like SEO and referral programs continue to shine as cost-effective options, with average CACs around $290 and $150, respectively. These methods leverage trust and nurture long-term growth, making them reliable choices for businesses.
On the other hand, paid channels like search and social media are evolving rapidly. For example, paid search remains a pricier option – averaging $800 CAC for B2B businesses – but the introduction of AI-powered tools is helping marketers trim expenses. Meanwhile, platforms like Facebook and LinkedIn are adapting to stricter privacy regulations, which means businesses are increasingly turning to advanced analytics to refine targeting and control costs.
Newer strategies, such as performance marketing and data-driven techniques, are also gaining momentum. By tapping into customer data and using AI for cohort analysis, companies can fine-tune their targeting, lower CAC, and align acquisition efforts with customer lifetime value. This approach not only helps reduce costs but also supports growth that’s built to last.
What is the LTV:CAC ratio, and why is it important for marketing strategies?
The LTV:CAC ratio (Lifetime Value to Customer Acquisition Cost) is a vital metric for assessing how effectively your marketing efforts are driving growth. It measures the relationship between the revenue a customer brings in over their lifetime (LTV) and the expense of acquiring that customer (CAC).
Ideally, this ratio should sit around 3:1. In simple terms, for every $1 spent on acquiring a customer, you should see $3 in lifetime value. A lower ratio might suggest you’re spending too much on acquisition or not generating enough value from customers. This could be a sign to reevaluate your spending or focus on improving customer retention. Keeping a close eye on this metric helps ensure your marketing investments are both profitable and sustainable over time.