
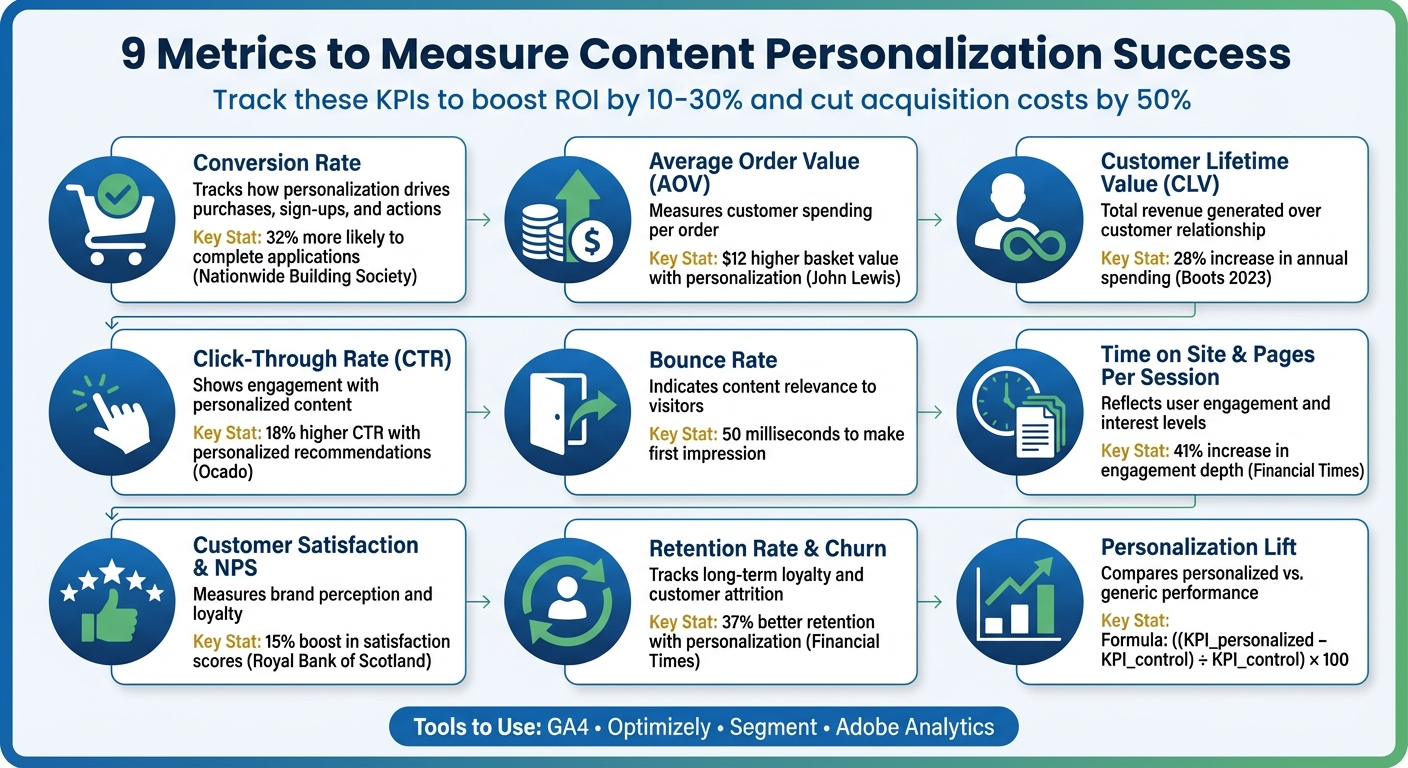
Content personalization can boost marketing ROI by 10–30% and cut customer acquisition costs by up to 50%. But how do you know if your efforts are working? Tracking the right metrics is the key. Here’s a quick overview of the 9 metrics you need to measure:
- Conversion Rate: Tracks how personalization drives actions like purchases or sign-ups.
- Average Order Value (AOV): Measures how much customers spend per order.
- Customer Lifetime Value (CLV): Evaluates the total revenue generated by a customer over time.
- Click-Through Rate (CTR): Shows how often users engage with personalized content.
- Bounce Rate: Indicates whether your content is relevant to visitors.
- Time on Site & Pages Per Session: Reflects user engagement and interest.
- Customer Satisfaction & NPS: Measures how users feel about your brand.
- Retention Rate & Churn: Tracks long-term customer loyalty and attrition.
- Personalization Lift: Compares performance between personalized and generic experiences.
Focus on these metrics to connect your personalization strategies to measurable business outcomes like revenue growth, customer retention, and reduced costs. Use tools like GA4, Optimizely, or Segment to gather and analyze data effectively. Start measuring today to turn your personalization into a data-driven success story.
9 Essential Metrics to Measure Content Personalization Success
How to master personalization in B2B marketing
1. Conversion Rate
Conversion rate is the bridge between personalization efforts and actual revenue. While clicks and page views show interest, the conversion rate reveals whether that interest turns into tangible actions like purchases, demo requests, or form submissions.
"Conversion rate gives you a complete picture of your sales cycle and its weak points." – Ketan Pande, Content Marketer, VWO
This metric becomes especially insightful when comparing personalized experiences to a non-personalized control group. For instance, in 2022, Nationwide Building Society introduced personalized financial tools such as tailored calculators and guides. Their analysis showed that users engaging with personalized content were 32% more likely to complete mortgage applications and reduced their decision-making time by 14%.
To gauge your performance, it’s helpful to understand industry benchmarks. Lead magnets often convert at rates between 10–30%, SaaS free trial pages typically see 5–7%, and e-commerce checkouts hover around 1–3%. These figures provide a realistic starting point for setting improvement goals.
Impact on ROI
Conversion rate plays a direct role in shaping your return on investment (ROI). The formula is simple: ROI = (Revenue lift + Cost savings) / Total investment. A great example comes from the Royal Bank of Scotland, which rolled out personalized financial guidance across its digital channels in 2019. Customers receiving personalized content initiated 8% more product applications compared to those in the generic control group. This not only boosted revenue but also reduced their cost per acquisition.
Engagement Effectiveness
Strong conversion rates are proof that personalized content is driving meaningful user actions. Take the case of British online supermarket Ocado in 2021. They compared personalized product recommendations to standard category suggestions. Shoppers who interacted with personalized recommendations added 23% more complementary items to their carts, increasing the average order value by 7% over six months.
"If your personalization isn’t converting more visitors, you’re just creating digital wallpaper." – Anubhav Verma, Associate Content Marketing Manager, Optimizely
To get the most out of conversion rate tracking, analyze specific audience segments – such as new visitors, returning customers, and various lifecycle stages. What works for a first-time visitor might not resonate with a loyal customer. Always include a control group receiving generic content to ensure your results stem from personalization rather than external factors like seasonality or market trends.
Next, we’ll explore how average order value offers another lens to measure the success of personalized content.
2. Average Order Value (AOV)
After tracking conversion rates, another essential metric to monitor is Average Order Value (AOV). While conversion rates focus on how many people take action, AOV zeroes in on how much they spend. This makes it a key indicator when evaluating the effectiveness of personalization efforts, as it reveals whether tailored recommendations and offers are driving customers to spend more.
To calculate AOV, divide total revenue by the number of orders. Then, compare the results between personalized and non-personalized shopping experiences. For example, in 2020, John Lewis Partnership conducted a controlled experiment with their personalized email program. By removing personalization for a randomized group of customers, they uncovered some eye-opening results: personalized product recommendations based on browsing history led to a $12 higher average basket value and a 23% jump in conversion rate compared to generic recommendations.
"A 5% increase in AOV compounds significantly at scale." – Anubhav Verma, Associate Content Marketing Manager, Optimizely
Impact on ROI
Even a modest 10% boost in AOV and conversion rate can increase overall revenue and Return on Ad Spend (ROAS) by 26%, which directly enhances ROI. Bear Mattress showcased this in action by revamping their cross-sell strategy. By using personalized product recommendations tailored to visitor purchase behavior, they achieved a 16% increase in total revenue.
Revenue Growth
Personalization enhances AOV by making cross-selling and up-selling more effective at key points in the customer journey. Recommending complementary or premium products that align with what shoppers already have in their carts not only encourages larger orders but also reduces cart abandonment by creating a more helpful and engaging shopping experience.
3. Customer Lifetime Value (CLV)
Customer Lifetime Value (CLV) is a key metric for evaluating the long-term success of content personalization. While Average Order Value (AOV) focuses on the value of individual transactions, CLV takes a broader view, measuring the total revenue generated throughout the entire customer relationship. This makes it an essential tool for assessing the lasting impact of personalization efforts, rather than just short-term campaign results.
To calculate CLV, use this formula:
(Average purchase value × Number of purchases) × Customer lifespan.
By comparing CLV before and after implementing personalization strategies, you can determine whether these efforts are successfully fostering customer loyalty over time. Additionally, analyzing how personalized interactions enhance customer retention and deepen engagement can provide valuable insights.
Customer Retention and Loyalty
In 2021, the Financial Times introduced a personalization framework built around an "engagement depth" metric. This metric combined factors like time spent on-site, scrolling behavior, and exploration of related content. Their findings were striking: personalized content recommendations boosted engagement depth by 41% compared to chronological suggestions. More importantly, subscribers with higher engagement depth scores achieved 37% better retention rates, directly linking personalized experiences to long-term subscription value.
"Organizations taking this longer view uncover personalization value that transaction-focused metrics completely miss."
- Anubhav Verma, Associate Content Marketing Manager, Optimizely
Another example comes from Boots, which in 2023 integrated data from its loyalty program, mobile app, and e-commerce platform. This cross-channel personalization strategy led to a 28% increase in annual spending among customers exposed to these tailored experiences.
Impact on ROI
The benefits of improved CLV align closely with broader trends in personalization and return on investment (ROI). By demonstrating how personalization strengthens customer retention and reduces customer acquisition costs (CAC), CLV becomes a powerful tool to justify personalization initiatives. For sustainable growth, a healthy LTV-to-CAC ratio is typically around 3:1, while a ratio below 2:1 often signals unprofitability. Segmenting CLV by audience can also reveal which customer groups benefit most from personalization efforts.
4. Click-Through Rate (CTR)
Click-Through Rate (CTR) measures how often users click on personalized content elements compared to how many times those elements are shown. The formula is simple: (Total Clicks / Total Impressions) × 100. Unlike metrics that take months to reveal trends, CTR provides feedback quickly – sometimes within days or weeks of launching a personalization campaign. This makes it a valuable tool for gauging the immediate relevance of your content.
Engagement Effectiveness
CTR acts as a quick barometer for how well your content resonates with users. A higher rate suggests that your personalization efforts are hitting the mark, while consistently low rates might signal that your algorithm isn’t aligning with user preferences.
"Click-through rates on personalized elements instantly reveal if your ‘relevance’ is, you know, relevant."
- Anubhav Verma, Associate Content Marketing Manager, Optimizely
Tracking specific actions, like clicks on "Add to Wishlist" or "Read Details" buttons, can help identify where your content is working and where it’s falling short. Tools like heat maps can further highlight interaction patterns, showing you which areas draw attention and where adjustments might be needed. This makes CTR an excellent metric for understanding immediate user behavior, setting the stage for deeper analysis in the context of broader performance goals.
Revenue Growth
CTR doesn’t just indicate engagement – it can also hint at future revenue potential. It’s considered a leading indicator for downstream metrics like conversions and sales. When users click on personalized calls-to-action (CTAs), they’re more likely to take valuable next steps, such as signing up for demos or adding items to their carts. For example, in 2021, British online supermarket Ocado found that personalized recommendations drove an 18% higher CTR than standard suggestions. This translated into customers adding 23% more complementary items to their baskets, ultimately boosting the average order value by 7% over six months.
To truly measure the impact of personalization, compare CTR data against a control group without personalization. Additionally, breaking down CTR by audience segments, like new visitors, can reveal even more insights – new users often see conversion improvements of 10% to 25% with effective personalization. However, it’s important to remember that a high CTR isn’t enough on its own. It needs to lead to meaningful actions, not just "vanity" clicks that don’t convert into actual results.
5. Bounce Rate
Bounce rate is a clear signal of whether your personalized content is hitting the mark. If visitors leave your page almost immediately, it’s a red flag that the content isn’t meeting their expectations. On the other hand, a lower bounce rate means your personalization efforts are working – visitors are finding value and sticking around.
Engagement Effectiveness
A personalized landing page has just 50 milliseconds to make an impression before a visitor decides to leave. That’s why bounce rate is such a critical metric – it provides instant feedback on whether your personalization is resonating with your audience.
"High bounce rates on personalized pages are worse than high bounce rates on generic ones. They signal your personalization algorithm is failing its job."
- Anubhav Verma, Associate Content Marketing Manager, Optimizely
To gauge effectiveness, compare your personalized pages against a control group of generic content. If the personalized version isn’t performing better, it’s time to rethink your data strategy. For instance, in 2021, the Financial Times analyzed "engagement depth" by tracking metrics like time spent, scroll behavior, and content exploration. Their personalized recommendations led to a 41% increase in engagement depth and a 37% boost in subscriber retention.
This kind of data-driven insight is key to understanding how personalization impacts your bottom line.
Impact on ROI
Every bounce represents wasted marketing dollars. Reducing bounce rates through effective personalization keeps potential customers engaged, increasing their chances of converting and driving down acquisition costs – sometimes by as much as 50%. By calculating the potential revenue saved for each prevented bounce, you can clearly see the financial benefits of personalization. Lower bounce rates not only smooth the customer journey but also contribute to higher conversion rates and average order values. Considering that 80% of consumers are more likely to buy from brands offering personalized experiences, a declining bounce rate often points to future revenue growth and a higher customer lifetime value.
sbb-itb-2ec70df
6. Time on Site and Pages Per Session
When users spend more time on your site and explore multiple pages, it’s a clear sign that your personalization efforts are hitting the mark. Time on site measures how long visitors stay, while pages per session shows how much of your content they engage with. Together, these metrics connect user engagement to business outcomes.
Engagement Effectiveness
These numbers offer immediate insight into how well your tailored content captures attention. When visitors view more pages, it’s often because they’re finding products or services that align with their interests. For example, a 2021 study by the Financial Times found that personalized recommendations increased engagement depth – measured by time on site and scroll behavior – by an impressive 41% compared to generic suggestions.
"The reason personalization is so important is that it makes the customer feel special… making the customer stay for a longer time, increasing the lifetime value of a customer."
- Ketan Pande, VWO
For new visitors, higher page views can signify growing trust in your brand, while for repeat customers, these metrics can reveal how well your re-engagement strategies are working. To measure the true impact of personalization, compare a control group receiving generic content with users experiencing tailored recommendations. This approach helps pinpoint how personalization drives engagement and allows you to refine your strategy.
Impact on ROI
Strong engagement metrics like time on site and pages per session don’t just look good – they directly influence your bottom line. The longer users stay on your site, the more likely they are to convert, reducing acquisition costs and boosting ROI. For instance, Financial Times subscribers with higher engagement depth scores showed 37% better retention rates, tying these metrics directly to long-term subscription value.
7. Customer Satisfaction and Net Promoter Score (NPS)
Engagement metrics tell you what users are doing, but Net Promoter Score (NPS) goes a step further by revealing how they feel about your brand. NPS is based on a simple question: "How likely are you to recommend us?" Customers respond on a scale from 0 to 10, which sorts them into three categories: Promoters (9–10), Passives (7–8), and Detractors (0–6). You calculate your NPS by subtracting the percentage of Detractors from the percentage of Promoters. This score is a strong indicator of customer loyalty and their likelihood to advocate for your brand.
Customer Retention and Loyalty
What makes NPS so valuable is its ability to predict future customer behavior, not just gauge current satisfaction. For example, in 2019, the Royal Bank of Scotland introduced personalized financial advice through its digital channels. When comparing customers who received tailored content with those who didn’t, they saw a 15% boost in satisfaction scores and an 8% increase in product applications. Similarly, a 2021 study revealed that subscribers exposed to personalized recommendations had a 37% higher retention rate. These examples show that when customers feel understood through relevant content, they’re more likely to stay loyal, driving long-term growth.
Impact on ROI
Higher NPS scores don’t just improve retention – they directly impact your bottom line. Satisfied customers who become Promoters cost less to retain and often bring in new business through word-of-mouth. Research shows that effective personalization can cut customer acquisition costs by up to 50% while boosting marketing ROI by 10% to 30%.
"NPS measures customer satisfaction as well as the potential for future sales, making it a valuable go-to metric for organizations of all sizes." – Hootsuite
To measure how personalization affects NPS, it’s crucial to use control groups. Compare scores between customers receiving personalized content and those experiencing standard interactions. This method helps you pinpoint the exact impact of personalization. Additionally, complement your NPS tracking with open-ended survey questions to understand whether customers see your personalization efforts as helpful or intrusive. Striking the right balance ensures you’re building trust without overstepping privacy boundaries.
At Growth-onomics, we rely on NPS data to fine-tune personalization strategies, helping businesses strengthen customer loyalty and maximize ROI.
8. Retention Rate and Customer Churn
Just like conversion rate and average order value (AOV), retention and churn rates are essential for understanding the long-term effects of personalization. Retention rate measures how many customers stick with your brand over time, while churn rate tells you how many have stopped engaging or using your services. Together, these metrics provide a clear picture of whether your personalized strategies are keeping customers engaged for the long haul.
Customer Retention and Loyalty
Churn rate can act as an early red flag for personalization missteps. If your tailored experiences feel off-target or overly intrusive, customers may decide to walk away. Research has consistently shown that deeper engagement often leads to better retention. When personalization is done well, it can strengthen customer loyalty and encourage them to keep coming back.
Revenue Growth
Retention doesn’t just build loyalty – it’s also a key driver of revenue growth. For instance, a 2021 study by Marks & Spencer revealed that personalized navigation features increased customer lifetime value (CLV) by 14% over a year. This highlights how engaging your existing customers through personalization can directly boost your bottom line.
Impact on ROI
Personalization isn’t just about keeping customers happy – it’s also a smart financial move. By reducing acquisition costs and increasing ROI, personalization proves its worth. To measure its impact effectively, compare retention rates against a control group without personalization. Additionally, tracking Net Revenue Retention alongside engagement metrics can offer deeper insights into how personalization affects revenue. A rising churn rate, on the other hand, is a clear signal that your strategy needs a closer look.
9. Personalization Lift
Personalization lift measures how much better a key performance indicator (KPI) performs when personalized experiences are used compared to generic ones. The formula is simple:
Lift (%) = ((KPI_personalized − KPI_control) ÷ KPI_control) × 100.
This metric is a clear way to gauge the effectiveness of your personalization efforts. It not only helps you understand immediate engagement but also lays the foundation for assessing long-term benefits like revenue growth and customer retention.
Impact on ROI
Personalization lift plays a major role in driving return on investment (ROI). To get the full picture, you need to translate the lift into revenue gains and weigh those against the total costs – like technology, staff, and content investments. Research shows that effective personalization can increase marketing ROI by 10% to 30% and cut customer acquisition costs by up to 50%. Even a modest 10% improvement in key metrics can significantly impact overall revenue.
"Personalization lift is the percentage improvement in a KPI caused by a personalized experience compared to a suitable control." – The Pedowitz Group
Engagement Effectiveness
High interaction and click-through rates on personalized content are signs that your efforts are connecting with users. For example, in 2021, the Financial Times introduced an "engagement depth" metric for personalized content. This change led to a 41% increase in engagement depth compared to their previous chronological suggestions.
Revenue Growth
The benefits of personalization lift extend beyond initial engagement, directly impacting revenue. By improving metrics like average order value (AOV), conversion rates, and revenue per user, personalization lift makes a tangible difference. A great example comes from Nationwide Building Society in 2022. They used personalized financial tools like calculators and guides, and prospects who interacted with these tools were 32% more likely to complete mortgage applications. Additionally, they saw a 14% reduction in time-to-decision.
Customer Retention and Loyalty
Personalization lift also strengthens customer loyalty by enhancing lifetime value and reducing churn. For instance, in 2023, Boots integrated data from its loyalty program, app, and website. This cross-channel approach resulted in a 28% higher annual spend among customers who experienced multi-touch personalization. The key to success lies in using control groups to measure the actual lift and focusing on long-term metrics like customer lifetime value rather than just short-term gains.
How to Track and Measure These Metrics
Effectively tracking personalization metrics starts with having the right tools and a clear strategy. Customer Data Platforms (CDPs) such as Segment or Tealium are essential for consolidating fragmented data from sources like CRMs, email platforms, and websites. These platforms create unified customer profiles, making it easier to measure user activity across channels and devices consistently. This unified data approach allows for precise event tracking and delivers actionable, real-time insights.
Analytics platforms play a key role in event-based tracking. Tools like GA4, Adobe Analytics, and heat mapping software such as Hotjar, FullStory, and ContentSquare enable you to capture user interactions and analyze behavior with advanced segmentation and cohort analysis. For example, in 2021, the Financial Times introduced an "engagement depth" metric and discovered that personalized content recommendations boosted engagement depth by 41%, while also improving subscriber retention rates by 37%.
To truly measure the impact of personalization, you need to go beyond tracking individual events. Control testing is crucial for isolating the personalization effect. Platforms like Optimizely, VWO, and Relevic allow you to create control groups – typically 10% to 50% of your audience – that receive a generic experience. By comparing this group to those receiving personalized content, you can measure the "personalization lift" without interference from external factors. Randomized holdout tests are particularly effective for understanding conversion lifts by directly comparing personalized and generic experiences.
Audience segmentation further refines measurement accuracy by aligning metrics with user intent. For instance, you might track engagement and exploration for new visitors, while focusing on conversion rates and repeat purchases for returning customers. Segment-level analysis can reveal that even if a personalization strategy seems underwhelming overall, it may be highly effective for specific high-value customer groups. This approach ensures you’re measuring success where it matters most.
However, challenges remain. For instance, 31% of marketing teams report limited bottom-line impact, while 44% of executives cite fragmented data as a major obstacle. Collaborating with experts like Growth-onomics can help you overcome these hurdles. Their expertise in data analytics, tracking implementation, and customer journey mapping ensures you’re focusing on the right metrics and translating technical data into clear ROI insights that resonate with stakeholders.
Conclusion
Content personalization isn’t a “set it and forget it” strategy – it’s an ongoing process of measurement, learning, and fine-tuning. The nine metrics discussed in this article form a well-rounded framework: engagement metrics like click-through rate (CTR) and time on site show how well your content connects with your audience, while business metrics such as conversion rate, average order value (AOV), and customer lifetime value (CLV) demonstrate the financial returns. As marketing analytics expert Camille Durand explains:
"Replacing intuition with empirical evidence transforms marketing from an art of estimation to a discipline of precision".
The numbers back it up: personalization can cut customer acquisition costs by up to 50% and boost marketing ROI by 10% to 30%. These benefits underscore the untapped potential for growth when personalization strategies are executed effectively.
Monitoring these metrics regularly turns raw data into actionable insights. By setting benchmarks, using control groups, and analyzing performance across different customer segments, you create a feedback loop that highlights successes and pinpoints areas for improvement.
To truly make personalization work, shift from occasional reports to a consistent cycle of testing and refinement. Incorporate these metrics into your revenue dashboards and ensure you’re working with meaningful sample sizes – at least 1,000 users per group for conversion metrics. This approach integrates personalization metrics into your broader strategy, creating a system that evolves alongside your customers’ needs.
For those looking to accelerate progress, collaborating with experts like Growth-onomics can make a difference. Their skills in data analytics and customer journey mapping help ensure you’re tracking the right metrics and focusing on long-term growth, aligning perfectly with the strategies outlined here.
FAQs
What are the best ways to measure the success of content personalization?
To gauge the success of content personalization, it’s crucial to start with well-defined goals that align with your business objectives, such as boosting revenue or enhancing customer retention. For instance, you might predict that tailored product recommendations could increase conversions by 20%. To validate this, use a control group or baseline to compare outcomes and pinpoint the exact impact of personalization.
Monitor both leading indicators (like click-through rates, engagement, or time spent on a page) and lagging indicators (such as conversion rates, average order value, customer lifetime value, and ROI). Key metrics to track include:
- Conversion rate: The percentage of personalized interactions that result in a sale.
- Click-through rate (CTR): How often users engage with personalized content.
- Average order value (AOV): The average amount spent per transaction.
- Customer lifetime value (CLV): The total revenue a customer generates over their relationship with your business.
- Engagement metrics: Measures like time on page, session length, or completed forms.
- Retention rate: The frequency of repeat visits or purchases.
- Net Promoter Score (NPS): A measure of customer satisfaction and loyalty.
- Revenue per user: The average revenue generated per individual customer.
- Overall ROI: The financial return from your personalization efforts.
Organizing these metrics into a structured framework and consistently testing variations can help you uncover actionable insights and refine your strategies. Growth-onomics specializes in transforming raw data into strategies that drive growth, ensuring your personalization initiatives achieve measurable and impactful results.
What are the benefits of increasing Average Order Value (AOV) with personalization?
Personalization has the power to elevate Average Order Value (AOV) by creating shopping experiences that align with individual customer preferences. Offering tailored product recommendations, dynamic pricing models, or curated bundles can inspire shoppers to add complementary or higher-margin items to their carts. The result? Customers spend more per transaction, boosting revenue without the need to drive additional traffic or increase acquisition costs. This approach not only delivers immediate financial benefits but also enhances the overall return on investment (ROI) for personalization efforts.
A higher AOV also plays a crucial role in strengthening Customer Lifetime Value (CLV), which directly impacts long-term profitability. By tapping into data-driven personalization – like AI-powered product suggestions or targeted promotions – businesses can maximize the value of each transaction while delivering a smooth and engaging shopping journey tailored specifically to U.S. consumers.
How does content personalization improve customer retention and reduce churn?
Personalization plays a powerful role in keeping customers loyal and reducing churn by offering experiences that align with their unique preferences. Research highlights that even a 5% increase in customer retention can drive profits up by an impressive 25% to 95%, while a 5% uptick in churn can severely hinder growth. Take Netflix, for instance – the company has effectively used data-driven personalization to maintain customer engagement and minimize churn.
When businesses personalize interactions – like addressing customers by name, suggesting products based on their interests, or tailoring deals to match past purchases – they foster deeper emotional connections. This approach not only encourages loyalty but also extends customer relationships and boosts customer lifetime value (CLV). Companies that focus on delivering personalized experiences often see tangible improvements in retention rates, solidifying personalization as a critical metric for success.