

Your onboarding emails can drive user activation, retention, and revenue growth – if you track the right metrics. Without proper measurement, you’re essentially guessing. Here’s how to ensure your emails deliver results:
- Engagement Metrics: Open rates (40%-55% for onboarding emails) and click-through rates (2%-5%) show if users are noticing your emails and taking action.
- Action Metrics: Click-to-Open Rate (6%-17%) and Time-to-Value (under 1 hour is ideal) reveal how effectively your emails guide users to meaningful actions.
- Retention & Conversion: Track 30-day retention (aim for 30% or higher) and trial-to-paid conversions to connect email performance to long-term business outcomes.
- Avoid Pitfalls: High unsubscribe (<0.5%) and bounce rates (<2%) hurt deliverability. Use preference centers and double opt-ins to maintain a healthy email list.
- Benchmarking: Compare your results to industry standards (e.g., onboarding emails outperform regular campaigns with open rates of 50%-80%).
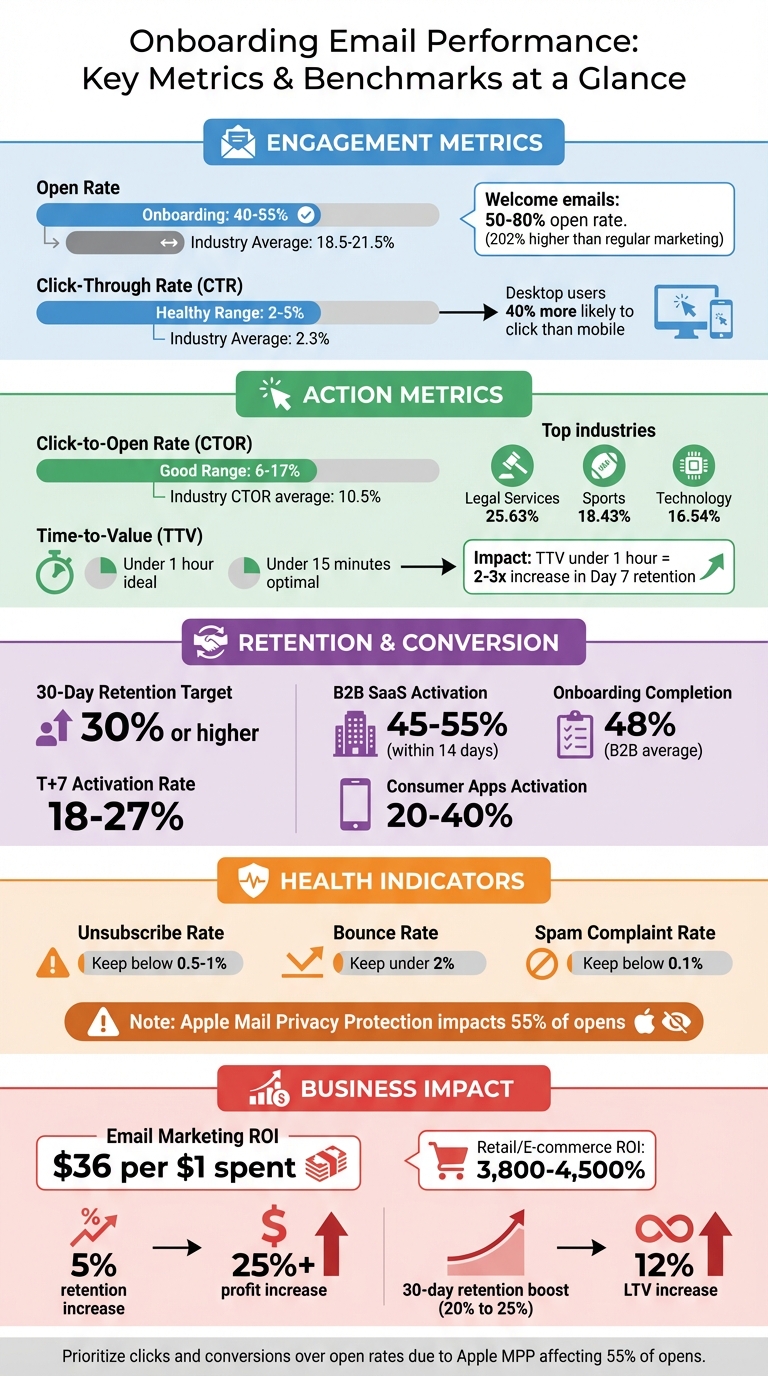
Onboarding Email Performance Metrics Benchmarks and Best Practices
Mastering Onboarding: The Ultimate 7-Day Drip Email Campaign
Step 1: Track Basic Engagement Metrics
To fine-tune your onboarding emails, start by analyzing how users interact with them. Basic engagement metrics provide a quick overview of whether your emails are grabbing attention and driving action. Let’s break this down, starting with open rates.
How to Measure Open Rates
The open rate shows the percentage of recipients who opened your email. For accurate results, exclude bounced emails from your calculation:
(Total Unique Opens ÷ (Total Recipients – Bounced Emails)) x 100.
It’s important to use unique opens instead of total opens to avoid inflated numbers when someone opens the same email multiple times.
Email providers track opens using a transparent pixel embedded in the email, which records when the email is loaded. This makes open rates a good indicator of how well your subject line, preheader text, and sender name are performing.
Here’s a tip: personalized subject lines can increase open rates by 26%. Likewise, using a personal sender name – for example, "Sarah from [Company]" – can boost open rates by over 15% compared to generic sender names.
Onboarding emails, sent right after sign-up when interest is at its peak, tend to perform exceptionally well. High-performing campaigns in this category often see open rates between 40% and 55%, far surpassing the 18.5% to 21.5% average across industries. Welcome emails, in particular, perform even better, achieving open rates 202% higher than typical marketing emails.
However, it’s worth noting that Apple’s Mail Privacy Protection, which impacts 55% of email opens as of March 2024, complicates tracking. This feature preloads images on Apple’s proxy servers, potentially triggering open tracking pixels even when the email hasn’t been opened by the user. Because of this, open rates alone may not tell the whole story anymore – pair them with action-based metrics for a more complete analysis.
How to Measure Click-Through Rates (CTR)
CTR measures the percentage of recipients who click on at least one link, image, or call-to-action (CTA) in your email. Use this formula to calculate it:
(Total Clicks ÷ (Total Emails Sent – Bounced Emails)) x 100.
This metric helps you understand whether your email content encourages users to take the next step in their onboarding process. A healthy CTR generally falls between 2% and 5%, with the overall industry average at 2.3%. For IT, tech, and software companies, the average hovers around 2.0%.
CTR is a reliable indicator because it requires intentional action from the recipient. Interestingly, desktop users are 40% more likely to click on links compared to mobile users, even though mobile devices typically see higher open rates.
A strong CTR shows your email is delivering on the promise of its subject line. It also provides insight into the effectiveness of your call-to-action, as well as the placement and design of your links or buttons. Monitoring CTR over time can reveal whether your audience is staying engaged or if they’re losing interest, possibly due to email fatigue.
One thing to watch out for: bot clicks from security tools. These can appear as instant clicks or unusually high click counts without corresponding opens, potentially skewing your data.
Step 2: Analyze Action-Oriented Metrics
While engagement metrics like open rates and click-through rates (CTR) tell you if users are noticing your emails, action-oriented metrics go deeper. They show whether users are taking meaningful steps, offering valuable insights into how effective your onboarding emails truly are.
Click-to-Open Rate (CTOR)
CTOR represents the percentage of recipients who clicked a link after opening your email. The formula is:
(Unique Clicks ÷ Unique Opens) × 100.
This metric focuses specifically on recipients who opened the email, making it a clear indicator of how well your design and call-to-action (CTA) perform.
If your CTOR is low but your open rate is high, it could point to issues like unclear copy, weak CTAs, or technical problems. For context, the average CTOR across all industries was 10.5% in 2021. In 2023, industries like Legal Services led with a CTOR of 25.63%, followed by Sports and Activities at 18.43% and Technology at 16.54%. A "good" CTOR generally falls between 6% and 17%, but comparing your current performance to past campaigns often provides a more accurate benchmark.
To improve your CTOR, focus on creating clear, engaging CTAs and personalize your email content based on user behavior. Testing how your emails appear on different mobile devices and email clients can also help you avoid technical hiccups.
First-Action Completion Rate
This metric tracks the percentage of users who complete a key task prompted by your onboarding email – like verifying their email, completing a profile, or starting their first project . It’s a good indicator of when users start seeing the value of your product .
High completion rates mean your CTA aligns well with user intent and that the transition from email to in-app action is smooth. On the other hand, low rates may point to a "value gap", where users don’t see enough benefit to take action. On average, SaaS onboarding processes achieve completion rates around 55%, while B2B SaaS products typically hit activation rates between 45% and 55% within the first two weeks.
For example, Digital communication platform Take analyzed user data to find and fix bottlenecks in their onboarding flow, leading to a 124% increase in activation rates. Similarly, eCommerce platform Yotpo improved retention rates by 50% after refining their welcome page and onboarding prompts.
To drive better results, identify your product’s "aha moment" – the action most linked to long-term retention – and center your onboarding emails around it . Reduce friction by minimizing the steps users need to take right after clicking through your email. Event-triggered emails based on user behavior can also help guide them toward completing key tasks .
Time-to-Value (TTV)
Time-to-Value (TTV) measures how quickly new users experience a meaningful outcome or reach their "aha moment" after signing up . This is crucial because 40%–60% of users who sign up for a SaaS product never return after their first login if they don’t quickly see value. A TTV under one hour is linked to a two- to threefold increase in Day 7 retention rates, with under 15 minutes being ideal.
Onboarding emails can significantly speed up TTV by guiding users toward quick wins and cutting down on friction between account setup and value realization . Instead of overwhelming users with tasks like setting up a password, focus on delivering immediate, tangible benefits – like helping them send their first campaign .
"Time to value (TTV) is not just another SaaS acronym. It is the north star of great onboarding."
– Kirsty McConnell, Chameleon
The formula for TTV is:
TTV = (Date of first value event) – (Date of sign-up).
Reducing TTV by 30% has been shown to boost customer lifetime value by over 50%. To achieve this, streamline your onboarding flow by eliminating unnecessary steps and deferring tasks like profile setup until after users experience the initial value . You can also use behavior-triggered emails to send a "Quick Start" guide if a user hasn’t reached their "aha moment" within 24 hours .
Step 3: Monitor Retention and Conversion Metrics
While action-based metrics tell you what users do right after opening your emails, retention and conversion metrics connect your onboarding efforts to revenue and overall customer value.
Track Retention Metrics
Engagement metrics highlight immediate interactions, but retention metrics dig deeper, showing how well your onboarding keeps users active over time. To measure this effectively, you need to first define what "active" means for your product. Instead of focusing on app opens – which might include background activity – choose a meaningful action like "logged an exercise" or "created a project". Then, group users by their signup or engagement date and monitor the percentage of active users at intervals like 1, 7, and 30 days.
Retention can be measured in two ways:
- X-Day (Bounded) Retention: Tracks if users return on a specific day. Ideal for products with daily use habits.
- Unbounded (Rolling) Retention: Captures any return after a given day, which is better for tracking long-term behavior.
For many products, hitting a 30-day retention rate of 30% or higher is a solid benchmark. For B2B SaaS companies, activation rates (users completing a core action within 14 days) typically range from 45% to 55%, while consumer apps see rates between 20% and 40%.
"Retention measures the ability of your product to keep users active over time."
– Olga Berezovsky, Author, Data Analysis Journal
Focus on improving Day 1 and Day 7 retention, as these are early indicators of long-term engagement. Retention heatmaps can help you visualize this data, with rows for signup cohorts and columns for time periods, making it easier to spot trends or dips in performance. Additionally, segment retention by user type, such as free versus paid users, to get a clearer picture of behavior and uncover potential conversion opportunities.
Once you’ve analyzed retention, connect these insights to conversion metrics to evaluate the overall success of your onboarding campaigns.
Calculate Conversion Rates
Conversion metrics show whether your onboarding emails are driving users to take key actions. To calculate the conversion rate, use this formula:
Conversion rate = (Recipients who converted ÷ Total emails sent) × 100.
For onboarding campaigns, conversions might include trial-to-paid upgrades, feature adoption, or billing setup. Each email in your sequence should target a specific action. For example, Day 1 emails could focus on "Activation", while Day 7 or Day 10 emails might push for trial-to-paid conversions.
To track conversions more effectively, use consistent UTM parameters (e.g., utm_campaign=onboarding_day_7) so your analytics tools can attribute actions to specific emails. Integrating email data with a CRM system provides full visibility across the funnel. Consider using multi-touch attribution to give credit to all touchpoints in the user journey, even if an email wasn’t the final interaction.
| Metric | Definition | Baseline Benchmark |
|---|---|---|
| T+7 Activation Rate | Percentage of new users reaching a core value event within 7 days | 18%–27% |
| 30-Day Retention | Percentage of new users still active 30 days after signup | 22%–30% |
| Onboarding Completion | Percentage of users finishing all required steps | 48% (B2B) |
Improving retention metrics, especially 30-day retention, can significantly boost lifetime value (LTV). For instance, increasing 30-day retention from 20% to 25% could result in a 12% rise in LTV per signup.
Monitor Unsubscribe and Bounce Rates
After analyzing conversions, check your unsubscribe and bounce rates to maintain email deliverability and sender reputation. High rates in these areas can lead to emails being flagged as spam or blocked entirely.
- Bounce Rate: Keep this under 2%.
- Hard bounces (invalid or non-existent addresses) should be removed immediately.
- Soft bounces (temporary issues like full inboxes) are retried automatically by most email providers.
- Unsubscribe Rate: Aim for less than 0.5%–1%.
- Spam Complaint Rate: Keep this below 0.1% to avoid damaging your sender reputation.
To minimize unsubscribes, offer a preference center where users can customize the type and frequency of emails they receive, rather than forcing an all-or-nothing decision. Behavior-triggered emails, sent only when a user stalls or disengages, can also reduce email fatigue and lower opt-out rates. Finally, using double opt-in ensures email addresses are valid and users genuinely want to receive your content, which helps reduce hard bounces.
sbb-itb-2ec70df
Step 4: Compare Performance with Benchmarks
Once you’ve gathered your metrics, the next step is to see how they stack up against industry benchmarks. For example, a 20% open rate might seem underwhelming, but without comparing it to industry standards, it’s hard to know if it’s truly a problem or just normal for your niche. Benchmarks provide that crucial context, helping you pinpoint where your onboarding emails are thriving and where they could use some fine-tuning. Use this data to determine whether your performance is on track or if adjustments are needed.
Use Benchmark Data
Onboarding emails tend to outperform regular campaigns. For instance, welcome emails can achieve open rates as high as 80%, while trial activation emails generally range between 20% and 40%. Compare this to the 2025 average open rate of 43.46% across all industries, and it’s clear why onboarding emails deserve special focus.
However, keep in mind that Apple’s Mail Privacy Protection (MPP) has inflated open rates by about 15–20 percentage points, making metrics like CTR (Click-Through Rate) and CTOR (Click-to-Open Rate) more reliable for gauging engagement. For 2025, the average CTR was 2.09%, while CTOR averaged 6.81%. When it comes to onboarding emails, a strong CTOR falls between 20% and 30%, especially for content-heavy or transactional messages.
Here’s a quick comparison of key metrics:
| Metric | Marketing Average | Onboarding Benchmark |
|---|---|---|
| Open Rate | 39.26%–43.46% | 50%–80% |
| Click-Through Rate (CTR) | 2.09%–6.21% | 3%–5% (high performing) |
| Click-to-Open Rate (CTOR) | 6.81%–10.5% | 20%–30% (content-rich) |
| Unsubscribe Rate | 0.22% | <0.2% (healthy) |
Performance also varies by industry. For example, software and web apps typically see an open rate of 39.31%, while non-profits can achieve as high as 52.38%. If your numbers fall below these benchmarks, it might be time to revisit your subject lines, clean up your email list, or refine the content of your emails.
Apply Cohort Analysis for Deeper Insights
While benchmarks give you a broad idea of how you’re doing, cohort analysis digs deeper into the behavior of specific audience segments. Instead of analyzing all users as a single group, cohort analysis helps you understand why some groups perform better by categorizing them based on factors like signup date, acquisition channel, or actions taken during onboarding.
For example, you could create a behavior-based cohort by segmenting users who clicked on a key “Aha moment” link in your Day 1 email. Then, track their retention rates at weeks 1, 4, and 12. This method can reveal which parts of your onboarding process drive lasting engagement and which ones might need improvement.
Other types of cohorts include:
- Time-based cohorts: Group users by their signup week or month to spot seasonal trends or assess the impact of product updates.
- Entry cohorts: Group users by acquisition channel or location to see which sources bring in the most engaged users.
For metrics like Time-to-Value (TTV), consider using median or p75 values instead of averages to avoid skewing results due to outliers.
A retention heatmap is a powerful tool for visualizing cohort data. Each row represents a signup cohort, and each column shows a time period. This format makes it easy to identify patterns, like a drop in Day 7 retention after a product update or a surge in engagement from users acquired through a specific campaign.
Step 5: Connect Metrics to Business Outcomes
To truly succeed with email campaigns, it’s crucial to tie email metrics directly to outcomes like revenue growth, customer retention, and satisfaction. Let’s break down how to turn these metrics into measurable business results.
Calculate ROI from Email Metrics
Once you’ve tracked engagement and action metrics, the next step is calculating ROI to measure the business impact. The formula is straightforward: (Revenue Generated – Campaign Costs) / Campaign Costs × 100. For onboarding emails, revenue includes both direct conversions (like free-to-paid upgrades) and indirect savings, such as fewer churned users or reduced support expenses. Don’t forget to factor in all campaign costs, from tools and software to labor.
Email marketing has an impressive return on investment, often delivering $36 for every $1 spent. In retail and e-commerce, returns can soar to 3,800%–4,500% . Onboarding campaigns can yield even greater results by boosting activation rates – the percentage of users completing their first meaningful action within 14 days. For B2B SaaS companies, typical activation rates range between 45% and 55%. Higher activation rates not only improve engagement but can also drive significant revenue growth.
"A 5% increase in customer retention produced more than a 25% increase in profits in financial services." – Bain & Company
To estimate how onboarding improvements impact revenue, use this formula: LTV per signup ≈ Activation Rate × Area-Under-Retention-Curve (months) × ARPU. For example, increasing 30-day retention from 20% to 25% could result in a 12% boost in LTV per signup, assuming ARPU stays steady. Additionally, track how many users cross "Product Qualified Lead" (PQL) thresholds – specific usage milestones signaling they’re ready to upgrade – after receiving feature-focused emails. These metrics reveal the immediate revenue impact of your campaigns.
Real-world examples highlight how impactful these strategies can be. Between 2014 and 2017, Mercari used Braze to create personalized seller onboarding and engagement campaigns. This approach helped the company achieve a 70% year-over-year increase in US gross merchandise volume (GMV) and reach 2 million monthly active users in the US. Similarly, Peacock (NBCUniversal) launched a personalized year-in-review campaign in July 2025, reducing churn by 20% in 30 days and increasing free-to-paid upgrades by 6%.
Link Metrics to Customer Journey Outcomes
Beyond ROI, it’s important to evaluate how email campaigns simplify the customer journey and reduce friction. Onboarding emails, for instance, not only drive conversions but also lower support costs by addressing common user pain points. Metrics like support ticket rates and Time-to-Value (TTV) – the time it takes users to achieve their first meaningful outcome – can help measure these effects . Using a control group (10–20% of users who don’t receive onboarding emails) can clarify whether your campaigns are accelerating these outcomes.
To assess the overall health of your campaigns, calculate Customer Health Scores. This metric combines factors like product usage, engagement, support tickets, and payment status to determine whether users are moving from "at risk" to "healthy" within 14–30 days.
Integrating your email platform with analytics tools like Amplitude or Mixpanel can take this a step further. By syncing support ticket data, you can automate helpful emails when a user’s health score drops, potentially preventing churn. You can also use UTM parameters (e.g., utm_campaign=onboarding_series) to track how email-driven traffic influences deal progression and the sales pipeline.
| Metric | Definition | Business Outcome Impact |
|---|---|---|
| Time-to-Value (TTV) | Days from signup to first meaningful action | Faster activation and better retention |
| Support Ticket Rate | Ratio of tickets to onboarded users | Lower support costs and improved clarity |
| Customer Health Score | Composite of usage, support tickets, and engagement | Predicts and prevents churn |
| Activation Rate | % of users reaching a core value event by Day 7 | Key driver of LTV and retention |
"If you can’t connect your lifecycle campaigns to business outcomes, you’re missing the story that matters." – Molly Evola, Sr. Content Marketing Manager, Customer.io
Conclusion: Optimize Onboarding Email Campaigns for Growth
Key Takeaways
Tracking your onboarding performance can uncover what truly motivates user action and builds loyalty. By zeroing in on key metrics, you can align your onboarding emails with your growth goals. Focus on engagement and action metrics to ensure users quickly discover their "aha moment" and convert. Then, connect these insights to measurable outcomes like retention, conversion rates, and ROI.
Top-performing teams view onboarding emails as an extension of the product experience, not just a marketing tool. They prioritize one clear objective per email, replace rigid time-based sequences with behavior-triggered messages, and use cohort analysis to identify trends in user behavior.
These strategies lay the groundwork for systematic testing and ongoing improvements.
Next Steps for Improvement
To build on these insights, refine your approach with targeted testing and consistent metric reviews. Create a structured measurement plan, reviewing core metrics weekly. In today’s landscape, prioritize "human signals" like clicks and conversions over vanity metrics, as Apple’s Mail Privacy Protection now impacts 55% of email opens, making open rates less dependable. Test one variable at a time – experiment with subject lines, send times, and personalized content tailored to user roles – to pinpoint what drives results.
Document your findings to create an internal playbook that can be shared across teams. This collaborative approach can increase ROI by 28%. For deeper insights, consider partnering with Growth-onomics (https://growth-onomics.com) for advanced data analytics and customer journey mapping to turn your onboarding emails into a powerful conversion tool.
FAQs
How can I boost open rates for onboarding emails despite Apple’s Mail Privacy Protection?
Apple’s Mail Privacy Protection has made open rate tracking less reliable, but that doesn’t mean you can’t create successful onboarding emails. Instead of focusing solely on opens, shift your strategy to areas that drive real engagement.
Start by refining your subject lines – make them attention-grabbing and relevant to your audience. Pair this with optimized send times that align with your subscribers’ routines. Timing matters more than ever when you’re aiming to capture attention in crowded inboxes. Another key step is segmenting your email list, so you can deliver content that feels personal and tailored to the recipient.
To encourage interaction, include clear calls-to-action and clickable elements in your emails. Whether it’s a button or a link, make it easy for readers to take the next step.
Since open rates are no longer a reliable metric, focus on what truly matters: click-through rates, conversion rates, and overall engagement. These numbers offer a more accurate view of how your campaigns are performing and provide actionable insights for improvement.
How can I reduce the Time-to-Value (TTV) for new users through onboarding emails?
Reducing Time-to-Value (TTV) in onboarding emails is all about helping users quickly see the benefits of your product. The key? Guide them toward their first "quick win."
Start by sending personalized, behavior-triggered emails that highlight features or actions aligned with their specific goals. For example, if a user signed up for a project management tool, an email nudging them to create their first project or invite team members could be that first step toward success. Tailoring your content to different user segments ensures you’re addressing their unique needs, making the experience feel more relevant.
Timing matters. Sending emails shortly after a user signs up can increase the chances they’ll engage and make progress toward meaningful outcomes. To refine your approach, use A/B testing to experiment with subject lines, email content, and calls-to-action. This helps identify what resonates most with your audience.
By combining personalization, well-timed outreach, and ongoing optimization, you can not only shorten TTV but also boost user engagement and retention.
How can I connect email performance metrics to business outcomes like revenue and customer retention?
To truly link email performance metrics to business results like revenue and customer retention, focus on metrics that reflect real outcomes. Metrics such as customer lifetime value (CLV), conversion rates, and revenue per email provide a clearer picture of how your email campaigns are impacting the bottom line. While open and click rates are useful for tracking engagement, they don’t tell the full story of how emails drive purchases or foster long-term loyalty.
Using multi-touch attribution models can give you insights into how email campaigns influence various stages of the customer journey – from the first interaction to purchase and beyond. Set well-defined KPIs that align with your business objectives, such as trial-to-paid conversion rates or the frequency of repeat purchases. Leverage data analytics to measure these outcomes and understand the role of email in achieving them. By connecting email performance directly to revenue and retention, you can fine-tune your campaigns for better results.