

When running ads, understanding Cost Per Acquisition (CPA) is crucial to know which ads are driving results. CPA tells you how much it costs to acquire a customer or conversion from a specific ad. Here’s the key formula:
CPA = Total Spend ÷ Total Conversions
For example, spending $1,000 to generate 10 sales means a CPA of $100. Tracking CPA helps you focus on ads that generate profit rather than wasting money on clicks or impressions that don’t convert.
Here are the essentials:
- Define your conversion goal (e.g., sales, signups).
- Use tools like Google Ads or Facebook Pixel for tracking.
- Compare CPA across platforms, audiences, and ad formats.
- Aim for a Lifetime Value (LTV):CPA ratio of at least 3:1 for profitability.
Accurate CPA tracking enables smarter decisions, such as shifting budgets to better-performing ads or optimizing underperforming ones. Use real-time monitoring to catch issues early and refine your campaigns for lower CPAs and higher returns.
Underperforming Ads? Fix these 5 metrics NOW (+ FREE forecasting tool)
What is CPA and Why It Matters for Campaign Performance
CPA vs Other Marketing Metrics Comparison Guide
CPA Definition and Calculation Formula
Cost Per Acquisition (CPA) is a key metric that shows how much it costs to gain a paying customer – or achieve a specific conversion, like a lead, signup, or sale – through a particular ad, campaign, or marketing channel. CPA is a powerful tool for fine-tuning ad creatives in real time because it directly ties creative performance to the profitability of your campaigns.
Here’s the formula: Total Ad Spend ÷ Total Acquisitions. For instance, if you spend $2,500 and generate 50 sales, your CPA is $50. Be sure to factor in creative production costs and software fees when relevant.
It’s crucial to define what counts as an "acquisition" – whether that’s a sale, a qualified lead, or a signup – so you can make accurate comparisons. Aim for a Lifetime Value (LTV)-to-CPA ratio of at least 3:1. Anything below that, like a 1:1 ratio, means you’re losing money after covering operating expenses. On the flip side, a 4:1 ratio signals a highly efficient campaign.
"Cost per acquisition (CPA) is one of the most critical financial metrics in digital marketing. It tells you exactly how much you spend to convert a prospect into a paying customer."
– Nikita Bykadarov, CEO, Maildoso
How CPA Compares to Other Advertising Metrics
CPA stands out because it measures business outcomes, not just engagement. Take Cost Per Click (CPC), for example: CPC tells you how much you’re paying to generate clicks and interest, but it doesn’t reveal how many of those clicks actually convert into paying customers. An ad with a low CPC – say, $0.75 – might still have a high CPA if those clicks don’t lead to conversions.
Cost Per Thousand Impressions (CPM) is another metric, but it focuses on brand exposure and reach, which is great for awareness campaigns. CPA, however, zooms in on conversion efficiency. Similarly, while Return on Ad Spend (ROAS) measures how much revenue you generate per dollar spent, CPA drills down on the cost of acquiring each customer. Both metrics are valuable, but CPA is especially important when profitability and scaling are your main goals.
It’s also worth noting the difference between CPA and Customer Acquisition Cost (CAC). While CAC is a broader, business-wide metric that includes salaries, tools, and overhead, CPA is much more specific. It’s tactical and channel-focused, making it ideal for comparing how different ad creatives perform.
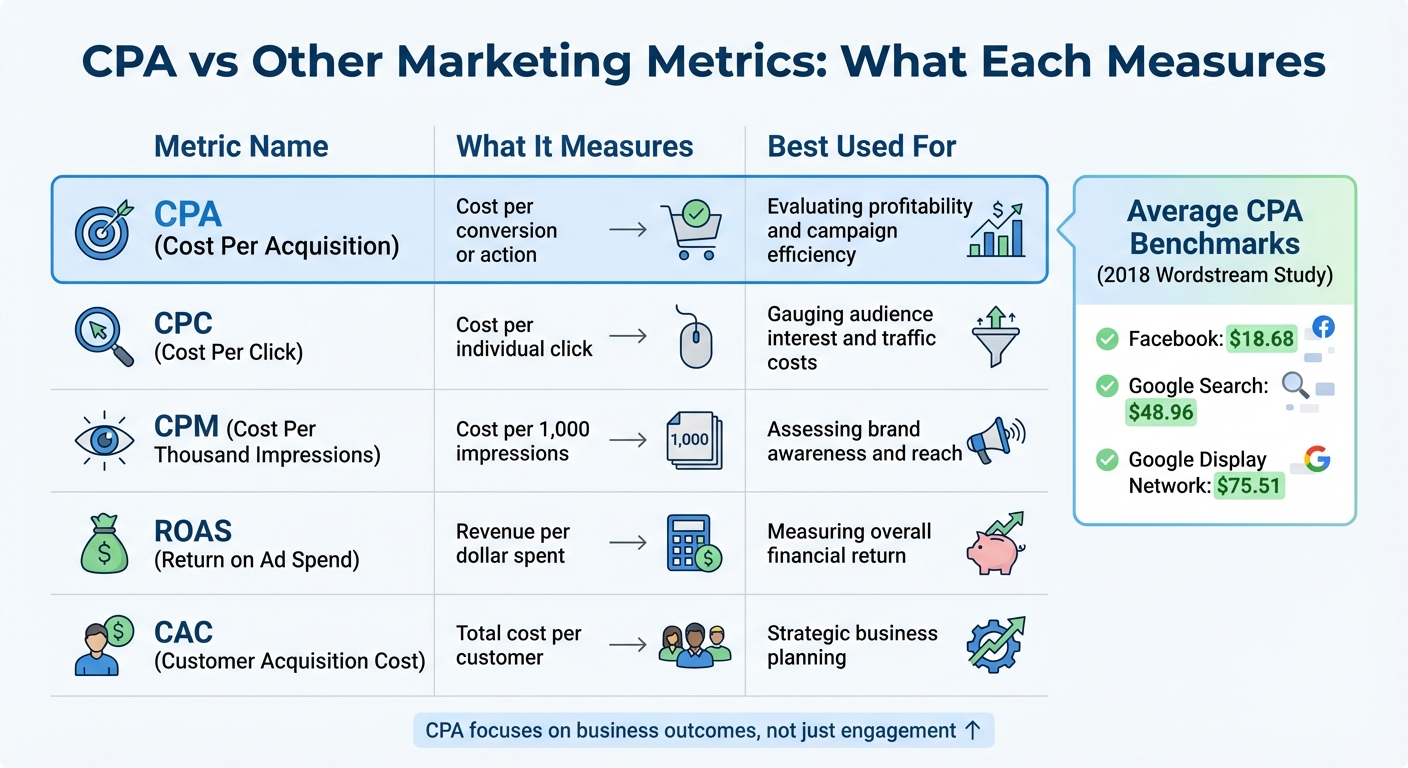
Here’s a quick breakdown of how CPA stacks up against other metrics:
| Metric | What It Measures | Best Used For |
|---|---|---|
| CPA | Cost per conversion or action | Evaluating profitability and campaign efficiency |
| CPC | Cost per individual click | Gauging audience interest and traffic costs |
| CPM | Cost per 1,000 impressions | Assessing brand awareness and reach |
| ROAS | Revenue per dollar spent | Measuring overall financial return |
| CAC | Total cost per customer | Strategic business planning |
To give you an idea of CPA benchmarks, a 2018 Wordstream study found the average CPA across all industries was $18.68 on Facebook, $48.96 on Google Search, and $75.51 on the Google Display Network. Some industries, like apparel, education, and fitness, saw Facebook CPAs dip below $15. For B2B SaaS companies, CPAs on Google Search often range from $100 to $300 or more, while e-commerce CPAs typically fall between $45 and $65.
Now that you understand CPA and how it compares to other metrics, the next step is to set up effective tracking for your ad creatives.
How to Set Up CPA Tracking for Ad Creatives
Selecting the Right Conversion Actions to Track
The first step in CPA tracking is to define what qualifies as a conversion for your business. A conversion can be any customer action that aligns with your goals – like a purchase, signing up for a newsletter, installing an app, or making a phone call. The key is to ensure these actions match your business objectives.
To streamline this process, separate your conversion actions into two categories: primary and secondary. Primary actions are the ones you want to optimize for – they show up in your main "Conversions" column and directly influence automated bidding and CPA calculations. Secondary actions, on the other hand, are for observation purposes only and don’t impact your bidding strategy. For example, in e-commerce, a purchase would be a primary action, while a newsletter sign-up might fall under secondary actions.
You’ll also need to decide on appropriate counting methods and set a conversion window that aligns with your sales cycle. Once these steps are complete, you can move on to implementing tracking tools to ensure accurate attribution of conversions.
Setting Up Tracking and Attribution Tools
Accurate tracking is the backbone of measuring CPA at the ad creative level. Without it, you can’t properly attribute conversions or fine-tune your campaigns. To get started, set up tracking systems using Google Ads and Google Analytics 4 (GA4). GA4 is particularly useful for tracking performance across multiple channels (like organic search, social media, and email), while Google Ads focuses specifically on paid campaigns.
To link these platforms, connect your Google Ads account to a GA4 property and enable auto-tagging in Google Ads. In GA4, mark important interactions as "Key Events" under the Admin settings, then import these events as conversions into Google Ads. The process flows like this: Event → Key Event → Conversion. Make sure both accounts are set to the same time zone to avoid any discrepancies in reporting.
For website conversions, install the Google Tag on your site. If you’re tracking app conversions, use Firebase for mobile app tracking. For offline conversions – like in-store visits or phone calls – you can import data through the Google Ads API or upload it manually. To maintain accuracy even when cookies are limited, enable Enhanced Conversions.
To track conversions at the creative level, use tracking templates with ValueTrack parameters. These parameters allow you to capture details like campaign IDs, ad group IDs, keywords, and devices. For example, a skincare retailer might use a template like this:
{lpurl}?campaignid={campaignid}&adgroupid={adgroupid}&keyword={keyword}&device={device}
If someone searches for "lotion" on a mobile device and clicks, the URL might look something like:
https://www.myskincare.com/moisturizers.com?campaignid=11111111111&adgroupid=2222222222&keyword=lotion&device=m.
Finally, choose an attribution model to decide how credit is distributed across different touchpoints. Data-driven attribution is a sophisticated option that uses machine learning to analyze both converting and non-converting paths. It considers factors like the sequence of ad exposures and the types of creative assets involved. This approach helps you identify which ad creatives are genuinely driving conversions, rather than simply giving credit to the last click.
Keep in mind that conversion data may take up to 24 hours to appear in Google Ads reports. Additionally, if you make changes to tracking templates, those updates might take 24–48 hours to reflect in ad performance.
sbb-itb-2ec70df
How to Calculate and Compare CPA Across Ad Creatives
Step-by-Step CPA Calculation for Each Ad Creative
Once you’ve set up tracking, calculating the Cost Per Acquisition (CPA) for each ad creative becomes straightforward. Here’s the formula: CPA = Total Cost / Conversions.
Start by installing tracking tools like Facebook Pixel for Facebook ads or Google Ads conversion tags on your landing and post-conversion pages. Customize your analytics dashboard to display relevant metrics, such as "Cost per Result" in Facebook Ads Manager or "Cost/conv." in Google Ads.
Before deciding whether an ad creative is performing well, ensure it has at least 500–1,000 impressions. A small sample size can skew results, making a low CPA seem promising when it might not hold up at scale. Also, account for indirect costs – like graphic design, video production, and software fees – when calculating your total expenses. This ensures you’re capturing the complete cost of acquiring a customer.
"It connects your marketing spend directly to the ultimate business goal: acquiring customers." – Improvado
When comparing creatives, don’t just focus on the lowest CPA. For example, a creative with a $15 CPA might deliver only 10 conversions, while another with a $22 CPA generates 200 conversions. Use CPA to identify underperformers, but also consider metrics like conversion volume or Cost Per Impression (CPI) to find the true winners. For profitability, aim for a Lifetime Value (LTV):CPA ratio of 3:1 or higher. A 1:1 ratio often means you’re losing money once operating expenses are factored in.
Breaking Down CPA by Audience, Platform, and Ad Format
CPA can vary widely depending on the platform, audience, and ad format. User behavior and intent play a significant role here. For instance, a 2018 Wordstream study found the average CPA to be $18.68 on Facebook, $48.96 on Google Search, and $75.51 on the Google Display Network. Search ads typically yield lower CPAs because users are actively looking for solutions, while display and social ads often require multiple touchpoints to drive conversions.
Different industries also experience distinct CPA benchmarks. For example, e-commerce businesses on Google Search typically see CPAs between $45 and $65, while B2B SaaS companies might pay $100 to $300 or more. Here’s a quick breakdown:
| Industry | Avg. CPA (Search) | Avg. CPA (Display) |
|---|---|---|
| E-commerce and Retail | $45 – $65 | $60 – $80 |
| B2B SaaS | $100 – $300+ | $200 – $400+ |
| Finance and Insurance | $80 – $120 | $100 – $150 |
| Healthcare | $70 – $100 | $90 – $120 |
| Travel and Hospitality | $50 – $70 | $80 – $100 |
| Education | $100 – $150 | $120 – $200 |
To optimize performance, analyze CPA by factors like device, location, age, and time of day. For instance, you might discover that mobile users have a lower CPA than desktop users or that certain regions are more cost-effective. Use your ad platform’s segmentation tools to fine-tune your targeting and shift budgets toward the best-performing segments. Additionally, exclude "negative audiences" (like users searching for "free" or "cheap") if you’re promoting premium products to avoid wasting ad spend.
Lastly, remember that the quality of your creative plays a huge role in CPA. Better creatives lead to higher click-through rates (CTR) and relevance, which ultimately lowers CPC and CPA. Test one creative element at a time – whether it’s the headline, image, or call-to-action – to understand what drives the best results. Use these insights to refine your ads and bring down your CPA further.
How to Lower CPA and Improve Campaign Results
Using CPA Data to Find Improvement Opportunities
Start by identifying which creatives have a high cost per acquisition (CPA) and focus on refining them. Tools like Google Ads’ ad strength ratings can guide you with actionable suggestions – whether it’s adding more headlines, tweaking calls-to-action, or integrating relevant keywords. Even small adjustments can lead to noticeable improvements in click-through rates (CTR) and help bring down CPA.
Another effective strategy is reallocating your budget. For instance, if one ad delivers conversions at $30 while another costs $80, shift more of your budget to the $30 ad and pause the underperforming one. To make informed decisions, run campaign experiments for about 2–3 weeks and aim for a 95% confidence level to ensure the results are reliable and not due to chance. While the default confidence interval is 80%, higher confidence is better for major budget decisions.
Fine-tuning your targeting is equally important. Exclude low-conversion segments by using negative keywords like "free" or "cheap" if you’re promoting premium products. Retargeting warm audiences – those who’ve already interacted with your brand – tends to yield lower CPAs compared to campaigns targeting cold audiences. Similarly, lookalike audiences based on your best customers can help you find new prospects who are more likely to convert efficiently. Dive into performance metrics by device, location, and time of day, and adjust your bids or schedules to prioritize the segments that consistently deliver lower acquisition costs.
These steps set the stage for ongoing, proactive campaign monitoring.
Tracking CPA in Real-Time to Catch Problems Early
Once you’ve optimized your creatives, tracking CPA in real-time becomes crucial. Waiting until the end of the month to review CPA can lead to unnecessary expenses. Real-time monitoring, on the other hand, allows you to catch issues early – whether it’s an unexpected spike in costs, a drop in conversions, or an underperforming creative draining your budget. Set up automated alerts for CPA spikes so you can pause or adjust campaigns before they waste resources.
When reviewing performance for budget adjustments, exclude the most recent 14 days of data. This accounts for the natural lag between clicks and conversions, helping you avoid premature decisions based on incomplete information. Even if you’re using automated bidding strategies like Target CPA, keep an eye on performance and adjust targets as market conditions evolve. Additionally, if you switch from last-click attribution to data-driven attribution, recalculate your target CPA to reflect the new credit distribution across the funnel. This ensures you don’t inadvertently underfund high-value campaigns.
Conclusion
Tracking CPA across your ad creatives is a powerful way to fuel predictable growth. It starts with the basics: clearly define your conversion actions and ensure proper tracking tags are in place on your post-conversion pages. With these steps, you’ll set the stage for accurate CPA measurement. To calculate CPA for each creative, simply divide the Total Cost by the Total Acquisitions. From there, segment your data by ad ID, label, or theme to pinpoint which creatives deliver the most efficient acquisition costs.
When it comes to attribution, don’t limit yourself to last-click models. Opt for a more comprehensive approach that credits creatives throughout the customer journey. This becomes particularly valuable once your account surpasses 300 conversions per month, making it eligible for Google Ads’ data-driven attribution model.
"Cost per acquisition (CPA) is one of the most critical financial metrics in digital marketing… it serves as a direct measure of efficiency and scalability." – Improvado
With accurate tracking and calculation methods in place, you’re ready to identify your top-performing creatives. Shift your budget toward those that lower CPA while maintaining a healthy LTV:CPA ratio.
To stay ahead, implement real-time alerts, consistently verify your tracking, and experiment with fresh creative ideas. Businesses that prioritize precise measurement and relentless optimization are the ones that find lasting success. Trust your data to guide you toward continuous improvement and sustainable growth.
FAQs
How can I effectively reduce my cost-per-acquisition (CPA)?
To reduce your CPA and make your campaigns more efficient, focus on these essential tactics:
- Keep an eye on CPA in real time: Use dashboards to track your CPA as soon as data comes in. If certain creatives aren’t performing well, pause or tweak them immediately to avoid wasting money. Shift that budget to ads that are delivering better results.
- Fine-tune your audience targeting: Look for audience segments that bring in the lowest CPA and cut out those that aren’t performing. This way, your ads are more likely to reach people who are genuinely interested, saving you from unnecessary clicks and costs.
- Improve your ad creatives and copy: Experiment with different headlines, visuals, or calls-to-action to boost engagement. Even small changes can make a big difference in how your audience responds, helping to lower your CPA.
- Use automated bidding tools: Platforms like Google Ads offer features like "Target CPA" bidding, which automatically adjusts your bids to align with your CPA goals. This reduces the risk of manual errors and saves time.
By combining real-time tracking, smarter audience targeting, creative tweaks, and automated bidding strategies, you can effectively lower your CPA and get more out of your campaigns.
What are the best tools to track CPA effectively?
To keep tabs on Cost Per Acquisition (CPA), a few tools stand out for their effectiveness. Google Ads’ native conversion tracking is excellent for evaluating how well your campaigns are performing. Pair that with Google Analytics, and you get a deeper dive into cost analysis and user behavior. For fine-tuning your CPA bids, Google Ads Editor is a reliable choice, offering streamlined management.
If you’re looking for even more precision, tools like CPA calculators or advanced analytics platforms can simplify the process. They make tracking and reporting much more straightforward, giving you a clear picture of how your campaigns are doing. Using these tools ensures your advertising strategies stay grounded in data and focused on delivering results.
What’s the difference between CPA and CAC?
Cost Per Acquisition (CPA) zeroes in on the average amount spent on advertising to gain a customer through a specific campaign or ad. It’s a performance-driven metric that focuses entirely on your paid advertising efforts.
In contrast, Customer Acquisition Cost (CAC) takes a broader approach. It accounts for all expenses tied to acquiring a customer. This includes not just ad spend but also costs like marketing budgets, sales team salaries, and software tools. While CPA is limited to ad performance, CAC gives a more detailed picture of your total acquisition investment.
Grasping the difference between these two metrics is key to assessing how efficient your marketing strategies are – and making smarter decisions when it comes to budget allocation.