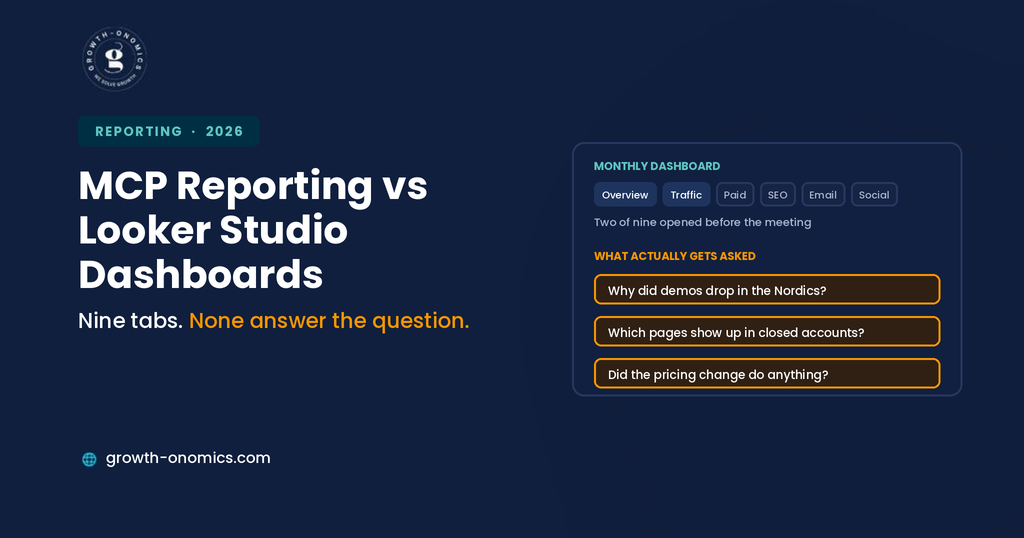
MCP-based reporting and Looker Studio dashboards solve different problems, and most B2B SaaS marketing teams need both.
A dashboard gives you the same numbers, calculated the same way, every month, available to anyone with the link.
An MCP connection lets you ask a question in simple language and get it answered live against Search Console, your CRM, or your ad platforms including the follow-up question nobody thought to build a chart for.
The distinction that decides everything else: a dashboard exists whether or not you look at it. An MCP connection exists only in the moment you use it.
That’s why the replacement pitch falls apart. Request-response cannot produce a scheduled report, a link you can send to someone outside your tooling, or a record that holds up when a number gets challenged 3 months later.
What it replaces is the delay, the three days between somebody asking why demo requests fell in the Nordics and somebody with SQL access finding out.
Below: where each one genuinely wins, what MCP actually costs to run, whether you can trust an answer with no visible query, and how to work out which of the reporting problems you have.
What Is MCP-Based Reporting, Exactly?
A live connection between an AI assistant and the tools that hold your data, so questions get answered against the source rather than against a snapshot somebody exported.
Model Context Protocol is the standard that makes it work. You connect a server for Search Console, another for your CRM, another for your analytics or ad platforms, and the assistant can query them directly. Ask which pages lost clicks month over month, and it runs the query rather than reading a chart somebody built in advance.
What it is not: a dashboard generator, a monitoring system, or a replacement for a data warehouse. MCP is request-response; nothing happens until someone asks. There is no scheduled refresh, no alert when a number moves, and no persistent view anyone can bookmark.
That single characteristic explains most of the comparison below. A dashboard exists whether or not you look at it. An MCP connection exists only in the moment you use it, which is a strength for investigation and a genuine limitation for anything anyone needs to find later.
How Do They Compare Side by Side?
| Dimension | Looker Studio | MCP-Based Reporting |
| Best at | Recurring, standardised views | Ad hoc questions and follow-ups |
| Setup | Hours to days per report | Minutes per connection |
| Cost of a new question | A build request | A sentence |
| Persistence | Always there, shareable link | Exists only in the session |
| Audit trail | The report is the record | Whatever you paste somewhere |
| Who can use it | Anyone with the link | Whoever has the connection |
| Failure mode | Goes stale, nobody notices | Confident answer, wrong join |
| Maintenance | Connectors, schemas, permissions | Server updates, scope creep |
What Are Dashboards Genuinely Better At?
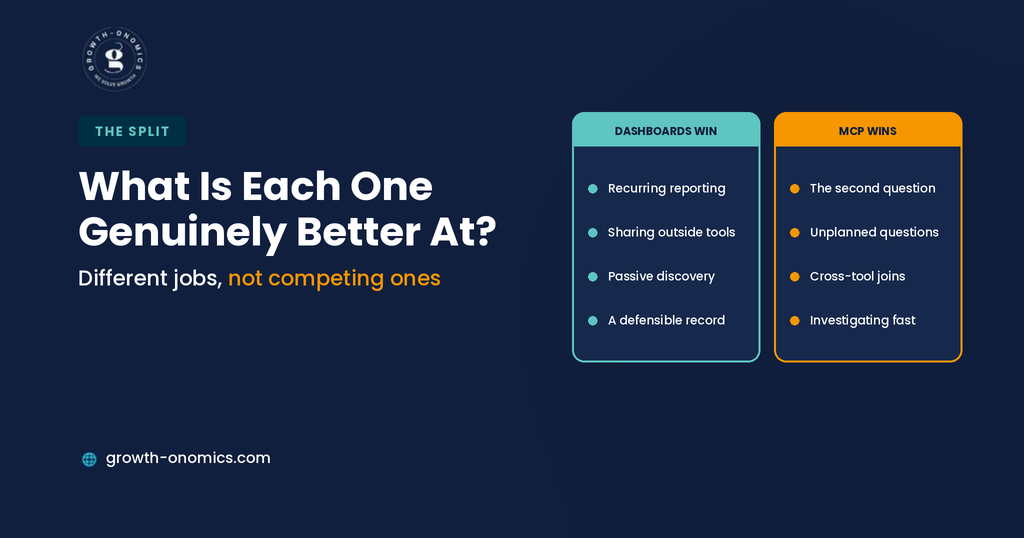
4 things, and they are not small.
Standardised recurring reporting. The same numbers, calculated the same way, every month. That consistency is the entire point of a monthly report, and it is exactly what a conversational query cannot guarantee. Ask the same question twice with slightly different phrasing, and you may get slightly different framing.
Shared access without shared tooling. A link works for a board member, a client, and someone in finance who will never install anything. MCP access requires the connection, a client application, and usually a licence for each person who needs it.
Being there when nobody asks. A dashboard is a passive artifact. Someone glances at it and notices something. That accidental discovery has no equivalent in a request-response model, where nothing surfaces unless you already suspected it.
A defensible record. When a number gets challenged 3 months later, the report is the evidence and the calculation is inspectable. A chat transcript is a much weaker artifact, and most people do not keep them.
For anything reported to a board, a client, or finance, a dashboard is still the right instrument. The definitions are fixed, the history is visible, and nobody has to trust an interface.
What Is MCP Genuinely Better At?
4 things mainly, and they are the 4 a dashboard has always been bad at.
The second question. Dashboards answer the question somebody anticipated. The value is almost always in the follow-up: Is that drop in one market or everywhere? Is it one page or twenty? Did it start before or after the release? Each of those costs a build request in a dashboard world and a sentence in a conversational one.
Questions nobody predicted. A dashboard is a set of decisions made months ago about the important things. Anything outside that set requires a person, a ticket, and a wait.
Cross-tool questions without a warehouse build. Which content appears in the journeys of accounts that converted, and what did we spend acquiring them? Answering that in a dashboard means joining CRM and ad data in a modelled layer. With connections to both, it is one query.
Investigation under time pressure. Something dropped, and the meeting is in twenty minutes. Conversational access closes the gap between noticing a number and understanding it, which is where most of the value in reporting actually sits.
Growth-onomics uses MCP connections for exactly this part of client work, diagnosis and investigation while monthly reporting stays in a fixed, versioned format the client can compare across quarters.
Why Do Most Dashboards Go Stale?
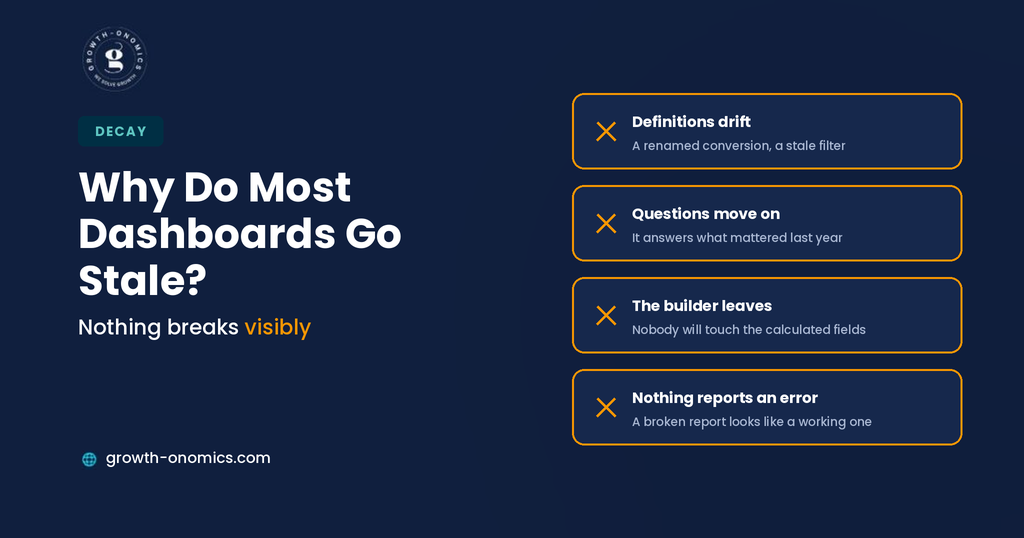
Because nobody owns them after launch, and the decay is invisible in a way that broken things usually are not.
Definitions drift. A campaign naming convention changes, a conversion action gets renamed, a filter written for last year’s account structure keeps running against this year’s. The dashboard still loads, the charts still render, and the numbers are quietly wrong in a way nobody will catch until somebody cross-checks them against a source.
Questions move on. The report answers what mattered when it was built. Two strategy shifts and a repositioning later, it is answering a question nobody in the room still has.
The builder leaves. Whoever wrote the calculated fields has moved on; nobody remaining wants to touch logic they did not write, and the report becomes read-only in practice, technically editable, functionally frozen.
Nobody notices any of it, because a dashboard failing looks exactly like a dashboard working. No error, empty state, or alert. Just numbers that are slightly less true every month, presented with the same confidence as the ones that are still correct.
MCP has the equivalent problem in a different shape. Nothing goes stale, because nothing persists, but nothing accumulates either. Ask the same question two quarters apart with different phrasing and you get two answers you cannot properly compare. Consistency has to come from you rather than from the tool.
What Does MCP Cost to Run?
Less than a warehouse and more than the pitch suggests, in 4 places.
Setup, which is genuinely fast. Most production marketing servers ship OAuth now, so connecting is closer to authorising an app than editing config files. Minutes rather than days, and no data modelling in between.
API quota, which is not free. MCP calls consume the same quotas as every other integration you run. An enthusiastic agent exploring a large account can burn a daily allowance before lunch, and the failure arrives as a rate-limit error halfway through a question you needed answered.
Governance, which is the actual cost. Every connection grants an assistant access to a real system, which is a permissions decision as much as a productivity one. Read-only by default, scoped to the specific properties needed, reviewed quarterly. Most marketing teams have no process for this and need one before the second connection rather than the fifth.
Verification time. Conversational answers arrive fluently and without a visible query, so a proportion of them need spot-checking against a known source. This is a real recurring cost, it does not decline much with familiarity, and the section below is about how to keep it manageable.
Against that, the maintenance a dashboard requires connectors breaking, schemas changing, permissions drifting, someone owning the whole thing does not disappear. It just moves.
Can I Trust an Answer I Cannot See the Query For?
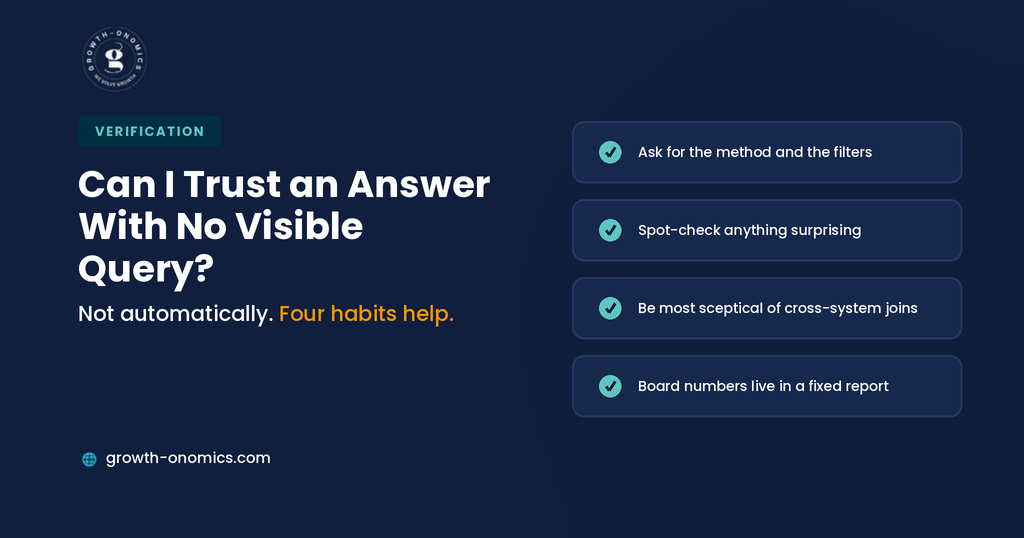
Not automatically, and this is the strongest argument against replacing dashboards wholesale.
The failure is confident and silent. An assistant joining two datasets on a mismatched key will produce a number, present it fluently, and not indicate that anything went wrong. A dashboard with a broken join usually shows something visibly odd.
Fluency is not accuracy. A well-written wrong answer is harder to doubt than an ugly correct one, which inverts the usual relationship between presentation and scrutiny.
Three practices make it workable. Ask the assistant to state its method and the filters it applied, not just the result. Spot-check anything surprising against the source before acting on it. And never let a conversational answer be the first appearance of a number that ends up in a board deck; if it matters that much, it belongs in a fixed report where the calculation is inspectable.
The rule most teams land on: conversational for investigation, fixed reporting for anything anyone will be held to.
What Questions Should Live in Each Layer?
The clearest way to divide them is by how often the question gets asked and how much rides on the answer.
Asked monthly, high stakes. Pipeline by channel, cost per opportunity, organic performance against target. These belong in the fixed report, calculated identically every period, with the definitions written down somewhere both marketing and finance have seen. Nobody should be phrasing these as a question each month.
Asked once, low stakes. Which blog posts lost traffic in Germany, whether the accounts that engaged last month match the ICP, what the search term report looks like filtered three ways. Conversational, every time. Building a dashboard view for these is how you end up with nine tabs.
Asked repeatedly, low stakes. This is the interesting middle. A question you find yourself asking every month deserves to be written down as a saved query with fixed thresholds, not promoted to a dashboard tab, but not reinvented each time either. The same diagnostic run the same way is comparable across quarters; an ad hoc version of it is not.
Asked once, high stakes. The dangerous quadrant, and the one worth a rule. A single question whose answer will move budget deserves verification against a known source before anyone acts, regardless of which tool produced it. This is where a fluent wrong answer does the most damage, because nobody expects to check something they only asked once.
Which One Should I Build First?
Depends entirely on which complaint you recognise.
“Nobody looks at our dashboard.” That is usually not a dashboard problem at all. It means the report answers questions people stopped asking, and adding conversational access on top will not fix a reporting spec that drifted two strategies ago. Fix the spec first, then consider MCP for the follow-ups.
“Every question takes three days.” This is the MCP case, precisely. The bottleneck is the queue between noticing something and understanding it, and connections remove it almost entirely.
“Our numbers disagree with sales.” Neither tool solves this. It is a definitions and data-joining problem, and adding a conversational layer over an unreliable join produces confident nonsense faster. Fix the plumbing first.
“We spend a day and a half assembling the monthly report.” Dashboard problem, or an automation problem, but not an MCP one. Request-response cannot run on a schedule, so nothing here removes the assembly work.
The pattern worth noticing is that two of those four are neither tool’s fault. Reporting complaints are frequently data complaints wearing a costume.
What Does a Working Setup Look Like?
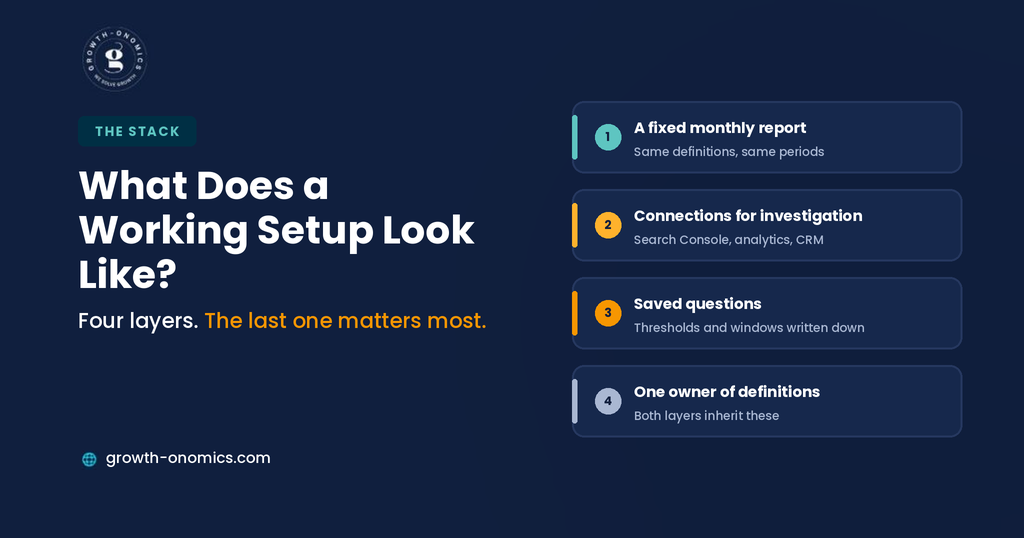
4 layers, and most teams end up with something close to this.
A fixed monthly report. Same definitions, periods, and structure, in a dashboard or a document. This is the artifact that goes to leadership and the record when a number is challenged later.
Conversational access for investigation. Search Console, analytics, and the CRM connected, used by whoever is answering questions that week. This is where the follow-ups live.
Saved questions. The queries that prove useful get written down with their thresholds and windows, so the same investigation is repeatable rather than reinvented. This is the thing almost nobody does and the thing that makes conversational access compound rather than stay a novelty.
Someone accountable for definitions. What counts as a qualified lead, which window a cohort uses, what the brand term list contains. Both tools inherit whatever this person decides, and neither can compensate if nobody has decided.
Growth-onomics documents these definitions at the start of a reporting engagement for that reason, the tooling argument is downstream of an agreement most teams never wrote down.
Conclusion
The pitch for MCP reporting is that it replaces dashboards. It does not, and buying it on that basis leads to a quarter of enthusiasm followed by a rebuilt dashboard.
What it replaces is the queue. The gap between someone noticing a number and someone understanding it used to be measured in days and a ticket. Connected properly, it is measured in the length of a sentence, and that changes how many questions get asked at all, which is the actual value, more than any individual answer.
Dashboards keep the jobs they were always good at: consistent recurring reporting, shared access for people outside your tooling, a passive artifact somebody glances at, and a defensible record when a figure gets challenged. Those are not small jobs, and no conversational interface does them.
Run both. Keep the monthly report fixed and versioned, connect the tools for investigation, write down the questions that work, and put one person in charge of what the definitions mean. That last one is more important than the tooling choice, which is the least satisfying conclusion available and the one most reporting projects skip.
If you want reporting where the fixed layer and the investigation layer both exist and agree with each other, the Growth-onomics team can build the definitions first and the tooling around them.
FAQs
Does MCP reporting replace Looker Studio?
No, and treating it as a replacement is the most common way these projects disappoint. MCP is request-response, so it cannot produce a scheduled report, a shareable link for someone outside your tooling, or a passive artifact anyone can glance at. What it replaces is the delay between a question occurring to someone and being answered which is where most reporting frustration actually lives. Keep the dashboard for recurring standardised reporting and use conversational access for the follow-ups it was never good at.
Can MCP send me alerts when a metric drops?
No. Nothing happens until someone asks, because the protocol is request-response with no trigger mechanism. This surprises people who assume a connected assistant is monitoring something. For genuine alerting, you need a scheduled job that runs a query and posts the output somewhere, an automation platform, or a purpose-built monitoring tool. A common workable pattern is a scheduled script for detection and conversational access for the investigation that follows an alert.
How do I stop the assistant giving me a confidently wrong number?
3 habits cover most of it. Ask it to state the method and filters alongside the result, so you can see what it actually queried. Spot-check anything surprising against the source before acting, since a fluent wrong answer is harder to doubt than an ugly right one. And keep board-facing numbers in a fixed report where the calculation is inspectable, rather than letting a chat answer be a figure’s first appearance. The joins are where errors hide, so be most sceptical of anything spanning two systems.
Is this only useful for technical teams?
Increasingly not. Most production marketing servers now use OAuth, so connecting is closer to authorising an app than editing a config file, and the querying is plain language. Where technical input still helps is deciding scopes, particularly for anything with write access and vetting community-built servers before granting them access to analytics or CRM data. If a server requires a config file with an API key pasted into it, that is a reasonable moment to involve someone technical.
Should clients or stakeholders have direct access to a connected assistant?
Rarely, and not because they cannot be trusted with it. A connected assistant answers whatever is asked with equal confidence, including questions where the join is fragile, or the definition is contested, and a stakeholder has no way to tell those answers apart from solid ones. What works better is giving them a fixed report with agreed definitions, and keeping conversational access to whoever can sanity-check a surprising result before it becomes a decision.
What should we do first if our reporting is a mess?
Fix the definitions before either tool. Write down what a qualified lead is, which cohort window you compare on, what your brand term list contains, and how campaigns are named. Both dashboards and conversational access inherit those decisions, and neither can compensate when nobody has made them. Teams that skip this step build a dashboard that disagrees with sales, then add an assistant that disagrees with the dashboard, and conclude the tools are the problem.