If I boil this case study down to one point, it’s this: the company didn’t have a channel problem – it had a data timing problem. By pulling ad, analytics, and CRM data into Snowflake, the team could track spend, CPA, ROAS, and closed revenue in one place and shift budget before waste piled up.
Here’s the short version:
- Annual marketing budget: $1,500,000
- Main issue: data spread across Google Ads, Meta, GA4, and CRM tools
- Result: budget decisions based on old exports and spreadsheets
- Fix: centralize data in Snowflake with hourly updates and dbt models
- Main use case: compare spend vs. time elapsed, watch CPA drift, and forecast month-end spend
- Outcome: ROI moved from 120%–140% to 180%–210%
- CPA dropped from $75–$85 to $50–$60
- Data latency fell from 24–48 hours to 15–60 minutes
Conversational Marketing Mix Modeling With Snowflake Intelligence
sbb-itb-2ec70df
Quick Comparison
| Area | Before Snowflake | After Snowflake |
|---|---|---|
| Data view | Split across platforms | One shared view |
| Reporting | Manual CSV and sheet work | Automated dashboard |
| Budget pacing | Late, reactive changes | Daily budget checks |
| Revenue tracking | Hard to tie back to campaigns | Spend linked to closed revenue |
| Waste | 18%–22% | 5%–8% |
I see this as a simple lesson for any U.S. business spending serious money on paid media: if you can’t see spend and revenue together in time, you’ll make budget calls too late.
The marketing budget problem before Snowflake
Before Snowflake, marketing data lived in separate ad platforms, analytics tools, and CRM systems. That meant spend, conversions, and revenue couldn’t be seen in one place.
Fragmented ad, analytics, and CRM data
Each platform followed its own attribution and conversion rules. So the numbers didn’t line up. A channel might look great in ad reporting, but far less impressive once revenue showed up in the CRM and accounting systems. Marketing reported a ROAS of 3–4x, while finance saw only a 1.5–2x revenue multiple in the CRM and accounting systems. When that kind of gap shows up, channel budget decisions stop being data-driven and start feeling like educated guesses.
The CRM added another layer of friction. Lead and customer records often came in without reliable UTM parameters or click IDs. So there was no clean path from a closed deal back to a given campaign or audience. The team could track leads, but not closed revenue. And when you can’t tie revenue back to spend, budget pacing turns reactive fast. In-month shifts were mostly off the table.
Manual reporting and poor budget pacing
Reporting was slow and hands-on. The team had to export CSVs, clean up campaign names, fix date formats, and rebuild reports in Google Sheets. That took 1–2 days each month, and the numbers were already 2–5 days out of date by the time anyone reviewed them.
That delay had a real cost. If a campaign’s CPA jumped from $50 to $120, the team often didn’t catch it until after $3,000–$5,000 had already been spent inefficiently that week. The same issue showed up at the quarterly level. If Q2 spend came in 10%–15% above a $300,000 budget, the overage often wasn’t spotted until the data had been pulled together by hand. Then came the scramble: abrupt cuts in June that disrupted lead flow right when it mattered most.
Every budget call happened with only part of the picture. That made stakeholders slower to scale what was working and slower to cut what wasn’t. That lag was the problem Snowflake had to solve.
How Snowflake was set up for centralized budget tracking
Fixing fragmented data took more than piping everything into one place. The team needed a warehouse setup that could support daily budget calls. In plain English, they needed one model that pulled together spend, conversions, and revenue fast enough to guide in-month moves, instead of relying on spreadsheet pacing and scattered reports.
Data warehouse design and core tables
The setup used a simple three-layer structure inside Snowflake. Raw schemas stored source data as-is from Google Ads, Meta, LinkedIn, GA4, and the CRM. A staging layer then cleaned and standardized that data. That included normalizing campaign names, fixing date formats, and lining up attribution fields across sources. The analytics layer turned that cleaned data into tables the team could use right away for spend, conversions, and pacing, including fct_daily_ad_spend, fct_conversions, and a budget pacing table that compared planned vs. actual spend by channel and campaign. [3][4][5]
dbt handled the transformations between layers. So naming conventions, deduplication rules, and join logic were applied the same way every time data refreshed. No manual cleanup. No spreadsheet formulas hanging on by a thread. The result was one trusted budget view shared by marketing and finance. [4][6][7]
Near real-time data ingestion and pacing visibility
Data connectors pushed fresh data into Snowflake every hour. [2] That gave the team a daily dashboard showing where spend stood against the monthly budget by channel, campaign, and audience segment.
The pacing table compared percentage of budget spent vs. percentage of time elapsed in the month. [8] The same dashboard also showed CPA, ROAS, and a forecasted month-end spend figure. So the team wasn’t just looking at a static snapshot. They could see where things were headed. If a campaign started drifting off target, they could step in while it was still live instead of waiting until the month was over.
Growth-onomics implementation role
Growth-onomics designed the analytics framework that made this setup useful day to day. The warehouse worked because the data model matched the decisions marketers had to make. Growth-onomics tied the Snowflake model to the company’s actual KPIs, mapped the customer journey from the first ad click to closed revenue, and defined the dashboard metrics budget owners needed to check each day.
That gave budget owners one shared daily view of spend, revenue, and pacing.
With that view in place, the team could move to the next step: shifting budget based on live performance by channel, campaign, and audience.
How Snowflake improved budget allocation and ROI
With spend, revenue, and pacing in one dashboard, the team could make changes while campaigns were still running. That matters. Instead of waiting until the month was over and then spotting waste, they could move budget early and keep more of it working.
Budget reallocation by channel, campaign, and audience
The team combined spend, clicks, conversions, lead quality, and closed revenue by channel, campaign, audience, and date. So rather than leaning on each ad platform’s built-in reports, they could compare performance across every channel using the same set of numbers: ROAS, CPA, and revenue per audience segment.
The biggest gains came from finding gaps between platform metrics and what happened later in the funnel. In one case, an audience segment had a lower click-through rate than the others, but its close rate in the CRM was much higher. A platform report might have marked that segment as weak. The Snowflake model showed the opposite.
That changed where the money went. Budget moved toward the audience segment that produced better close rates and more revenue, even when platform CTR looked worse. At the same time, campaigns with CPA running more than 20% above target were flagged automatically, and spend was shifted to segments bringing in more revenue.[9][1][10]
To keep those budget changes tight and repeatable, the team relied on two simple pacing formulas.
Pacing formulas and month-end spend forecasts
Two formulas shaped the team’s in-month budget control. The first was pacing percentage:
Pacing % = (Spend to Date ÷ Planned Spend to Date) × 100
Anything above 110% triggered a budget review.[9][1][10] The second formula estimated where spend was headed by the end of the month:
Month-End Spend Forecast = (Spend to Date ÷ Days Elapsed) × Total Days in Month
Both numbers refreshed daily inside the Snowflake dashboard. That gave the team an early read on overspending, so they could adjust bids or audience caps before the issue snowballed. Underspend stood out just as clearly, which helped the team avoid missing demand spikes and leaving budget unused.
Before-and-after operating model comparison
The move from scattered reporting to one automated view changed more than reporting speed. It changed how decisions got made.
| Aspect | Before Snowflake | After Snowflake |
|---|---|---|
| Data freshness | Delayed, fragmented reporting | Near-real-time warehouse visibility |
| Reporting speed | Manual spreadsheet builds | Self-serve dashboards |
| Attribution accuracy | Hard to connect touchpoints to revenue | Revenue tied to channel and audience |
| Decision cadence and control | Weekly or monthly reviews | Daily budget calls backed by pacing and forecast data |
Marketing and finance worked from the same pacing and revenue data. That shared view made ROI and CPA easier to track and judge.
Results, lessons, and conclusion
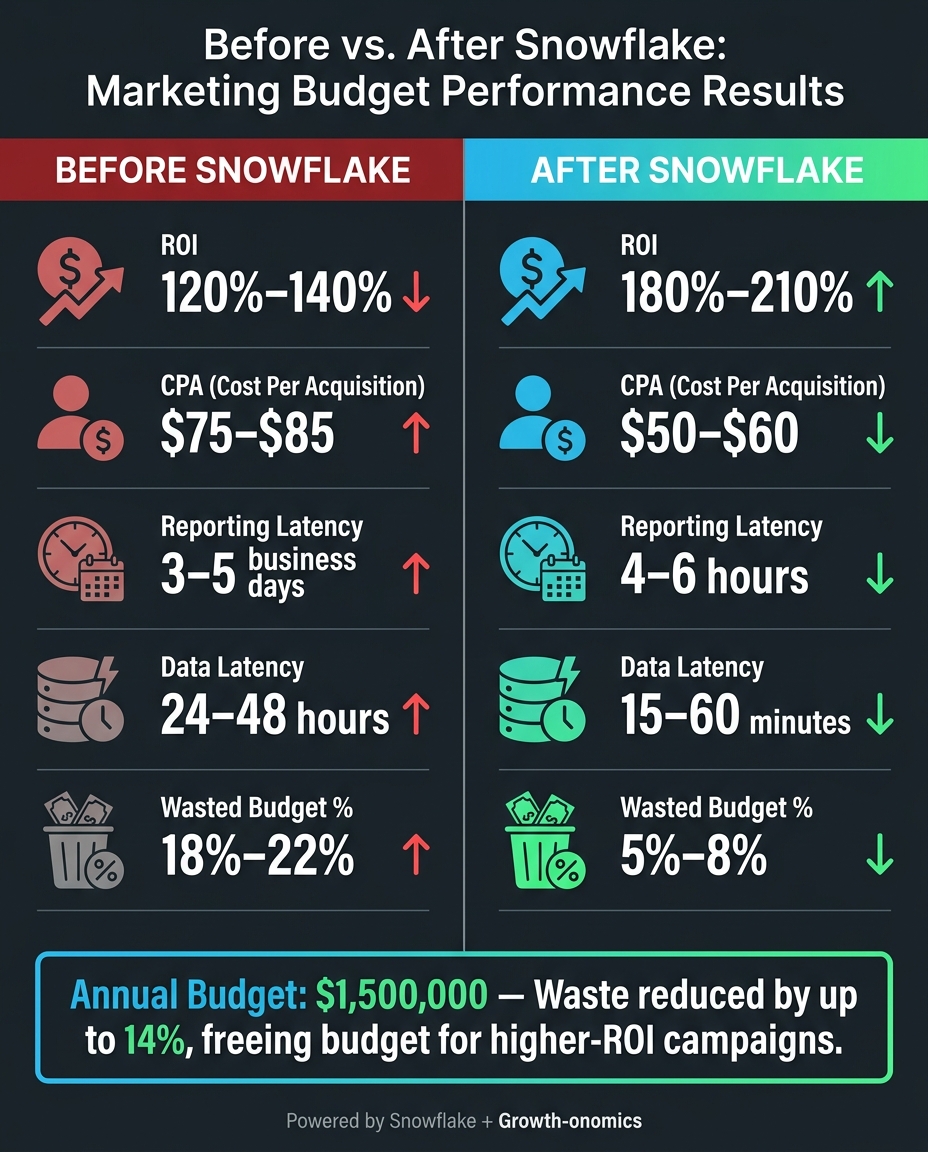
Before vs. After Snowflake: Marketing Budget Performance Results
Measured impact on ROI, CPA, and reporting speed
Snowflake improved ROI, CPA, and reporting speed in a way that showed up fast in day-to-day budget decisions.
| Metric | Before Snowflake | After Snowflake |
|---|---|---|
| ROI | 120%–140% | 180%–210% |
| CPA | $75–$85 | $50–$60 |
| Reporting latency | 3–5 business days | 4–6 hours |
| Data latency | 24–48 hours | 15–60 minutes |
| Wasted budget % | 18%–22% | 5%–8% |
Waste dropped from 18%–22% to 5%–8%, which freed up budget for higher-ROI campaigns. That gave the team room to shift spend the same day instead of sitting around for delayed reports.
The bigger point is simple: this wasn’t just a reporting upgrade. It changed how the team moved money across campaigns while results were still in motion.
What small and mid-sized businesses can apply
This same setup can work for smaller companies too, even with tighter budgets. The key is having one trusted view of spend and revenue before making budget changes. It also fits SMBs that run paid media at a level where small mistakes add up fast.
Start by putting spend, conversions, and revenue in one place. Then define pacing thresholds that tell the team when to step in. For example:
- Flag search campaigns that go above 120% of planned weekly spend
- Watch for CPA drifting more than 15% above target for over 48 hours
- Connect CRM outcomes like closed deals and repeat purchases back to campaign spend
Use the same decision points outlined here: spend vs. time elapsed, CPA drift, and closed revenue by campaign. Review spend and CPA every day so the team can act while there’s still time to fix underperforming campaigns.
Growth-onomics can help build the data model, pacing rules, and dashboard.
Conclusion: why Snowflake changed budget decisions
That shift changed more than reporting. It changed how budget calls were made.
Before Snowflake, teams made budget decisions using old and partial data. After Snowflake, everyone worked from the same numbers, refreshed every 15–60 minutes. Marketing and finance weren’t arguing over different reports anymore. They were looking at one daily budget view and making calls from the same screen.
Snowflake made budget decisions faster, cleaner, and easier to trust.
FAQs
How does Snowflake improve budget pacing?
Snowflake helps teams pace budgets better by putting raw marketing metrics in one scalable data warehouse. That gives marketers a clear view of actual spend vs. planned daily targets in near real time.
When you connect Snowflake to tools like Streamlit, you can build interactive dashboards with sub-minute latency. In plain English: teams don’t have to wait around for stale reports. They can check mid-day progress, catch mismatches early, and trigger alerts when KPIs start drifting from benchmarks.
What data sources need to be connected?
Bring together data from every key online and offline channel so you can work from one source of truth.
That usually means connecting:
- ad platforms like Google Ads, Meta Ads, and LinkedIn Ads
- web analytics and CRM systems
- financial systems, ERP platforms, and offline sources like trade shows or direct mail
Growth-onomics can help connect these data flows, which makes performance measurement and ROI tracking more accurate.
Can smaller businesses use this setup too?
Yes. Smaller businesses can use this setup without putting big infrastructure in place on day one. The trick is to plan it well and roll it out step by step, with the business need leading the way.
If your team has limited time, budget, or headcount, an ELT process is often the best place to start. It lets you work with the data sources you already have instead of building a big system all at once.
Growth-onomics can help shape a cost-effective setup around your current data sources and where the business needs to grow right now.