If you want better e-commerce growth, I’d focus less on first-order revenue and more on what each customer is likely to spend next. The article’s main point is simple: predictive lifetime value helps me decide who is worth more ad spend, who needs retention work, and where my CRM automations should act first.
Here’s the short version:
- Historical CLV looks backward. It shows what a customer already spent.
- Predictive CLV looks forward. It estimates what a customer may spend in the next 12 to 24 months.
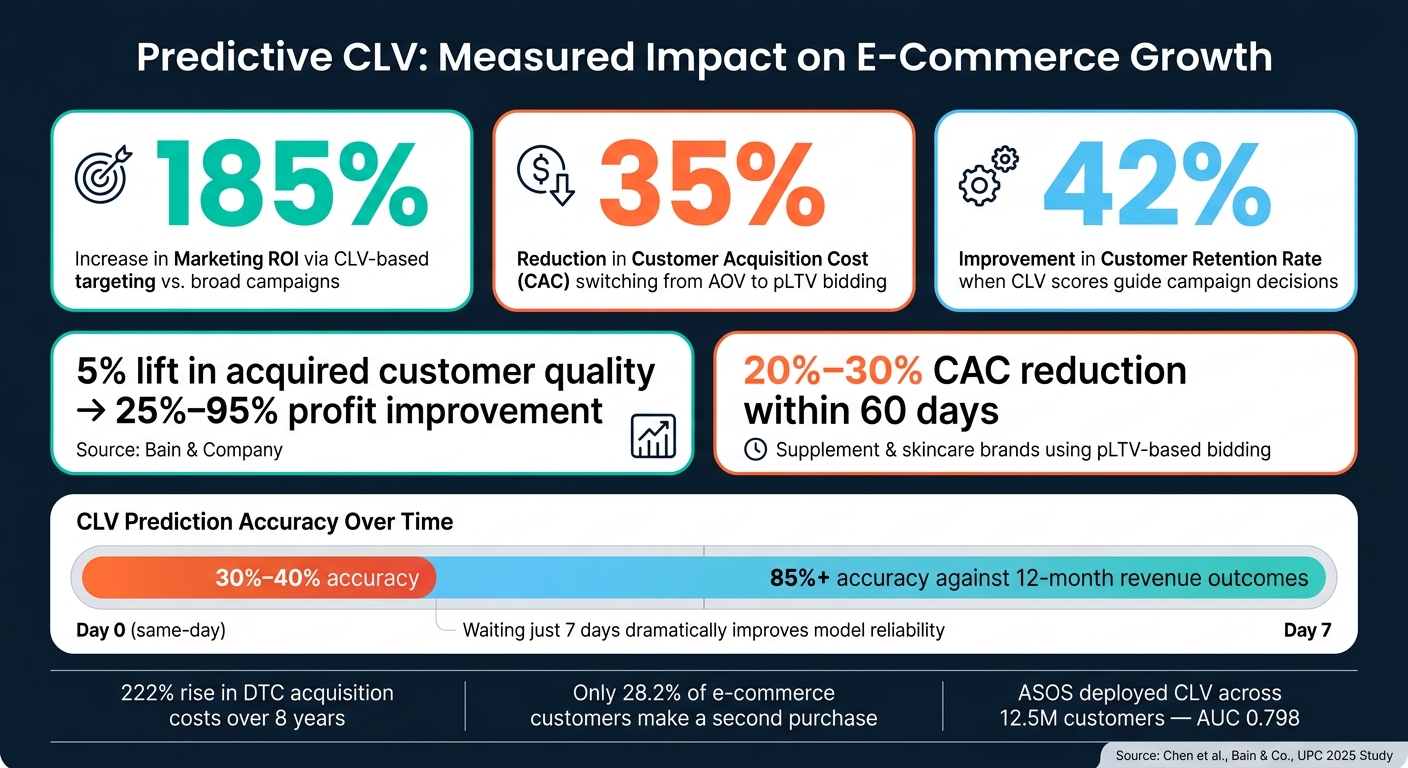
- This matters because DTC acquisition costs are up 222% over eight years, while only 28.2% of e-commerce customers make a second purchase.
- Research in the article links CLV-based decisions to 20% to 40% better marketing ROI, 35% lower CAC, and 42% better retention in some cases.
- The model type matters, but the article makes one thing plain: clean data and CRM use matter more than having a fancy score sitting in a dashboard.
- For many brands, XGBoost performs well on e-commerce data, especially once there is enough purchase history.
- I’d treat early scores as ranking signals, not exact revenue promises, because same-day prediction can be weak, while 7-day signals can reach 85%+ accuracy against 12-month revenue outcomes.
- The setup needs clean customer IDs, synced store and messaging data, regular retraining, and simple segments like high-value, at-risk, and due to reorder.
The article also shows where teams get stuck. In most cases, the problem is not the model itself. It’s split customer records, weak repeat-purchase history, missing order data, and stale scoring. That leads to wasted retention offers and poor audience targeting.
So if I had to sum it up in one line, it would be this: predictive lifetime value is most useful when it moves from reporting into CRM actions that change bidding, segmentation, and retention spend.
Predictive Analytics for Customer Retention & Lifetime Value | Churn Reduction, LTV Modeling| Uplatz
sbb-itb-2ec70df
What Research Says About CLV Prediction Models
Research usually splits CLV into two buckets: past reporting and future forecasting. That split matters more than it may seem at first glance, because the model you use shapes who gets retention budget, bid caps, and automated offers. In plain English, it changes how useful the score is inside your CRM.
Historical CLV vs. Predictive CLV
Historical CLV looks backward. It measures past revenue minus cost. Predictive CLV looks forward. It estimates the present value of expected future customer profit.
In day-to-day use, the difference is pretty simple: historical CLV tells you what a customer was worth, while predictive CLV helps decide what to spend next. That gap is what drives model design.
Core Model Types Used in E-Commerce
Research puts CLV models into two main families.
- Probabilistic models often rely on RFM data to estimate the chance of future transactions. They tend to weaken when repeat-purchase data is limited, especially in e-commerce stores that don’t have fixed renewal dates. That directly affects which customers a CRM can move to the top of the queue.
- Machine learning models take a broader view. They can use transaction history, browsing behavior, and other behavioral signals. Within this group, Gradient Boosting, especially XGBoost, shows the best performance on unseen data in structured e-commerce datasets.
A 2025 comparative study at the Universitat Politècnica de Catalunya found that XGBoost came out on top. Deep learning models such as Transformers and LSTM landed in the middle, and Random Forest ranked lower.
Research also shows a clear pattern in what drives prediction. Transaction count is the strongest predictor of CLV, followed by time between purchases and session duration. In machine learning models, monetary inputs such as total spend and average spend carry the most weight, while frequency and tenure add a smaller boost.
Of course, even a strong model won’t do much if the data underneath it is weak.
Accuracy, Data Needs, and Common Limits in Published Studies
Good CLV prediction depends on a few basic things: clean transaction records, enough repeat-purchase history to show patterns, and regular model updates. If that foundation is shaky, the output gets shaky too.
Poor data quality can lead to wasted retention spend and weaker segment targeting. Sparse data, shifts in buyer behavior, and infrequent retraining all drag down accuracy. There’s also a common bias problem: models can lean too hard toward existing high-frequency buyers and end up overvaluing established customers while overlooking newer customers with strong upside. The most direct fix is regular retraining on recent data.
The next challenge is less about modeling and more about execution: getting these scores into CRM workflows where teams can actually use them.
How CLV Predictions Work Inside CRM Systems
Once the model is accurate, the next move is activation inside the CRM. In plain English: get CLV scores into the system your team already uses every day.
How CLV Data Moves from Store Systems into the CRM
Store, email, and SMS data feed into one customer profile through a data pipeline. That part matters more than it sounds. One buyer may have placed orders with two email addresses or shopped across several devices. If identity matching is missing, the CRM ends up scoring split records instead of one actual customer.
After the pipeline creates clean, unified profiles, the machine learning model runs its predictions. It then writes values like Predicted CLV, Churn Risk, and next-order date back into CRM fields. Some CRMs show Historic CLV, Predicted CLV, and Churn Risk right on the customer profile.
Using CLV Scores for Segmentation, Automation, and Retention
Once those scores are in the CRM, the next step is segmentation by value and risk. A simple place to start is with three core groups:
- high-value customers
- at-risk customers
- customers due to reorder within 7 days
Each group should get different treatment. A customer with a high predicted CLV might get early access to a new product launch or a members-only bundle. A low-repeat buyer with a high churn risk score should go into a different flow, like a win-back sequence.
Replenishment triggers tend to work best when they fire 5–7 days before the next-order date. That timing reaches the customer when purchase intent is highest.
You can also send CLV scores back to ad platforms through conversion APIs, so bidding leans toward likely long-term value instead of just immediate ROAS. High-value CRM segments can then be pushed out as custom audiences, which gives the algorithm better signals for paid campaigns.
That’s the point where prediction starts doing actual work inside the business: more revenue, better retention, and stronger ROI.
Where Growth-onomics Fits In
Measured Impact on Revenue, Retention, and Marketing ROI
Predictive CLV Impact on E-Commerce Growth: Key Stats
When CLV scores are live inside CRM workflows, the business impact tends to show up fast: more revenue, stronger retention, and better payback through customer journey mapping. Studies also point to lower CAC and stronger marketing efficiency once teams stop using broad targeting and start acting on customer value signals.
Growth Outcomes Reported in Studies
Research found a 185% increase in marketing ROI when CLV-based targeting replaced broad campaign approaches, a 35% reduction in CAC when brands moved from AOV bidding to predictive LTV bidding, and a 42% improvement in customer retention rates when CLV scores guided campaign decisions. That’s a big shift. Instead of treating every new buyer the same, brands can push budget toward customers who are more likely to stick around and spend more over time.
Bain & Company reported that a 5% improvement in the quality of acquired customers can lead to a 25% to 95% profit improvement. In plain terms, even a small lift in who you bring in can have a major effect on profit. That’s why CLV often changes how teams think about acquisition in the first place.
Supplement and skincare brands saw a 20% to 30% CAC reduction within 60 days after switching to pLTV-based bidding. In those cases, early post-purchase signals helped push prediction accuracy to 85%+ against 12-month revenue outcomes by day 7 after acquisition. So while same-day prediction has limits, waiting just a few days can make the model much more useful.
At a much larger scale, ASOS rolled out a CLV prediction system across 12.5 million active customers in a business with £1.4 billion in annual revenue. The model used 132 features and reached an AUC of 0.798 for churn prediction. That helped the team spot which customers were worth nurturing and which were driving negative lifetime value because of high return rates. It’s a strong case for scale – but only if customer records are unified and the data stays current.
Benefits, Tradeoffs, and Adoption Barriers
The upside is clear, but there are limits. More often than not, the weak spot isn’t the model. It’s the data. Missing subscription rebill data, incomplete pre-migration history, and unsynced cross-channel orders can all hurt prediction accuracy.
| Impact Area | Observed Effect on Growth | Supporting Study | Limitations |
|---|---|---|---|
| Marketing ROI | 185% increase via CLV-based targeting | Chen et al. | Requires high-quality historical data |
| Acquisition Cost | 35% reduction in CAC | Chen et al. | Model complexity can create internal adoption barriers |
| Retention Rate | 42% improvement when CLV guides campaigns | Chen et al. | Accuracy depends on consistent ad click-ID capture |
There’s another issue worth calling out. Identity resolution errors tend to hit high-value customers the hardest, especially people who shop across channels and devices. If those records aren’t stitched together before scoring, the model can undercount your best buyers. And that’s the last group you want to misread.
For smaller brands, researchers suggest a simpler starting point: use CLV scores for relative ranking first. In practice, that means segmenting the top 10% of customers instead of treating predicted values like fixed revenue forecasts. It’s a smart move because same-day predictions are only 30%–40% accurate, while 85% accuracy usually needs a 7-day signal. That gap matters. A ranked view is often enough to guide targeting and retention work without leaning too hard on day-one precision.
Those results depend on a few basic things going right: clean IDs, recent transaction data, and regular retraining.
Practical Steps to Get Started and Key Takeaways
Once your model and CRM workflow are set up, it’s time to put them to work. That starts with clean data, simple segments, and tests you can track.
Minimum Data and KPI Setup Before Launch
Begin with clean, unified data covering 6–12 months of purchase history and at least 1,000 completed customer journeys. Each record should include a consistent Customer ID, order date in MM/DD/YYYY format, order value in U.S. dollars, product category, discount codes used, refund or return status, and acquisition source such as paid search, paid social, organic, or referral.
You’ll also want behavioral signals in the mix. That includes:
- Email opens and clicks
- Site visits
- Cart abandonment
- Tracking-email clicks
- Support interactions
For KPIs, keep your eye on the numbers that show whether CLV is helping the business. Track your LTV:CAC ratio, 90-day repeat purchase rate, CAC payback period, and revenue per customer by segment.
Once the data is in good shape, the next move is simple: stop at scoring alone, and start using those scores inside your workflows.
A Simple Rollout Plan for Small and Mid-Sized Brands
Start with a data quality audit. Remove duplicate records, fix missing values, and flag test or fraudulent orders before modeling begins. For stores with lower order volume, begin with a simple model. Move to XGBoost once your data volume can support it.
Next, send CLV scores into your CRM and build a few clear tiers – Champions, Potential Loyalists, and At-Risk – to trigger automation rules. Those tiers should connect to actual campaigns, such as VIP welcome series or win-back flows.
Then review monthly cohort trends and retrain the model every 90 days so it keeps up with seasonal shifts and changes in product mix. That rhythm matters. Customer behavior changes, and a stale model can drift fast.
After activation, the job isn’t done. You need to measure whether the new setup beats your old one.
How to Measure Results After Rollout
Test impact with geographic holdout groups or A/B tests that run for 60–90 days. Compare CLV-based campaigns against your baseline ROAS-centric approach. This gives you a cleaner read on whether CLV-driven decisions are making a business difference or just looking good in a dashboard.
For model validation, split older data so 70%–80% goes to training and 20%–30% goes to validation. Track MAE and keep monthly calibration error under 10%.
On the business side, focus on the outcomes that hit the bottom line:
- Incremental revenue
- Retention lift
- Reduced acquisition waste
- Changes in revenue per customer by cohort
Conclusion: What the Research Makes Clear
When CLV scores live inside a CRM and tie into live automation rules, they stop being just another reporting metric. They start shaping day-to-day decisions: who to bid on, who to retain, and where to cut spend.
The research points to a practical path: clean data, simple segments, and CRM-connected workflows. In plain terms, start with clean IDs, standardized U.S. dollar fields, MM/DD/YYYY dates, and a small set of CRM actions linked straight to CLV.
FAQs
How does predictive CLV differ from historical CLV?
Historical CLV looks at the past. It uses previous transactions to show what a customer has already brought in.
Predictive CLV looks ahead. It uses machine learning and statistical methods to estimate future revenue. That makes it useful for spotting customers who are likely to be worth more over time by looking at behavior, churn risk, and engagement.
What data do I need to start predicting customer lifetime value?
Start with clean, centralized data from your CRM, e-commerce platform, and web analytics tools. If you can, work with at least 1,000 active customer profiles and 18–24 months of transaction history.
That gives you enough data to spot patterns without guessing.
Focus on a few core inputs:
- Transactional data: purchase history, timestamps, unit prices, and quantity
- Demographic details and customer IDs
- Behavioral signals: browsing habits, email engagement, content preferences, and interaction frequency
Think of this as your raw material. If the data is scattered, outdated, or missing key fields, everything that comes after gets harder. But when your customer data sits in one place and stays clean, it becomes much easier to see who’s buying, how often they come back, and what tends to hold their attention.
How should I use CLV scores in my CRM?
Use CLV scores in your CRM to make day-to-day revenue calls, not just to fill reports.
Segment customers by predicted 12-month CLV so your team can focus on the accounts most likely to drive more profit. That makes it easier to prioritize high-value customers, tailor campaigns, and spend budget where it has the best shot at paying off.
CLV data also helps with the work that often gets missed in the daily rush. You can automate retention efforts, flag churn risk earlier, and make better calls on acquisition versus retention spend.
One more thing matters here: don’t look at revenue CLV alone. Pair CLV with gross margin so you’re working from gross-profit CLV, not just top-line revenue.