

Want to know which marketing channels actually drive growth? Here’s the secret: 90% of your results often come from just 10% of your efforts. Stop wasting time and money on underperforming platforms. Instead, focus on identifying and scaling the most impactful channels.
Here’s how you can do it in 5 steps:
- Set Goals & Define Your Audience: Know your objectives and who you’re targeting. Use SMART goals and buyer personas to align efforts with high-value channels.
- Gather & Organize Data: Centralize touchpoint data from tools like Google Analytics, CRM systems, and ad platforms for a complete view of performance.
- Analyze Conversion Paths: Understand how channels contribute to conversions, not just the last click. Use tools like GA4 to track and measure assisted conversions.
- Calculate ROI & Rank Channels: Measure financial returns for each channel. Focus on those delivering the best ROI and incremental revenue.
- Test, Optimize & Scale: Run small tests, monitor performance, and gradually scale top-performing channels while reallocating resources from weaker ones.
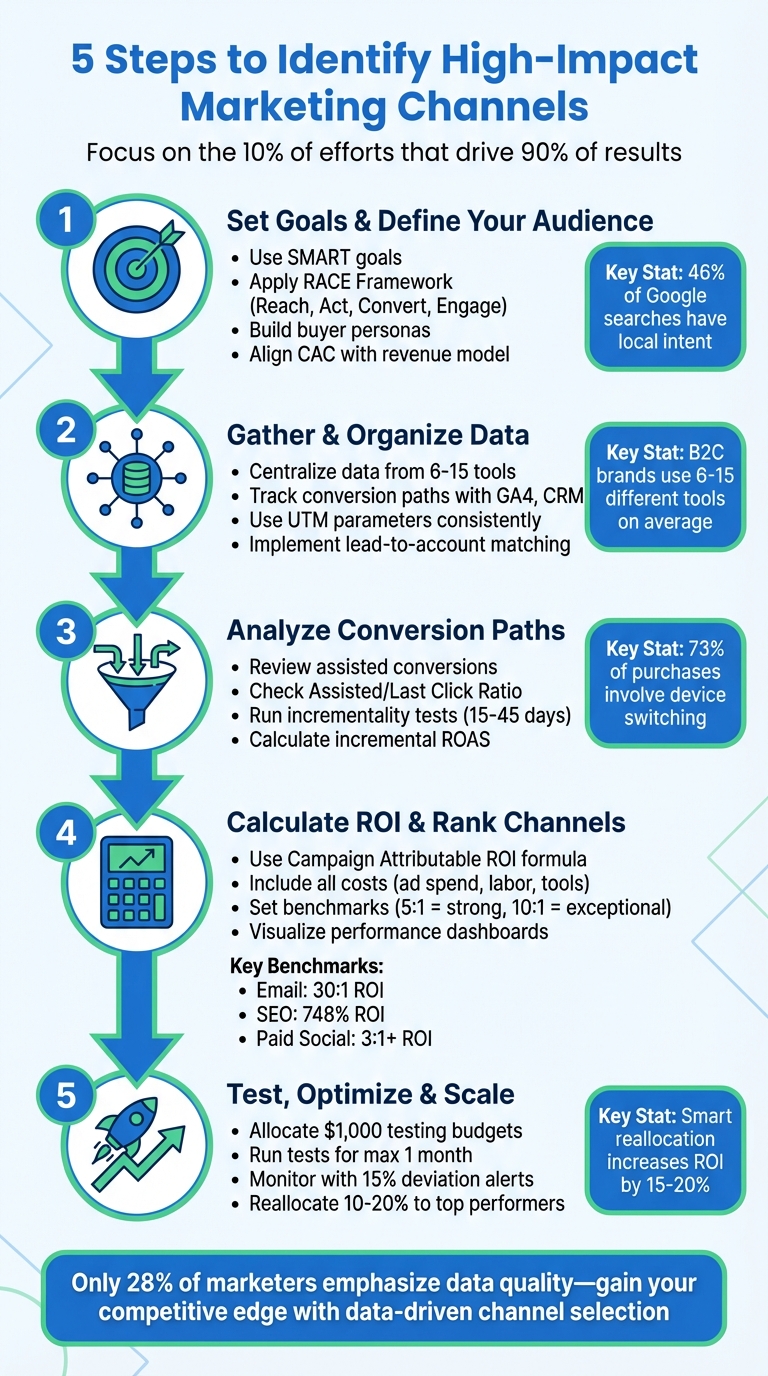
5-Step Framework to Identify High-Impact Marketing Channels
How to Choose the RIGHT Marketing Channels for Your Business
Step 1: Set Goals and Define Your Target Audience
Before diving into any marketing channel, it’s crucial to define your goals and identify your target audience. This step ensures your efforts are focused on the channels that will deliver the best results. Without clear objectives, marketing turns into a scattershot approach – inefficient and ineffective. As Michael Porter wisely said:
"The essence of strategy is choosing what not to do".
Spreading your resources too thin across multiple channels without a clear strategy is a quick way to burn through your budget.
Set Clear Objectives
Start by setting SMART goals and applying the RACE Framework, which breaks down objectives into four key stages: Reach, Act, Convert, and Engage. Here’s how it looks in practice:
| RACE Stage | Objective Example | Key Metric |
|---|---|---|
| Reach | Boost organic search traffic by 25% by Q4 | High-intent keyword rankings |
| Act | Generate 10,000 new leads through gated content | Lead conversion rate |
| Convert | Increase eCommerce sales by 20% using retargeting | Revenue/Conversion rate |
| Engage | Improve customer retention by 10% | Repeat purchase rate |
To ensure your goals are meaningful, apply the "So-What" Test. If a metric doesn’t influence your team’s decisions or improve performance, it’s not worth tracking. For instance, total website traffic isn’t very useful unless you’re also analyzing which traffic sources are driving paying customers.
It’s also essential to align your customer acquisition cost (CAC) with your revenue model. For example, if your Average Revenue Per User (ARPU) is $10 per month, high-cost channels like outbound sales may not be viable. Instead, focus on low-cost strategies like organic content or viral campaigns. On the other hand, if you’re selling enterprise software contracts worth $50,000, investing in account-based marketing or a dedicated sales team makes sense.
Brian Balfour, VP of Growth at HubSpot, offers this advice:
"Don’t diversify yourself in too many channels; it’s like a death sentence. You should be focusing on the single and most efficient one".
Build Buyer Personas
Once your objectives are clear, the next step is to understand where your audience spends their time. Create detailed buyer personas by combining demographic details, behaviors, and preferences. Use data from your CRM and website analytics to form a complete picture of your customers’ habits.
For example, in 2024, CURA of Sweden used the Cassandra platform to integrate data from all their marketing channels. This allowed them to pinpoint where their target audience was most active, leading to an 82% increase in conversions and a 16% reduction in CAC within just 60 days.
Similarly, in 2023, the performance marketing agency Journey Further automated their data collection process, saving over 500 hours per month. They adopted a question-driven approach, asking, “Which campaigns drove the most conversions last week and why?” This method helped them uncover which channels were most effective at attracting high-value customer segments.
Key insights for building personas:
- Nearly half (46%) of all Google searches have local intent, highlighting the importance of geography in audience targeting.
- 90% of Americans aged 18–49 use smartphones to shop online, a critical factor if mobile commerce is part of your strategy.
To get started, consolidate your data sources – connect tools like your CRM, email platforms, and ad networks into one central hub . Then, analyze traffic sources, engagement metrics, and conversion paths to map out your personas’ media habits. This process doesn’t just reveal who your audience is but also their behaviors – like which channels they prefer and the moments they’re most likely to convert.
With clear goals and well-defined personas in hand, you’re ready to move on to organizing and analyzing channel data in the next step.
Step 2: Gather and Organize Data from All Channels
Once your goals and personas are clearly outlined, it’s time to bring all your data together. Gathering information from every customer touchpoint is essential to understanding how your channels are truly performing. Without this consolidated view, decisions will be based on incomplete data. On average, B2C brands rely on 6–15 different tools to manage their customer interactions. Since each tool collects data differently, centralizing these inputs is key to gaining clarity. Let’s dive into how to track conversion paths and assign attribution effectively.
Track Conversion Paths
To track customer behavior effectively, you need the right tools in place. Platforms like Google Analytics 4 can monitor digital interactions, while CRM systems such as HubSpot or Salesforce log sales calls, meetings, and email communications. For businesses managing complex customer journeys across multiple devices and platforms, a Customer Data Platform (CDP) acts as a central hub, combining data using shared identifiers like email addresses or company domains.
Consistency is crucial for accurate tracking. Use standardized UTM parameters and a tag manager to ensure all domains are tracked seamlessly. For example, a Facebook ad might include utm_source=facebook, utm_medium=paid_social, and utm_campaign=spring_sale to clearly identify its source.
Don’t overlook offline interactions. In November 2023, the health supplement brand Happy Way used scannable QR codes and coordinated SMS reminders during Black Friday Cyber Monday. By logging every touchpoint into their unified system, they generated over $350,000 in tracked revenue. For B2B companies, implementing lead-to-account matching can connect individual contacts to their parent organizations, allowing you to track not just isolated users but the entire buying committee.
Once your data is unified, the next step is to ensure you’re properly crediting each touchpoint with the right attribution model.
Compare Attribution Models
After consolidating your data, it’s time to decide how to allocate credit for conversions. Attribution models vary in how they assign credit across the customer journey, and the right model for you will depend on your sales cycle and business objectives.
| Attribution Model | Credit Distribution | Best Use Case |
|---|---|---|
| First-Touch | 100% to the first interaction | Ideal for measuring brand awareness and top-of-funnel activities |
| Last-Touch | 100% to the final interaction | Useful for short sales cycles or identifying the final conversion driver |
| Linear | Equal credit to all touchpoints | Works well for long consideration cycles with multiple reinforcements |
| Time Decay | More credit to recent touchpoints | Effective for promotional campaigns or B2B cycles where recent interactions matter most |
| U-Shaped | 40% to the first and last interactions, 20% to the middle | Focuses on key "openers" and "closers" while valuing the overall journey |
| Data-Driven | Algorithmic, based on machine learning | Best for larger enterprises with high data volumes and real-time optimization needs |
As the Adobe Experience Cloud team puts it:
"According to Google, the days of a linear path from discovery to consideration to purchase are behind us".
Many brands are now turning to Data-Driven Attribution, which uses machine learning to dynamically assign credit based on actual customer behavior. Google Analytics 4 has adopted this as its default model, offering a 90-day lookback window for analysis.
For B2B companies with extended sales cycles, consider streaming Google Analytics 4 data into BigQuery. This approach allows you to bypass standard lookback limitations and analyze customer journeys spanning several months. The goal isn’t to find a “perfect” model but to choose one that aligns with your business goals and offers actionable insights to improve channel performance.
Step 3: Analyze Conversion Paths and Test Channel Impact
Now that your attribution model is set up, it’s time to dig deeper into how different channels work together to drive conversions. This step is all about understanding which channels genuinely drive growth, not just assigning credit for conversions. By analyzing how channels initiate, support, and close customer journeys, you’ll gain a clearer picture of their roles. From there, you can assess how each channel assists in the conversion process and test its direct impact.
Review Assisted Conversions
Conversions rarely happen in a single step. In fact, data shows that 73% of online purchases involve at least one device switch during the customer journey. Channels that assist in conversions – whether by building awareness or nurturing interest – may not get credit in a last-click attribution model, but they play a critical role in the process. Tools like GA4’s attribution reports can help you break down these contributions into Early (first 25%), Mid (middle 50%), and Late (last 25%) segments.
A helpful metric here is the Assisted/Last Click Ratio. If the ratio is greater than 1.0, the channel primarily supports other touchpoints rather than closing the sale. For example, channels with higher ratios are often more effective at driving awareness, while those with lower ratios tend to seal the deal.
As Shane Barker from ExpertBeacon points out:
"If you’re only using last-click attribution, you may be undervaluing the impact of channels like Facebook that drive awareness at the top of the funnel".
For products with longer decision-making cycles – like enterprise software or big-ticket items – set your lookback window to the maximum 90 days. This ensures you capture those early touchpoints that might otherwise be overlooked. GA4’s Top Conversion Paths report can also be a game-changer, as it visualizes the sequence of interactions (e.g., Organic Search > Email > Direct) leading to conversions. This helps you uncover patterns across different customer journeys.
Run Incrementality Tests
Understanding assisted contributions is just the first step. To truly measure a channel’s impact, you need to test its incremental value. While attribution shows which channels were involved in a conversion, incrementality testing reveals which channels actually caused it. This method relies on randomized controlled experiments to measure the "lift" a channel provides.
Here’s how it works: divide your audience into two groups – a treatment group that sees your ads and a control group that doesn’t. By comparing conversion rates between these groups, you can calculate the incremental revenue generated by your ads.
According to Google’s JD Ohlinger and Nik Nedyalkov:
"Incrementality testing has become the industry’s gold standard for understanding advertising’s true impact in a privacy-first way".
Google Ads simplifies this process with its Conversion Lift feature. You can choose between two types of tests:
- User-based tests: Ideal for smaller budgets and can be segmented by demographics.
- Geography-based tests: Better for larger campaigns and don’t rely on cookies. These tests exclude specific regions to create a clean comparison environment.
Typically, channel-level tests run for about 15 days, while prospecting tests may require 28–45 days. Once you’ve gathered the results, calculate your incremental ROAS (iROAS) by dividing incremental revenue by media spend. Comparing this with your platform-reported ROAS can reveal how much better the channel is performing than baseline metrics.
To ensure accurate results, schedule these tests in advance and avoid running multiple tests across different channels at the same time. Overlapping tests can skew the data. The ultimate goal is to pinpoint which channels are driving true growth so you can allocate your budget more effectively. With these insights into conversion paths and validated incrementality, you’ll be ready to calculate ROI and prioritize your channels.
sbb-itb-2ec70df
Step 4: Calculate ROI and Rank Channels
Now that you’ve completed your conversion path analysis and incrementality tests, it’s time to put that data to work. This step is all about turning raw numbers into actionable financial insights. By calculating ROI and visualizing how each channel performs, you’ll create a clear roadmap for smarter budget allocation.
Measure Key Metrics
Start with the basic ROI formula: (Revenue – Cost) / Cost × 100. While simple, this calculation can be misleading if it doesn’t account for what would’ve happened naturally. To get a clearer picture, use the Campaign Attributable ROI formula:
(Sales Growth – Organic Growth – Marketing Cost) / Marketing Cost × 100.
This method removes baseline growth – like a steady 4% monthly increase – so you’re measuring the true impact of your marketing efforts.
When calculating costs, make sure you include everything: ad spend, labor, creative production, software subscriptions, and platform fees. For instance, if your team spends 40 hours at $50/hour, that’s $2,000 in labor costs alone. For B2B or service-based businesses, estimate lead value by multiplying the number of leads by your historical conversion rate and average sale price.
Setting realistic ROI benchmarks is crucial. A 2:1 ROI might break even but often falls short after factoring in overhead and cost of goods sold. A 5:1 ROI is considered strong and scalable, while a 10:1 ROI is exceptional. Performance varies by channel: email marketing often delivers returns of 30:1 or more, SEO averages around 748% ROI, and paid social typically starts at 3:1, depending on creative quality and targeting.
You should also check iROAS (incremental ROAS) to measure additional lift from a channel. Compare this with platform-reported ROAS to understand how much incremental value the channel is driving beyond baseline performance. For channels with longer sales cycles, focus on Customer Lifetime Value (LTV) instead of immediate sales to get a full revenue picture. Even in declining markets, campaigns can deliver value. For example, if a $500 campaign reduces lost sales by $800, that’s still a 60% ROI.
Visualize and Rank Channels
Spreadsheets are helpful, but they only tell part of the story. Visual dashboards make it easier to spot trends and make quick decisions. Build a dashboard that tracks your channels across the entire funnel – from awareness to consideration to decision-making. Use consistent metrics to compare channels, such as:
- Efficiency (sustainable CAC/ROAS)
- Scalability (how well performance holds up as spend increases)
- Repeatability (lessons you can apply to future campaigns)
Your dashboard should highlight both micro and macro conversions, segmented by product, region, or customer type, so you can identify where potential customers drop off. Comparing attribution models like Linear and Last-Click side by side can also reveal the hidden value of channels that assist earlier in the journey but don’t get credit for closing sales. This visualization bridges the gap between analysis and actionable decisions.
Once you’ve got a clear picture, rank your channels into four categories based on risk and return:
- Always-on: Short payback, low risk – maintain and refine these.
- Test and Learn: Short payback, high risk – ideal for quick experiments.
- Long Term Investment: Long payback, high impact – requires patience and strategy.
- Deprioritized: Long payback, low impact – reduce or eliminate spend here.
This ranking system ensures your resources are allocated based on both current performance and future potential.
As Beacon, a marketing expert, puts it:
"Return on investment (ROI) is the most important key metric in your marketing toolbox. It tells you whether your marketing campaigns are actually moving the needle… producing real business value."
With your channels ranked, you’re ready to move on to the next step: optimizing and scaling your top performers.
Step 5: Test, Optimize, and Scale Top Channels
Now that you’ve pinpointed your best-performing channels, it’s time to take the next step: scaling them responsibly without blowing through your budget. This phase calls for careful planning, ongoing testing, and smart resource allocation.
Set Aside Testing Budgets
Before committing significant funds to a high-performing channel, you need to ensure it can handle increased spending without sacrificing returns. Testing new channels often comes with a learning curve. Algorithms need time to adjust, audiences must be fine-tuned, and messaging requires refinement. As Brittany Bingham, Interim CMO at Clockwise, notes:
"It’s not uncommon to launch a new channel for testing and see negative 30% to negative 70% against the return targets that you’ve set. Still, after optimization, the channel is highly performant for you at scale."
This process takes time, and early results can be misleading. If you pull the plug too soon, you might miss out on a channel with real potential. To manage this, keep your initial tests limited – allocate around $1,000 and run them for no longer than a month. After testing, drop the two weakest channels and concentrate your resources on the top performer. This focused strategy ensures your budget isn’t spread too thin.
Timing is another key factor. Align your tests with your budgeting cycles so you have the flexibility to scale if results are promising. Also, avoid running tests during periods of inflated costs – such as late November and December in the U.S. – as holiday competition can distort your data.
Monitor and Shift Resources
Once a channel proves its worth, the next step is scaling, but don’t rush. Gradually increase spending and keep a close eye on how it affects your returns. Short burst tests, lasting 1–3 days, can help you gauge audience response at higher spending levels and identify when you’re approaching saturation.
Set up automated alerts for any performance deviations greater than 15%. Regularly track key metrics like ROAS (return on ad spend), cost per acquisition, and conversion rates.
Here’s a common pitfall to avoid: relying solely on platform-reported data from giants like Google, Meta, or Amazon. These platforms are designed to showcase their own channels in the best light. Instead, turn to Marketing Mix Modeling (MMM) to get a clearer picture of cross-channel performance. For instance, social media often boosts the effectiveness of search ads. If you cut back on social, your search conversions might drop because you’ve lost that complementary "halo effect".
Start by reallocating 10–20% of your budget to the top-performing channels and measure the impact. Research shows that smart budget reallocation can increase marketing ROI by 15–20%. For example, one sausage brand saw its ROI double by using AI-powered analytics to identify and correct budget inefficiencies.
Linda Grönlund, Performance and Growth Marketing Manager at Supermetrics, sums it up well:
"Growth marketing analytics isn’t just about tracking numbers. It’s about uncovering the story behind the data."
By consistently monitoring and shifting resources, you can maximize returns while keeping your campaigns efficient.
Iterate and Scale with Growth-onomics
Scaling isn’t a one-and-done process. You’ll need to continuously test, learn, and adapt to maintain performance. If your ROI starts to plateau or decline, it’s time to revisit your testing framework and explore new channels or tactics. Since platform costs and audience behaviors change over time, staying flexible and iterative is critical.
This is where Growth-onomics’ Data Analytics services can make a difference. Scaling requires consolidating data from various sources – digital, traditional, and offline – into a single, unified view. Growth-onomics uses advanced Bayesian modeling and machine learning to analyze multi-channel effects in one dashboard. This approach helps answer critical questions like, “What happens if we shift 15% of our search budget to YouTube?”. With accurate forecasts, you can confidently decide where to allocate your next dollar.
Additionally, Growth-onomics helps identify the point of diminishing returns – the moment when increasing spend on a channel no longer delivers profitable ROI. This insight ensures you avoid oversaturating a channel and wasting valuable budget.
With a data-driven approach and a focus on continuous improvement, scaling your best channels becomes a sustainable and rewarding process.
Conclusion
Finding the most effective marketing channels isn’t about luck – it’s about following a methodical, data-driven approach. By applying the five steps we’ve discussed – setting clear goals, gathering detailed data, analyzing conversion paths, calculating ROI, and continuously testing and scaling – you can build a system where all your channels work in harmony rather than in isolation. This approach transforms fragmented efforts into a cohesive growth strategy.
Instead of trying to do everything, focus on doing a few things exceptionally well. Concentrating your resources on 2–3 high-performing channels will almost always yield better results than spreading your efforts thin across every platform. After all, many successful companies find that the majority of their growth – about 90% – comes from just 10% of their efforts. It’s a clear case where less is more.
Interestingly, only 28% of marketers currently emphasize data quality in their strategies, leaving plenty of room for others to gain an edge. At the same time, 42% of marketers are gearing up to invest in A/B testing and campaign experimentation by 2025. These trends underline the importance of adopting a data-backed approach to channel selection – one that ties directly to performance metrics and insights.
This is where Growth-onomics’ Data Analytics and Performance Marketing services can make a real difference. They specialize in turning scattered marketing efforts into a unified growth engine. Whether it’s consolidating data from multiple touchpoints or pinpointing when your campaigns hit diminishing returns, their tools and expertise help you go beyond just tracking numbers. Instead, you’ll uncover the stories hidden in your data, enabling smarter, more impactful decisions.
Take the guesswork out of your marketing strategy. Let the data guide you, and focus on perfecting the channels that truly drive your business forward.
FAQs
How can I identify the most effective marketing channels for my business?
To figure out which marketing channels are making the biggest impact, start by breaking down how each one plays a role in your customer journey. Map out every interaction – whether it’s the first click, a social media ad, or the final purchase – and track key metrics like CTR (click-through rate), conversion rate, CAC (customer acquisition cost), and ROAS (return on ad spend). Attribution models, such as first-touch, last-touch, or time-decay, can help you pinpoint both immediate and assisted contributions from each channel.
Then, take a close look at the costs involved. Compare things like ad spend and production expenses against the revenue each channel generates. This will help you identify which ones are profitable and which might be falling short. To ensure your analysis is solid, benchmark your results against industry standards – this can also reveal untapped opportunities.
Don’t overlook underused channels. Test them with clear goals, precise targeting, and a reliable plan to measure success. Based on performance, adjust your budgets as needed. Make it a habit to revisit your strategy every quarter, so you can keep refining and driving growth.
What mistakes should I avoid when scaling successful marketing channels?
When growing a successful marketing channel, it’s easy to stumble into mistakes that can slow progress. Resist the urge to use the same strategy across all platforms. Each channel has its own quirks – different audience behaviors, creative formats, and bidding systems. Trying to force one method onto every platform often leads to wasted effort and resources.
Take your time testing before scaling up. Jumping into large budget allocations without enough data can result in poor choices and unnecessary spending. And while it’s tempting to follow the latest trends, don’t assume every popular channel is right for your business. What works for others may not align with your audience or goals.
Set achievable performance benchmarks as you expand. New channels often take time to show results, so patience and realistic expectations are key. Also, make sure you have accurate measurement and attribution systems in place. This allows you to track performance properly and adjust as needed. Finally, adapt your creative assets to suit the specific channel. A careful, data-informed strategy will ensure your efforts focus on the channels that genuinely deliver results.
How can I effectively measure the ROI of my marketing channels?
To gauge the ROI of your marketing channels, start by determining the revenue each channel brings in and subtracting the associated marketing costs, such as ad spend, salaries, and software expenses. The formula looks like this: ROI = ((Revenue – Marketing Cost) / Marketing Cost) × 100. For instance, if you spend $1,200 on a campaign that generates $4,500 in sales, your ROI would be 275%.
From there, choose an attribution model that matches your customer journey. Options like first-touch, last-touch, or time-decay can help distribute credit more accurately across various touchpoints. Analytics tools can simplify this process by automating data collection and ROI calculations. Lastly, make it a habit to review and refine your strategy. Shift budgets toward the channels delivering the best returns or experiment with new tactics. This ongoing process helps you make smarter, data-driven decisions to fuel growth.