

Predictive models transform raw data into actionable insights for niche marketing campaigns. By analyzing historical data, they help businesses predict customer behavior, optimize budgets, and improve ROI with white label performance services. The process involves five steps: data collection, feature engineering, algorithm training, forecasting, and strategy refinement.
For niche campaigns, engineered features – like purchase frequency, seasonal trends, or engagement rates – are critical. These features enable precise targeting and personalization, even with limited data. Behavioral, demographic, and contextual features form the foundation, while advanced techniques like time-based signals and managing data imbalance ensure accuracy.
Key takeaways:
- Feature Types: Behavioral (user actions), demographic (static attributes), and contextual (timing and external factors).
- Feature Engineering: Focus on high-impact transformations and causal relationships to improve model precision.
- Data Imbalance: Use methods like SMOTE and class weighting to address skewed datasets.
- Evaluation Metrics: Metrics like R², MAE, and SHAP analysis help measure feature performance and pinpoint what drives results.
What is Feature Engineering (and Why is It So Tricky)?
sbb-itb-2ec70df
Main Feature Types in Predictive Models for Niche Marketing
Three Main Feature Types in Predictive Models for Niche Marketing
Behavioral, Demographic, and Contextual Features
Predictive models rely on three main types of features to deliver insights. Behavioral features track user actions like page views, email clicks, purchase patterns, and content downloads. But it’s not just about raw numbers – features like "transaction growth rate" are far more effective than simple counts. For instance, using growth rates instead of raw transaction data can improve forecasting accuracy by up to 22%.
Demographic and firmographic features serve as the static backbone of these models. Think job titles, company size, industry, geographic location, and account age. These attributes help filter leads to align with the ideal customer profile. For datasets with high-cardinality categories (e.g., hundreds of niche product types), techniques like target encoding with smoothing can prevent overfitting while maintaining predictive strength.
Contextual and temporal features add depth by capturing the "when" and "why" of user behavior. Metrics like "content downloads per week" or "days since first visit" fall into this category, helping identify when a user is ready to convert. Properly structuring temporal data – like using behavior from 37 to 7 days ago to predict today’s actions – avoids data leakage, which can otherwise drop model precision from 0.89 to 0.61 in production. These features are crucial for fine-tuning campaigns to achieve higher precision.
Here’s a quick summary of how these features contribute to niche marketing campaigns:
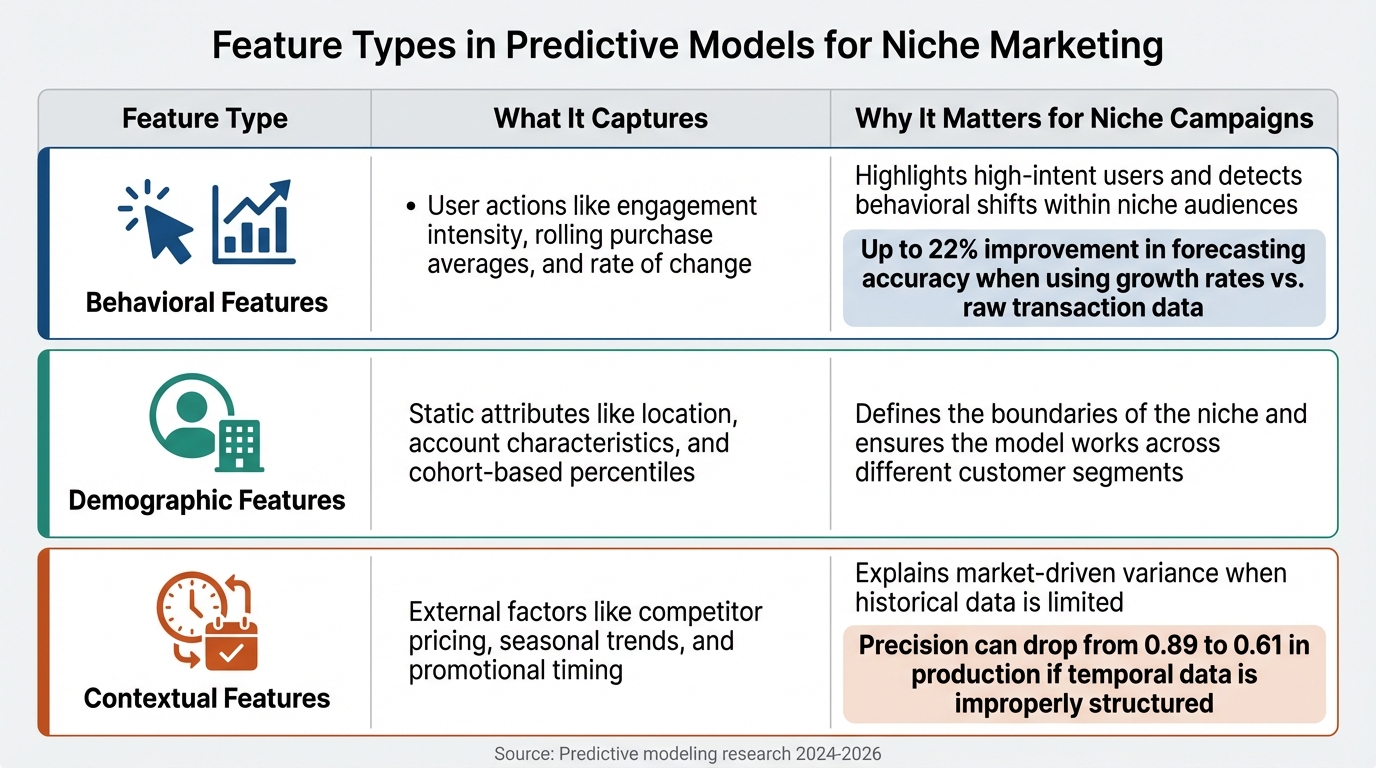
| Feature Type | What It Captures | Why It Matters for Niche Campaigns |
|---|---|---|
| Behavioral | User actions like engagement intensity, rolling purchase averages, and rate of change | Highlights high-intent users and detects behavioral shifts within niche audiences |
| Demographic | Static attributes like location, account characteristics, and cohort-based percentiles | Defines the boundaries of the niche and ensures the model works across different customer segments |
| Contextual | External factors like competitor pricing, seasonal trends, and promotional timing | Explains market-driven variance when historical data is limited |
How Feature Engineering Improves Campaign Precision
Feature engineering takes these foundational types and transforms them into powerful tools for predictive accuracy. Skilled engineering can significantly boost a model’s precision. Interestingly, while data scientists often spend 60% of their time on transformations that yield minimal improvements, the focus is shifting. By 2026, the emphasis will be on identifying 12 to 15 high-impact transformations that capture 94% of the predictive signal.
Focusing on causal relationships rather than simple correlations makes a big difference – boosting accuracy by 14%. For example, instead of merely noting that sales spike on Fridays, you could create a feature like "promotion_interaction_weekday" to capture how promotional effectiveness changes depending on the day. This approach is especially valuable for niche campaigns, where data can be sparse, and understanding the "why" behind patterns is critical.
When AI-powered predictive lead scoring uses well-engineered features, conversion rates can improve by 40–60% compared to traditional rule-based systems. By designing features that reflect the unique behaviors of your target audience, you enable your model to "see" patterns that would otherwise remain hidden. This level of precision can transform the effectiveness of niche marketing campaigns.
Methods for Creating and Refining Features in Niche Campaigns
Crafting and fine-tuning features is a key step in building accurate predictive models for niche campaigns. By transforming raw data into meaningful insights, these methods can lead to better conversion rates and higher ROI.
Using Aggregated Customer Behavior Data
Feature engineering thrives on a mix of expertise and intuition. As Mobilewalla explains:
"Feature engineering represents the artistic and intuitive side of data science".
While algorithms are powerful, they need guidance to focus on the attributes that matter most. For niche campaigns, especially those with limited first-party data, combining internal customer data with third-party sources can help predict behavior more effectively. Notably, 80% of marketers globally trust third-party data providers as a reliable source of consumer insights.
To enhance your model’s performance, track feature importance scores to pinpoint which custom metrics drive results. Aggregated metrics, such as quarterly average purchase value or 30-day engagement levels, can provide a clearer picture of customer behavior. When dealing with high-cardinality data (like extensive product catalogs or unique user IDs), feature hashing is a practical solution. It maps categories into fixed-length vectors, which saves memory and improves scalability.
Once your data is enriched, the next step is to incorporate time-based insights.
Adding Time-Based and Seasonal Features
Time-based features can unlock patterns related to recency, seasonality, and lifecycle stages. Tullie Murrell of Shaped highlights their potential:
"Timestamps hold far more value than just marking when an event occurred, they encode powerful signals like recency, seasonality, user lifecycle, and content freshness that can significantly boost the performance of recommendation and search systems".
Before extracting time-based features, standardize all timestamps to Coordinated Universal Time (UTC) to ensure consistency across calculations.
For cyclical data, such as hours of the day or months of the year, use sine and cosine transformations to reflect their continuous nature (e.g., hour 23 is adjacent to hour 0). Boolean flags like is_weekend, is_holiday, or is_promotion_active can also provide clear, actionable signals. For niche campaigns, consider creating custom flags for events like paydays, school terms, or industry-specific cycles. Rolling statistics, such as 14- or 28-day averages, can help smooth out short-term fluctuations while highlighting long-term trends. To avoid data leakage, validate these features using rolling-origin cross-validation rather than random splits.
With time-based features in place, the next challenge is addressing the issue of data imbalance.
Managing Imbalanced Data in Niche Markets
Niche campaigns often face severe data imbalances, where the target audience might represent just 1% (or less) of the dataset. A model could achieve high accuracy by always predicting the majority class, yet fail to identify the niche audience. To counter this, use SMOTE (Synthetic Minority Over-sampling Technique) to generate synthetic samples rather than simply duplicating data. Additionally, adjusting class weights (e.g., using class_weight='balanced' in random forests) ensures that misclassifications of the minority class carry more weight.
Instead of relying on accuracy, evaluate your model using metrics like Precision, Recall, F1-score, or AUC-ROC, which are better suited for imbalanced datasets. A hybrid approach combining SMOTE with light undersampling can balance the data without introducing overfitting. Stratified cross-validation is another essential step, ensuring the niche audience is proportionally represented in both training and testing sets. For extreme imbalances (e.g., a 1:10,000 ratio), treat the niche group as outliers and explore methods like Isolation Forests or one-class SVMs.
These strategies can help ensure that even the smallest segments of your audience are accurately identified and targeted.
Measuring Feature Performance in Predictive Models
Once you’ve built your features, the next step is figuring out which ones make the biggest impact. This goes beyond just looking at accuracy scores – you need to understand how each feature contributes to your model’s predictions and why.
Using Model Evaluation Metrics
Standard accuracy metrics often fall short when used in specialized campaigns. Instead, combining metrics like R², MAE, and WMAE provides a clearer picture of model performance. For instance, R² (R-squared) shows how much of the variance in your data is explained by the model. In a January 2026 retail forecasting study by the University of Texas at Austin MSBA program, analysts found that an XGBoost model achieved an impressive R² of 0.95, while a simpler Ridge Regression model explained 82% of sales patterns.
Metrics like Mean Absolute Error (MAE) further help by quantifying the average prediction error in measurable terms, such as dollars or conversions. Adding a Weighted Mean Absolute Error (WMAE) – which penalizes errors more heavily during critical periods like holiday weeks (by a factor of 5x) – can make your evaluation even more reliable.
To dig deeper into feature importance, SHAP (SHapley Additive exPlanations) analysis is invaluable. Simoni Dalal from the University of Texas at Austin explains:
"SHAP assigns a contribution value to every feature for every prediction… [answering] How much did this feature push predicted sales up or down, holding everything else constant?"
For example, SHAP analysis during high-activity periods showed that Markdown 3 delivered an ROI of 0.1036 – meaning every $1 spent boosted weekly sales by $0.1036. On the other hand, Markdown 2 and Markdown 5 underperformed, suggesting a need to shift budget allocations.
These metrics and tools set the foundation for actionable insights drawn from real-world examples.
Case Studies: Feature Success in Niche Campaigns
In January 2026, a team of five analysts examined weekly retail sales data for a highly specific product category. They engineered features such as sales momentum (using lagged sales metrics and 4-week rolling averages), volatility (e.g., 4-week rolling standard deviations), and seasonality indicators, alongside five anonymized markdown promotions. By combining XGBoost with SHAP analysis, they moved beyond simple predictions to identify which lead generation strategies were truly effective.
Their analysis revealed a critical insight: as Dalal put it:
"Promotions don’t create demand from scratch – they amplify or suppress existing demand/trends"
By accounting for factors like seasonality and volatility, the team isolated the actual impact of promotions. They found that Markdown 3 and Markdown 4 delivered positive ROI, while two other markdowns underperformed, prompting a reallocation of resources.
The team also emphasized the importance of simplicity and clarity in model development. As Dalal noted:
"Marketing analytics isn’t about building the most complex model – it’s about interpretability and clarity"
They started with a straightforward linear model to validate feature quality before advancing to XGBoost. Importantly, they avoided over-ensembling by mixing their best model with weaker ones, recognizing that this often dilutes performance.
This case study highlights how careful feature evaluation can drive success in niche campaigns, reinforcing the importance of tailored feature engineering for achieving impactful results.
Conclusion
Predictive models take the guesswork out of planning and turn it into precise strategies. By crafting targeted features using behavioral, demographic, and contextual data, businesses can zero in on high-intent audiences, predict ROI, and fine-tune their budgets. For niche campaigns with limited data, carefully designed features become even more essential. The ability to shift from reactive campaigns to proactive growth often hinges on how well these features are developed and analyzed.
Combining customer data with time-based signals and using ensemble methods to handle data imbalance can yield impressive results. These approaches have been shown to boost revenue by 5–15%. For example, Twinings leveraged a predictive model to optimize channel spending and maintain profitability.
To ensure these features deliver results, robust evaluation metrics are key. Metrics like marginal ROI, conversion rates, and propensity scores help pinpoint which features truly impact performance.
Looking ahead, hyper-personalization and privacy-focused techniques are set to shape the future of niche marketing. With programmatic ad spending in the U.S. expected to hit $270 billion by early 2025, companies that excel in feature engineering will gain a competitive edge in crowded markets.
Start by consolidating your data sources, experimenting with different scenarios, and connecting spending to performance outcomes. Whether you’re predicting customer lifetime value, optimizing your media mix, or triggering ads based on unique signals like weather patterns, engineered features offer the clarity needed to make informed decisions and drive sustainable growth.
FAQs
What features matter most when my niche campaign has very little data?
When you’re working with limited data, zero in on domain-specific features such as customer tenure, transaction trends, and engagement levels. These details can uncover early behavioral clues. Incorporating time-based metrics like recency, frequency, and monetary (RFM) scores can also make a big difference. On top of that, behavioral features – like how often sessions occur or the intervals between transactions – can highlight patterns, such as a drop in activity. These insights are especially helpful for boosting model performance in targeted campaigns where data is scarce.
How do I prevent data leakage with time-based features?
To avoid data leakage when working with time-based features, always split your data chronologically. This means ensuring that the training data comes from earlier time periods, while validation and test data represent later periods. When creating lagged features, make sure to use only past data – never incorporate information from the future.
It’s also a good idea to regularly review your feature engineering process to double-check that no future data inadvertently influences model training. Following these practices helps safeguard your model’s integrity and prevents target leakage.
Which metrics should I use for imbalanced niche audiences?
When dealing with imbalanced niche audiences, traditional accuracy metrics can be misleading since they often favor the majority class. Instead, consider using Precision, Recall, and the F1 Score to better address the needs of the minority class.
- Recall: This metric is crucial for identifying at-risk customers or individuals, ensuring you catch as many relevant cases as possible.
- Precision: By focusing on minimizing false alarms, Precision helps you maintain efficiency and avoid unnecessary actions.
- F1 Score: This metric strikes a balance between Precision and Recall, offering a more comprehensive view of performance.
Additionally, tools like AUC-ROC and the Precision-Recall Curve provide valuable insights into how well your model performs in these challenging scenarios. They’re particularly useful for understanding trade-offs and overall effectiveness in handling imbalanced datasets.