
Hierarchical clustering is a machine learning method that helps businesses group customers based on shared traits, without needing to predefine the number of groups. It creates a tree-like structure (dendrogram) to visualize relationships and identify natural clusters. This technique is especially useful for customer segmentation, enabling companies to tailor marketing strategies and improve outcomes like revenue growth, cost efficiency, and customer retention.
Key points:
- Two approaches: Agglomerative (bottom-up) and divisive (top-down), with agglomerative being more common due to practicality.
- Steps: Calculate distances between data points, merge or split clusters, create a dendrogram, and decide where to cut it for final segments.
- Metrics: Distance metrics (e.g., Euclidean, Manhattan) and linkage methods (e.g., Ward’s, average) shape how clusters form.
- Applications: Combine behavioral and demographic data for actionable insights, like identifying high-value customer groups.
- Comparison: Hierarchical clustering is ideal for small-to-medium datasets, while K-means suits larger datasets due to speed and scalability.
Hierarchical clustering is a reliable way to analyze customer data and create personalized strategies, but it requires careful selection of metrics and methods to ensure meaningful results.
Customer Segmentation Using Hierarchical Clustering Machine Learning Algorithm in Python – Sklearn

How Hierarchical Clustering Works
Let’s break down how hierarchical clustering works when it comes to segmenting customers.
The process involves four main steps. First, the algorithm calculates the distance between every pair of customers in your dataset, creating a distance matrix. This means it measures how similar or different each pair of customers is. Next, based on the chosen approach (which we’ll get into shortly), the algorithm either merges smaller clusters or splits larger ones. Third, it keeps track of these merges or splits in a dendrogram – a tree-like diagram where the height of each branch reflects the distance at which clusters are joined. Finally, you decide where to cut the dendrogram horizontally to form your final customer segments.
One important tip: if your data includes features with varying scales, standardize it first (for example, using z-score normalization). Without this step, features with larger numeric ranges could overpower the distance calculations, leading to skewed results.
Agglomerative vs. Divisive Clustering
There are two main approaches to hierarchical clustering: agglomerative and divisive.
- Agglomerative clustering works from the bottom up. It starts with each customer as its own cluster and then merges the most similar clusters step by step until everything is grouped into one hierarchy. This method is popular because it’s efficient at finding smaller, detailed customer segments.
- Divisive clustering, on the other hand, takes a top-down approach. It begins with all customers in a single group and divides them into smaller, more distinct clusters. While this method can better capture the overall structure of your data, it’s computationally expensive, which is why it’s less commonly used.
Understanding Dendrograms
A dendrogram is the visual output of hierarchical clustering, resembling a branching tree. On the horizontal axis, you’ll find individual customers (or data points), while the vertical axis measures the distance or dissimilarity between clusters. When two clusters merge, they are connected by a horizontal “U”-shaped line. The height of this line tells you how different the clusters are – taller branches mean greater dissimilarity.
To finalize your customer segments, you’ll need to cut the dendrogram at a certain level. The number of vertical lines that your cut intersects determines the number of clusters. Large vertical gaps in the dendrogram, unconnected by horizontal lines, often reveal natural divisions in the data. To ensure your segmentation is solid, you can pair this visual analysis with statistical tools like Silhouette Analysis to validate that your clusters are distinct and meaningful.
Understanding these steps is key, but mastering the distance metrics and linkage methods behind the clustering process will take your customer segmentation to the next level.
Distance Metrics and Linkage Methods
Now that we’ve covered how hierarchical clustering creates its tree structure, it’s time to dive into the technical details that shape customer segments: distance metrics and linkage methods. These elements are the backbone of clustering, influencing how customers are grouped together.
Distance Metrics
Distance metrics are used to measure how alike or different two customers are based on their data. The right metric depends on the kind of data you’re analyzing.
- Euclidean distance: This is the go-to metric for numerical data, like age or income. It calculates the straight-line distance between two points, much like measuring the physical distance between two spots on a map. Its simplicity and effectiveness make it the default for continuous variables.
- Manhattan distance: Also known as city block distance, this metric sums up the absolute differences between coordinates, mimicking movement along a grid (think city streets). It’s particularly useful when your data reflects grid-like patterns or constrained movement.
- Correlation distance: Instead of focusing on absolute values, this metric looks at patterns. It measures whether two customers’ behaviors rise and fall together, regardless of the actual amounts. For example, one customer might spend $500 monthly and another $50, but if their spending follows the same seasonal trends, correlation distance will group them. It does this by calculating 1 minus the Pearson correlation coefficient.
For categorical data, there are specialized metrics:
- Hamming distance: Counts mismatches between labels, making it ideal for "Yes/No" survey responses.
- Jaccard distance: Works well with binary attributes.
- Cosine similarity: Often used in text analysis, this measures the angle between vectors rather than their magnitude.
One important note: distance metrics are sensitive to scale. If you’re clustering based on age (18 to 80) and income ($20,000 to $200,000), income will dominate unless you standardize your data. Using techniques like z-score normalization can help level the playing field.
Once you’ve defined how to measure distances, the next step is determining how clusters should connect.
Linkage Methods
Linkage methods decide how to measure the distance between clusters, shaping the overall structure of your segments. This choice impacts whether your clusters are compact, evenly sized, or stretched out.
"The sensible default"
Ward’s method, described by Tim Bock, Founder of Displayr, as the "sensible default", minimizes within-cluster variance. In other words, it creates tight, compact groups where customers are as similar as possible to others in their segment. This method often results in clusters of similar sizes, making them easier for marketing teams to target.
Other common linkage methods include:
- Average linkage: This calculates the mean distance between all pairs of customers in two clusters, offering a balanced approach that’s less affected by outliers.
- Single linkage: Focuses on the minimum distance between any two customers in different clusters. While useful for identifying outliers, it can lead to "chaining", where clusters form long, thin lines instead of distinct groups.
- Complete linkage: Takes the maximum distance between customers, resulting in compact, ball-shaped clusters. However, it can be overly sensitive to outliers.
| Metric/Method | Ideal Use | Cluster Effect |
|---|---|---|
| Euclidean | Numerical data (Age, Income) | Groups based on magnitude differences |
| Correlation | Behavioral patterns (Spending cycles) | Groups by trend similarity |
| Hamming | Categorical data (Yes/No responses) | Groups based on matching labels |
| Ward’s Linkage | General segmentation | Creates compact, evenly sized groups |
| Single Linkage | Identifying outliers or chains | Can lead to trailing, poorly defined clusters |
The combination of distance metric and linkage method matters. As Bock advises:
"The choice of distance metric should be made based on theoretical concerns from the domain of study. That is, a distance metric needs to define similarity in a way that is sensible for the field of study."
For example, if you’re segmenting customers by spending behavior over time, using correlation distance with Ward’s linkage is a strong choice. On the other hand, for demographic data like age and income, Euclidean distance paired with Ward’s method often works best. These decisions directly influence cluster structure and, ultimately, the effectiveness of your segmentation strategy.
Using Hierarchical Clustering for Customer Segmentation
This section dives into how businesses use hierarchical clustering to turn raw customer data into actionable marketing strategies that drive results.
Grouping Customers by Behavior and Demographics
Hierarchical clustering is particularly effective at combining varied data types to build rich, multi-dimensional customer profiles. A great example of this is a project led by data scientist Emine Bozkus in December 2022. Working with Turkish retailer FLO, she analyzed data from 19,945 OmniChannel customers collected between 2020 and 2021. Using hierarchical clustering on 12 variables – including tenure, recency, frequency, and monetary value – she leveraged the Scipy library to generate dendrograms. These visual tools helped FLO identify distinct behavioral clusters and design targeted marketing strategies.
This method is versatile, allowing businesses to integrate RFM analysis (Recency, Frequency, Monetary) with demographic details like age and income, along with behavioral patterns such as purchasing habits and brand loyalty. The dendrogram structure visually highlights natural groupings, making it easier to align clusters with actual customer behaviors.
"Hierarchical clustering has the advantage of not requiring a predefined number of clusters. Instead, analysts can use the dendrogram to determine the best clustering solution based on the height at which distinct clusters emerge." – Anita Rostami
In another example, researcher Anita Rostami used Agglomerative Hierarchical Clustering in a 2024 retail analytics project. Analyzing a Mall Customer dataset of 200 observations, she segmented customers into five groups based on Annual Income and Spending Score. Using Euclidean distance and Ward linkage, the analysis achieved a silhouette score of 0.5530 and a Davies-Bouldin Index of 0.5782, both indicators of strong cluster quality. These insights enabled more precise marketing efforts tailored to mall shoppers.
Once customer clusters are clearly defined, businesses can move seamlessly into creating personalized strategies.
Creating Personalized Marketing Strategies
After identifying distinct customer groups, businesses can craft marketing strategies tailored to each segment’s unique needs and preferences. For instance, a study titled "Momentive study: credit card users weigh costs and perks" segmented credit card users into four personas using hierarchical clustering:
- "Economical End-Users": Older, risk-averse customers who prefer no annual fees.
- "Untapped Utilizers": Lower-income users unfamiliar with card benefits.
- "Strapped Spenders": Younger customers with high usage but limited disposable income.
- "Card Champions": High-income Millennials maximizing travel rewards.
This segmentation allowed credit card companies to address specific pain points – offering cash-back incentives for "Untapped Utilizers" and travel bonuses for "Card Champions" – while customizing content and outreach frequency for each group.
The same principle applies across industries. For example, a beer brand segmentation study identified three key customer segments: Premium/Imported brands like Heineken and Becks (high cost and alcohol content), Mainstream brands like Budweiser and Coors (moderate cost and alcohol), and Light/Health-conscious brands like Miller Lite (low calories and sodium).
Measurable Business Results
The true value of customer segmentation lies in its ability to deliver measurable business outcomes. Hierarchical clustering helps companies focus their efforts where it matters most – driving revenue, cutting costs, and improving retention.
| Business Outcome | Benefit | Example Application |
|---|---|---|
| Revenue Growth | Identify high-value segments for premium offerings | Target "Card Champions" with travel rewards programs |
| Cost Optimization | Focus marketing spend on high-potential customers | Reduce wasted ad spend on low-engagement segments |
| Retention Improvement | Detect at-risk customers through RFM patterns | Launch win-back campaigns for declining spenders |
| Product Development | Understand unmet needs within specific segments | Develop products for "Untapped Utilizers" unfamiliar with benefits |
This approach can scale to accommodate customer bases ranging from 10,000 to over a million. However, it’s important to note that segmentation isn’t a one-and-done process. Models need to be updated regularly to reflect new data and shifting trends, ensuring they remain effective.
sbb-itb-2ec70df
Hierarchical Clustering vs. K-Means Clustering
Hierarchical Clustering vs K-Means: Key Differences for Customer Segmentation
When deciding between hierarchical clustering and K-means clustering, the choice often hinges on factors like dataset size, available computing power, and whether you already know how many clusters you need.
K-means clustering requires you to specify the number of clusters upfront. It’s known for being fast, thanks to its linear complexity (O(n)), making it a go-to option for very large datasets. However, its reliance on random initialization can lead to different results across multiple runs, which may be a drawback in some scenarios.
On the other hand, hierarchical clustering doesn’t require you to predefine the number of clusters. Instead, it creates a dendrogram, which visually represents the natural groupings within the data. This makes it particularly useful during the exploratory phase, such as when analyzing customer data for the first time. That said, hierarchical clustering comes with a trade-off: it’s computationally intensive, with complexity ranging from O(n²) to O(n³) due to the need to compute and store a full n×n distance matrix. As a result, it’s not practical for very large datasets.
Here’s a quick comparison of the two methods:
Key Differences Between Methods
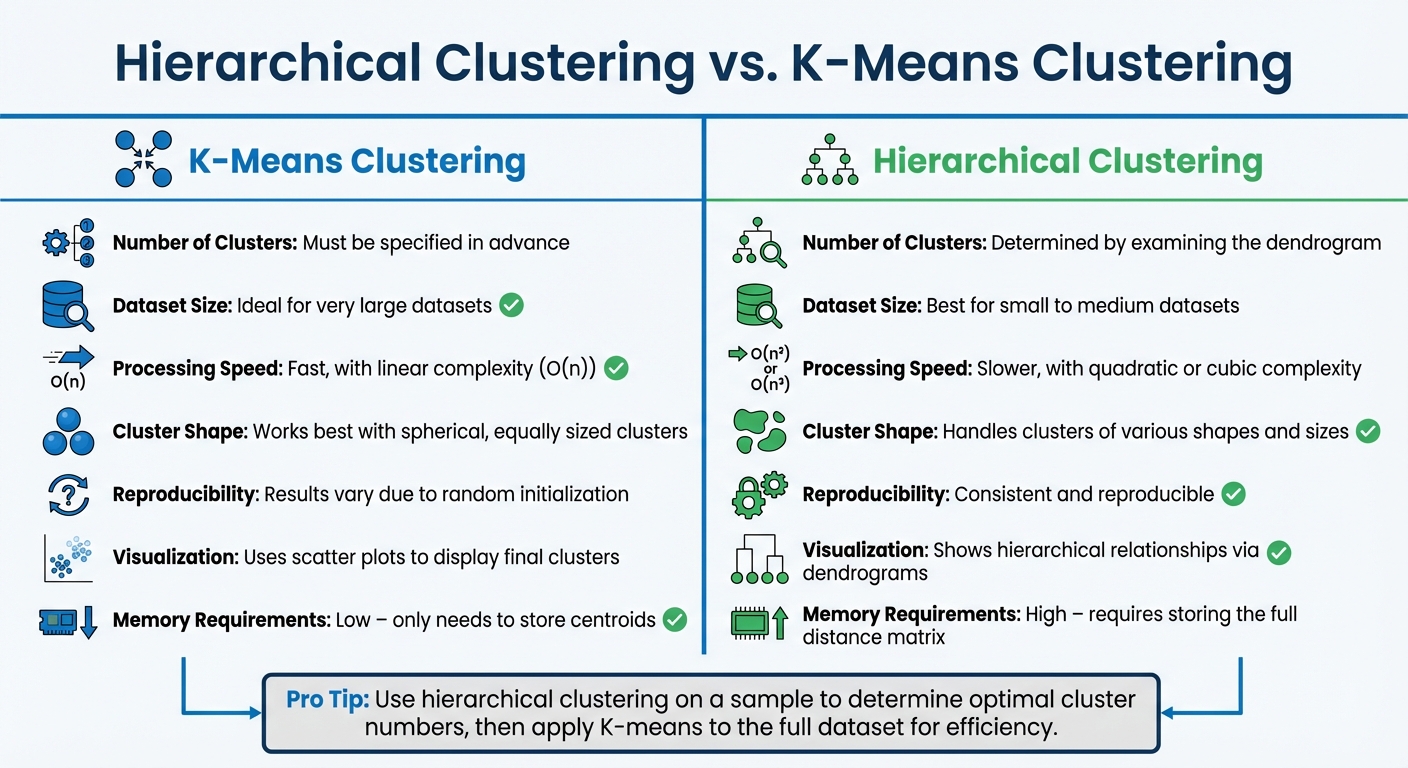
| Factor | K-Means Clustering | Hierarchical Clustering |
|---|---|---|
| Number of Clusters | Must be specified in advance | Determined by examining the dendrogram |
| Dataset Size | Ideal for very large datasets | Best for small to medium datasets |
| Processing Speed | Fast, with linear complexity (O(n)) | Slower, with quadratic or cubic complexity |
| Cluster Shape | Works best with spherical, equally sized clusters | Handles clusters of various shapes and sizes |
| Reproducibility | Results vary due to random initialization | Consistent and reproducible |
| Visualization | Uses scatter plots to display final clusters | Shows hierarchical relationships via dendrograms |
| Memory Requirements | Low – only needs to store centroids | High – requires storing the full distance matrix |
For businesses managing massive customer datasets, K-means is often the practical choice due to its speed and low memory requirements. But if the goal is to explore hierarchical relationships – such as identifying sub-groups within a niche customer segment – hierarchical clustering offers a deeper look into the data.
Interestingly, a hybrid approach can combine the strengths of both methods. For example, you could use hierarchical clustering on a smaller sample to determine the optimal number of clusters, then apply K-means to the entire dataset. This way, you get the exploratory benefits of hierarchical clustering with the efficiency of K-means.
Choosing the right clustering method can significantly influence how effectively businesses segment their customers and create personalized marketing strategies.
Best Practices for Hierarchical Clustering
Let’s build on the methods discussed earlier and refine your approach to hierarchical clustering, particularly for customer segmentation.
Reading Dendrograms and Determining the Right Number of Clusters
A dendrogram is like a visual guide that shows how data points or clusters combine step by step. To decide the number of clusters, look for the largest vertical gap in the dendrogram – this marks the most distinct groupings. Drawing a horizontal line across the dendrogram, count how many vertical lines it intersects; this gives you the number of clusters. For example, in a mall customer segmentation study using Annual Income and Spending Scores, the analysis revealed five clusters with a Silhouette Score of 0.5530 and a Davies-Bouldin Index of 0.5782.
To validate your results, use metrics like the Silhouette Score, which measures how well-separated clusters are, and the Davies-Bouldin Index, which evaluates cluster similarity. It’s worth noting that the linkage method, such as Ward’s method, often has a bigger influence on the outcome than the choice of distance metric. Experimenting with different combinations can help refine your results.
Handling Large Datasets
Hierarchical clustering can become unwieldy with large datasets because it requires storing a full distance matrix in memory. For instance, clustering a dataset with 1 million points might demand an enormous 7.45 terabytes of memory. The computational complexity – ranging from $O(n^2 \log n)$ to $O(n^3)$ – means that processing time increases dramatically as the dataset grows.
One way to manage this is through sampling. Start by clustering a smaller, representative subset of your data (e.g., 10,000 points out of 1 million), and then assign the remaining data points to the nearest clusters. For even larger datasets, a hybrid approach can be effective. For example, use K-means to create 1,000 flat clusters and then apply hierarchical clustering to the centroids instead of the entire dataset. Additionally, dimensionality reduction techniques like PCA can ease computational demands while retaining the core structure of the data.
If you’re working with very large datasets, specialized tools can make a big difference. Libraries like fastcluster in Python, GPU-accelerated frameworks such as RAPIDS cuML, or distributed systems like Apache Spark MLlib can significantly improve efficiency. These tools help scale hierarchical clustering to meet the demands of larger datasets.
When to Use Hierarchical Clustering
Hierarchical clustering is particularly useful for exploratory analysis, especially when you don’t know the number of customer segments beforehand. As highlighted by DataCamp, this method lets analysts visually explore data structures through dendrograms, making it ideal for early-stage market research or uncovering complex relationships among customer groups.
This approach works best with small to medium-sized datasets – typically a few thousand customers or fewer. It’s especially effective when customer segments have irregular shapes, which centroid-based methods like K-means might miss. Studies have shown that hierarchical clustering can lead to more targeted marketing strategies by identifying distinct customer groups.
Conclusion
Hierarchical clustering, with its use of dendrogram analysis and tailored linkage methods, offers a dynamic way to uncover customer relationships without needing to predefine the number of groups. The dendrogram itself reveals the natural structure of your data, helping you pinpoint clusters based on inherent similarities.
This method provides consistent and reliable results, giving businesses a solid base for strategic decision-making. Techniques like Ward’s method enable the creation of compact, homogeneous clusters, which can lead to more predictable and effective marketing outcomes.
One of the standout features of hierarchical clustering is its adaptability. By cutting the dendrogram at various heights, you can create either broad market categories or highly specific micro-segments, depending on your business goals. This adaptability ensures that segmentation efforts can align with diverse business needs.
The true power of hierarchical clustering lies in combining algorithmic precision with human insights. While the algorithm excels at identifying patterns and removing bias during the grouping process, human expertise is crucial for giving meaningful context to these segments and determining how resources should be allocated. Together, this approach provides the clarity and depth needed to build personalized marketing strategies that deliver measurable results. In the end, these insights help marketers turn raw data into actionable strategies that drive business growth.
FAQs
How can I select the best distance metric and linkage method for hierarchical clustering?
Choosing the right distance metric and linkage method is all about understanding your data and the patterns you’re trying to identify. The distance metric measures how similar (or different) data points are. Some of the most common options include:
- Euclidean distance: Ideal for continuous, numerical data where geometric relationships matter. Think of it as the straight-line distance between points.
- Manhattan distance: Works well for grid-like data, where movement happens along axes (like navigating city blocks).
- Cosine distance: Great for high-dimensional data, such as text analysis or user preferences, where comparing angles in multi-dimensional space makes more sense than measuring straight-line distance.
For instance, if you’re analyzing customer preferences in a recommendation system, Cosine distance might be your go-to. On the other hand, Euclidean distance is better suited for datasets where spatial relationships are important.
The linkage method, on the other hand, decides how clusters are combined. Here are some popular options:
- Single linkage: Good for detecting elongated clusters but can lead to "chaining", where clusters stretch out.
- Complete linkage: Produces compact, well-separated clusters, making it a solid choice for many applications.
- Average linkage: Balances the extremes of single and complete linkage by considering average distances.
- Ward’s method: Focuses on minimizing variance within clusters, resulting in tighter, more cohesive groups. It’s often a strong default choice for most datasets.
When deciding on the best combination, think about your data’s scale, distribution, and the cluster shapes you’re aiming for. Testing different metrics and linkage methods, paired with visual tools like dendrograms, can help you fine-tune your approach and get better results – especially for tasks like customer segmentation.
What makes hierarchical clustering a better choice than K-means for customer segmentation?
Hierarchical clustering is a solid choice for customer segmentation because it doesn’t force you to pick the number of clusters right from the start. This approach lets businesses uncover natural groupings in their data without predefined limitations. Plus, it generates a dendrogram – a visual map that shows how customers are grouped – making it easier to spot relationships and patterns.
Unlike K-means, hierarchical clustering shines when you’re looking for a more in-depth and intuitive grasp of customer behavior. It’s especially handy for smaller datasets or when you want to understand the step-by-step process of how clusters are formed.
What are the best ways to apply hierarchical clustering to large datasets efficiently?
Hierarchical clustering, while powerful, can be computationally demanding, especially with large datasets. To tackle this challenge, several strategies can help streamline the process.
One approach is dimensionality reduction, such as using Principal Component Analysis (PCA). By reducing the number of features, you can significantly cut down the number of distance calculations required. Another effective method involves spatial indices like kd-trees or ball trees, which can speed up distance computations by organizing data in a way that makes searching faster.
For extremely large datasets, parallel processing or GPU acceleration can distribute the workload, making computations more manageable. Additionally, some techniques use approximate nearest neighbor searches or apply early stopping criteria to limit the number of merges, striking a balance between efficiency and accuracy. These optimizations make hierarchical clustering feasible for large-scale applications, such as customer segmentation.