


Heatmap tools help you understand how users interact with your website by turning data into visual maps. They show where users click, scroll, or linger on a page. Picking the right tool depends on your goals, budget, and the features you need. Here’s a breakdown of four popular heatmap tools:
- Hotjar: Offers heatmaps, session recordings, and surveys. Plans start at $39/month. Best for businesses of all sizes, with flexible pricing tiers.
- Crazy Egg: Includes unique features like "Confetti" reports and A/B testing. Pricing starts at $29/month. Ideal for e-commerce and marketing teams.
- Microsoft Clarity: Completely free, providing unlimited heatmaps and session recordings. Great for small businesses or those on a budget.
- VWO Insights: Combines heatmaps, session recordings, and advanced analytics. Pricing starts at $169/month. Suited for teams focused on detailed user behavior analysis.
Quick Comparison:
| Tool | Starting Price | Key Features | Best For |
|---|---|---|---|
| Hotjar | $39/month | Heatmaps, session recordings, surveys | All business sizes |
| Crazy Egg | $29/month | Confetti reports, A/B testing | E-commerce, marketing teams |
| Microsoft Clarity | Free | Unlimited heatmaps, session recordings | Small businesses |
| VWO Insights | $169/month | Advanced analytics, AI-driven insights | Conversion-focused teams |
Each tool has strengths and limitations. Free options like Microsoft Clarity work well for basic needs, while paid platforms like Hotjar and VWO Insights provide deeper insights for scaling businesses. Choose based on your goals and budget.
+5 Best Heatmap & Session Replay Software Tools in 2025 (Full Demo & Comparison)
1. Hotjar
Hotjar powers over 1.2 million websites across 180+ countries, boasting an impressive 92% user satisfaction rate. Trusted by major brands like Adobe and Decathlon, Hotjar has become a go-to tool for businesses looking to understand and improve user experiences.
Features
Hotjar brings together a variety of analytics and feedback tools into a single platform. Its standout features include heatmaps, session recordings, surveys, and feedback polls.
- Heatmaps: These visualize user interactions – clicks, taps, and scrolling patterns – helping businesses identify which buttons or links drive engagement and how far users scroll on a page.
- Session Recordings: By capturing live user sessions, Hotjar exposes usability issues in real time. Paired with conversion funnel analysis, it highlights where users drop off.
- Feedback Tools: Surveys and polls allow users to share direct feedback, while form analysis adds another layer of insight into user behavior.
"The surveys and heat maps reveal exactly what users seek, enabling instant website improvements. Once I use these insights to customize my website, I see an improved conversion rate and my website visitors convert into clients much faster!" – Prashant Bhaga, Entrepreneur
Pricing
Hotjar offers a tiered pricing structure based on three core products – Observe (heatmaps and recordings), Ask (surveys and feedback), and Engage (user interviews). Plans are flexible, catering to businesses of all sizes, and include Basic, Plus, Business, and Scale options.
| Plan | Observe (Monthly) | Daily Sessions | Ask (Monthly) | Monthly Responses |
|---|---|---|---|---|
| Basic | $0 | 35 | $0 | 20 |
| Plus | $39 | 100 | $59 | 250 |
| Business | $99 | 500 | $79 | 500 |
| Scale | $213 | 500+ | $159 | Unlimited |
- Observe plans start at $39/month for heatmaps and session recordings.
- Ask plans begin at $59/month for surveys and feedback tools.
- Discounts: A 20% discount is available for annual billing, and subscribing to both Observe and Ask products reduces costs by 10%.
- Engage plans, designed for user interviews, range from $49/month to $550/month for advanced features.
Business Suitability
Hotjar is designed to cater to a wide range of businesses, from small startups to larger enterprises. Its user-friendly interface and powerful features make it especially popular among digital marketers, UX designers, web developers, and product marketers.
- Basic and Plus Plans: Perfect for startups and smaller websites.
- Business Plan: Tailored for small to medium-sized enterprises.
- Scale Plan: Built for larger organizations with advanced needs.
"With the help of Hotjar, our company’s employees can determine the specific actions of visitors to the site, thanks to which we have managed to almost double the conversion over the past year." – Dmytro Kuklenko, Head of Mobile Development Department
Hotjar consistently earns high praise for its intuitive design and clear visual data. It holds a 4.6/5 rating on GetApp (based on 537 reviews) and a 92% satisfaction score from 1,121 reviews. Some users have pointed out limitations in its data analysis features and basic conversion funnels, but overall satisfaction remains strong.
Success stories further highlight Hotjar’s impact. For example, Stream Creative generated over $120,000 in revenue using Hotjar insights, while Ecommerce Warriors significantly boosted their online business through recordings and surveys.
2. Crazy Egg
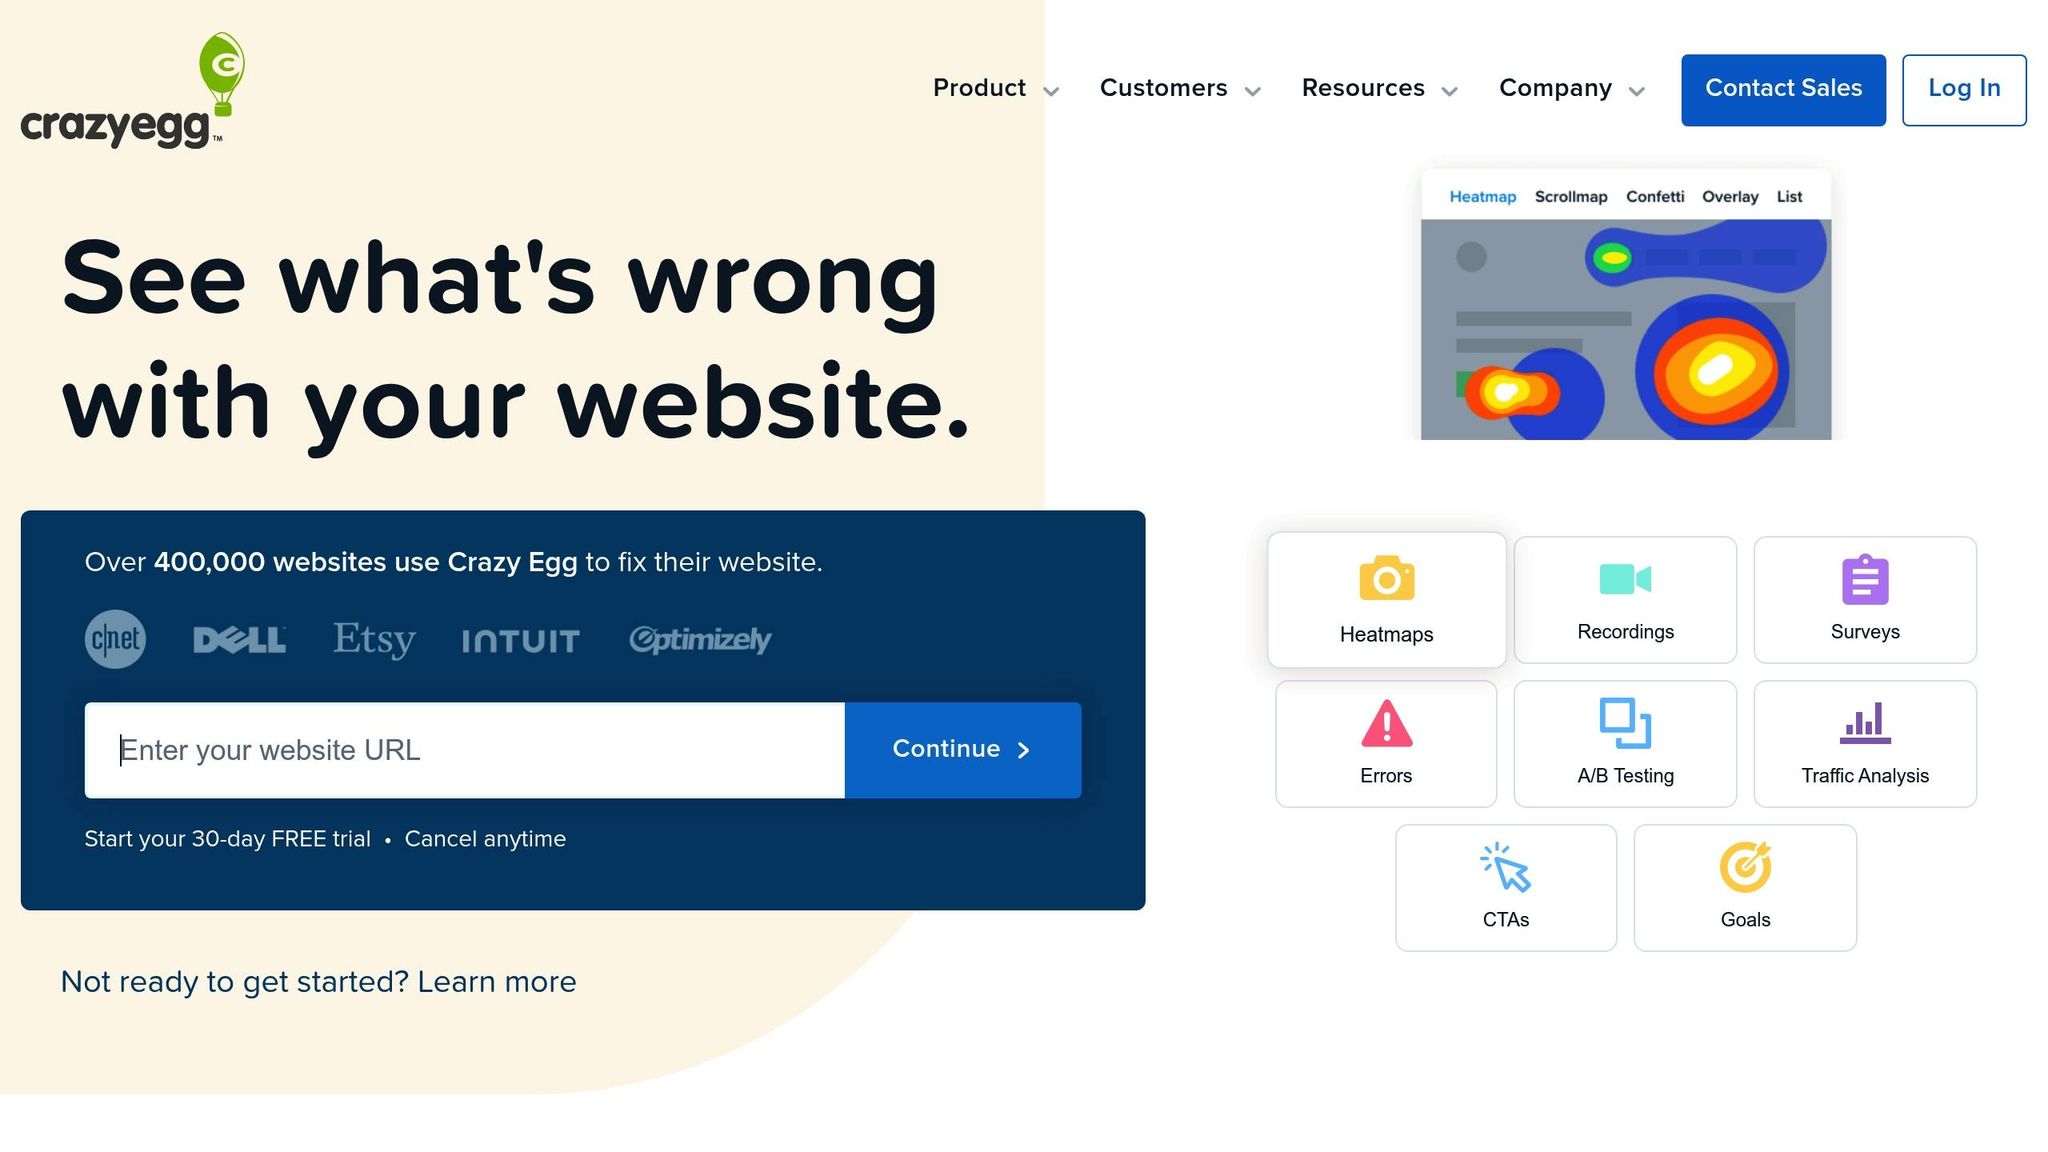
Crazy Egg, much like Hotjar, provides tools to analyze user behavior, offering insights that help businesses improve their websites. With over 400,000 websites using its services globally, Crazy Egg specializes in visual analytics that make it easier to understand how users interact with a site.
Features
Crazy Egg’s toolkit includes heatmaps, scrollmaps, confetti and overlay reports, session recordings, and A/B testing, all enhanced by advanced segmentation filters.
- Heatmaps visually show where users click, tap, and move their cursors, offering a snapshot of engagement hotspots.
- Scrollmaps track how far visitors scroll down a page, helping identify where to place critical content or calls-to-action.
- Confetti reports break down clicks by traffic source, highlighting how different audiences behave.
- Overlay reports provide a detailed look at clicks on specific elements like buttons or links, offering precise interaction data.
- Session recordings allow businesses to watch real user interactions, while segmentation filters help analyze behavior based on factors like device type or traffic source.
For example, Neil Patel used Crazy Egg’s heatmaps and confetti reports to uncover that visitors were clicking on non-clickable elements and that much of his traffic came from his personal blog. By simplifying his homepage based on these findings, he achieved a 433% increase in conversions. Similarly, North Face used heatmaps to discover that a promotional banner was distracting users from the checkout button. After repositioning the banner, they saw a 21% increase in clicks on the checkout button.
Pricing
Crazy Egg offers four annual plans, scaling in price based on pageviews, heatmap reports, and recording limits.
| Plan | Monthly Cost | Pageviews | Heatmap Reports | Recordings | Storage |
|---|---|---|---|---|---|
| Starter | $29 | 5,000 | 5 | 50/month | 6 months |
| Plus | $99 | 150,000 | 75 | 1,000/month | 2 years |
| Pro | $249 | 500,000 | 100 | 5,000/month | 2 years |
| Enterprise | $499 | 1,000,000 | 200 | 10,000/month | 2 years |
All plans include unlimited surveys, website domains, and heatmap data filters. The Plus plan and higher tiers add features like A/B testing, conversion tracking, and error tracking. The Enterprise plan also includes SAML Single Sign-On and dedicated onboarding support. A 30-day free trial is available for all plans.
"It is more expensive than competing software tools (like Hotjar). Compare the features and price before selecting one." – Chris C., Director of Operations
Business Suitability
Crazy Egg caters to businesses of all sizes, from small startups to large enterprises, making it a versatile choice for anyone looking to optimize user experience. It’s particularly useful for e-commerce websites, digital marketing agencies, and SaaS companies aiming to improve their products and user interactions.
- The Starter plan works well for smaller websites with limited traffic.
- The Plus and Pro plans are better suited for growing businesses needing more advanced analytics.
- The Enterprise plan is designed for large organizations requiring premium features and personalized support.
Crazy Egg has earned high praise for its usability and functionality, with a 4.4/5 rating on both Capterra and GetApp. Users also rate its ease of use at 4.5/5, making it accessible for both beginners and experienced marketers.
"Crazy Egg nails user experience" – Joshua, Internet, 11-50 employees
Some impressive success stories include TSheets by QuickBooks, which used session recordings and snapshots to identify navigation issues in their pricing section, leading to a more effective conversion funnel in 2017. Similarly, WallMonkeys achieved a staggering 550% increase in their conversion rate after using Crazy Egg’s A/B testing tools to optimize their homepage.
3. Microsoft Clarity
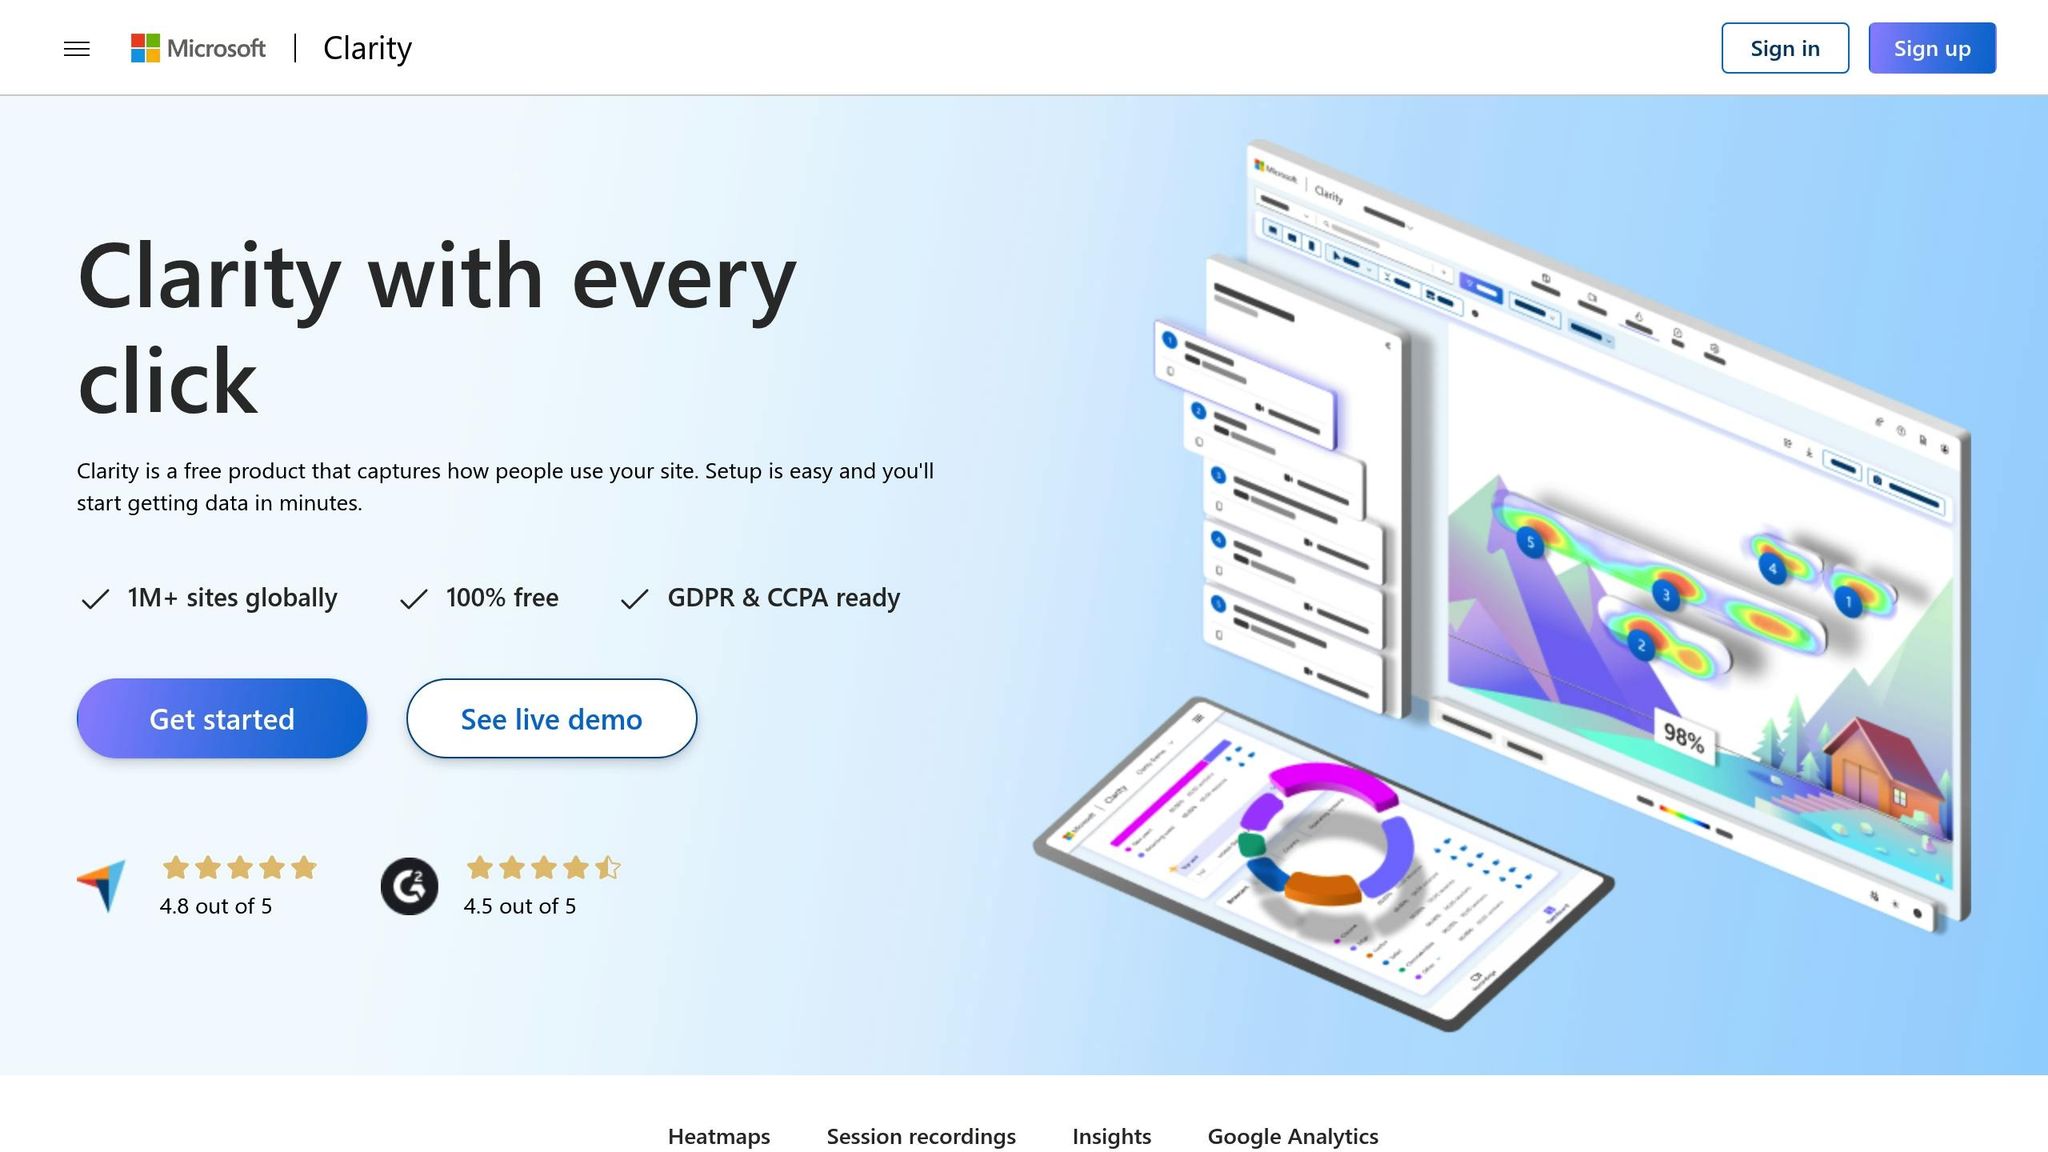
Microsoft Clarity is a behavioral analytics tool that stands out for its affordability – it’s completely free. With over 1 million websites worldwide relying on it, Clarity provides valuable insights into how users interact with websites and mobile apps, making it especially attractive to businesses mindful of their budgets.
Features
Clarity offers unlimited heatmaps, session recordings, and detailed user insights, all seamlessly integrated with Google Analytics. It also includes an AI-powered Copilot feature that generates session summaries and a Chrome extension that lets users view heatmaps and recordings directly on live websites. The platform is compliant with GDPR and CCPA regulations and supports mobile app tracking, making it a versatile option for various analytics needs.
"For a user experience analytics tool, I don’t think you will find a better solution than what Microsoft has done with Clarity."
– Scott Kivowitz, Chief Community Officer at Imagely
Pricing
One of Clarity’s biggest draws is its completely free pricing model. Unlike many other tools that limit features or impose traffic caps on free plans, Clarity offers its full suite of capabilities with no restrictions. This has led many users to switch from paid platforms, citing the significant cost savings as a major advantage. By eliminating the need for upgrades or tiered pricing, Clarity ensures that businesses of any size can access robust analytics without worrying about expenses.
Business Suitability
Clarity is designed to meet the needs of businesses both large and small. It processes over a petabyte of data from more than 100 million users every month. Small businesses benefit from enterprise-level analytics without the hefty price tag, while larger organizations appreciate its scalability and cost-free insights.
The platform has earned a 4.8/5 rating on Capterra from 55 reviews. Users frequently highlight its ease of use, quick setup, and detailed insights. However, some have pointed out limitations, such as fewer third-party integrations and occasional delays in data processing. For mobile app developers, Clarity is a valuable resource for analyzing user behavior and boosting engagement rates.
sbb-itb-2ec70df
4. VWO Insights
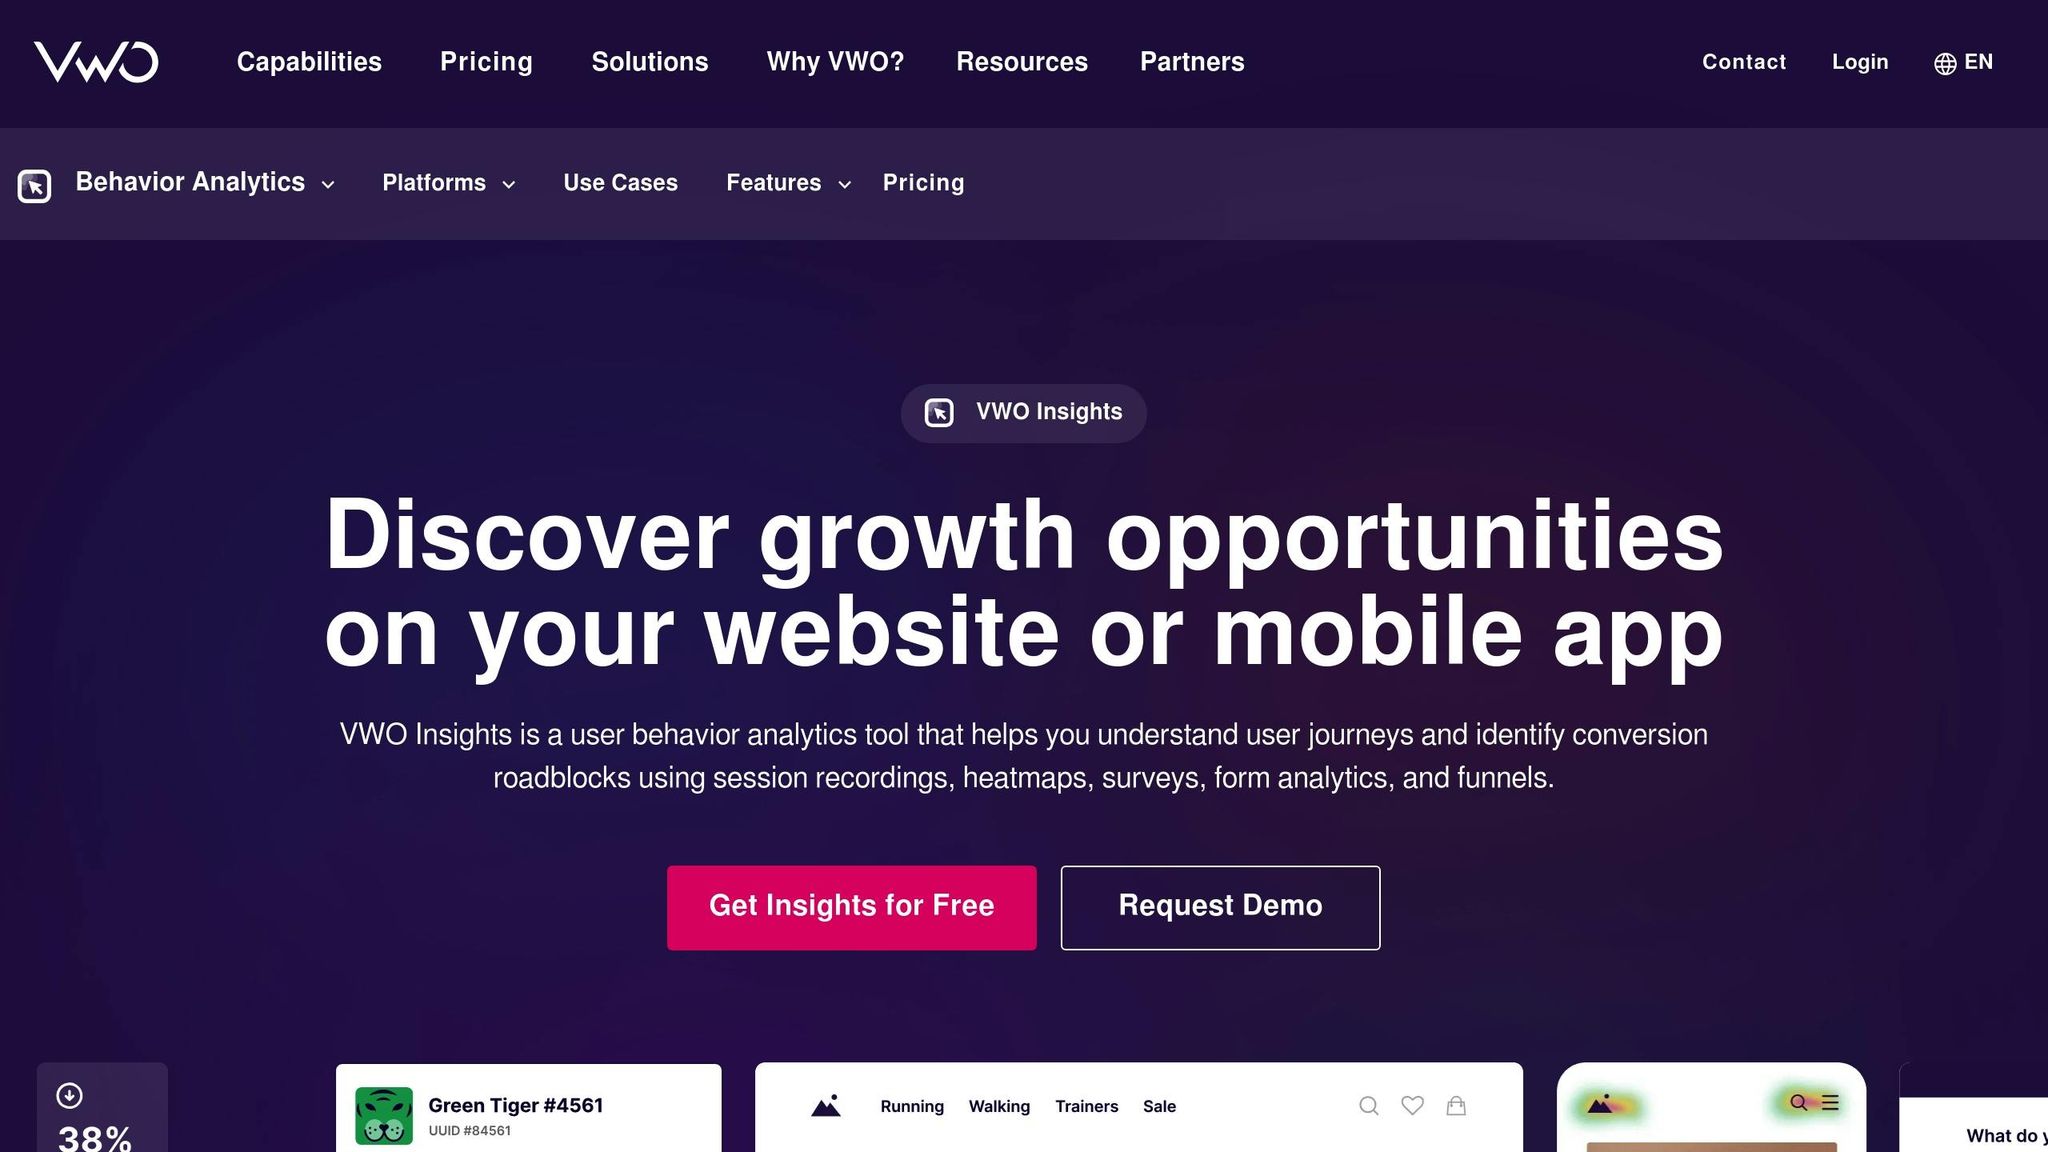
VWO Insights is a user behavior analytics platform designed to uncover obstacles in the conversion process. Unlike tools that focus only on heatmaps, VWO Insights brings together session recordings, heatmaps, surveys, form analytics, and funnels to deliver a full view of user behavior on both websites and mobile apps. This makes it stand out as a well-rounded option among top heatmap solutions.
Features
VWO Insights packs several essential analytics tools into one platform. Its session recordings allow you to track user navigation and filter by behaviors like struggles or specific cohorts. Teams can highlight key moments, add comments, and share recordings – all while ensuring user privacy.
The heatmap tool goes a step further with AI-driven optimization suggestions. It helps visualize user engagement trends, pinpoint the best spots for content or calls-to-action, and analyze interactions with dynamic elements. These insights can be shared instantly across teams for quick collaboration.
The survey feature enables you to gather direct feedback from users through customizable designs and triggers that activate after key events. Meanwhile, form analytics identifies fields causing friction and monitors user behavior at critical points in the process. The funnel analysis tool tracks user progression and highlights drop-off points, helping you refine the conversion journey.
With user segmentation, you can filter insights based on user traits, specific interactions, or data from third-party tools. This feature allows you to create reusable segment logic, making ongoing analysis more efficient.
"We were very happy that this A/B test validated our research-driven hypothesis. We loved how we didn’t have to buy some other tool for running heatmaps and scrollmaps for our visitor behavior experiment."
– Lee Preston, CRO Consultant
Pricing
VWO Insights offers subscription plans starting at $169.00 per month. For those wanting to explore the platform, there’s a free trial and a starter plan with limited features.
The Optimize Website plan ranges from $355 to $1,326 per month for up to 50,000 monthly visitors. Unlike some tools that charge based on session counts, VWO bills by the number of users tracked, allowing unlimited sessions per user – a considerable advantage.
Pricing varies depending on needs, with annual costs spanning $7,200 to $41,712, with a median of $18,086. For businesses looking to optimize mobile apps, custom pricing is available through direct consultation with VWO’s sales team.
Business Suitability
VWO Insights caters to businesses of all sizes, offering strategic benefits for those focused on conversion rate optimization (CRO). It’s particularly appealing to small and midsize teams, thanks to its user-friendly interface and robust analytics that don’t require deep technical expertise. Users have given the platform a 5.0 overall rating, praising its ease of use (5.0) and functionality (5.0), though its value-for-money score is slightly lower at 4.0.
The platform’s impact is evident in real-world use cases. For instance, IMB Bank used VWO Insights to tackle high drop-off rates, achieving a 36% increase in personal loan conversions, an 87% boost in home loan conversions, and a 12% year-over-year improvement in form completions. BODYGUARDZ utilized scrollmap data to redesign their digital presence, leading to a 54% increase in annual revenue.
"VWO is a highly user-friendly and economical tool. It offers an intuitive user interface. It makes it easy to run experiments, gather customer insights, check for leakages in the sales funnels, looking at customer journeys using recordings, and conducting usability tests."
– Loef Kleinmeijer, ISM eCompany
Another success story comes from Bear Mattress, which used VWO Insights to identify issues on their product pages. After implementing data-driven changes, they achieved a 24.18% increase in successful purchases and a 16.21% boost in revenue.
VWO Insights excels at providing in-depth user behavior insights without requiring extensive technical resources, making it a solid choice for businesses aiming to enhance their conversion rates and overall user experience.
Pros and Cons
This section breaks down the strengths and weaknesses of each heatmap tool, helping you decide which one fits your business needs and budget.
| Tool | Pros | Cons |
|---|---|---|
| Hotjar | • Easy-to-use interface with straightforward setup • Advanced feedback tools and AI-assisted surveys • Delivers in-depth insights • Trusted by over 1.1 million websites worldwide • Strong community support and brand recognition |
• Costs can rise quickly as usage grows • Requires manual heatmap setup • Daily data sampling limits • May impact website performance • Customer support can be slow to respond |
| Crazy Egg | • Affordable pricing starting at $49/month • Offers unique "Confetti" click analytics • Includes built-in A/B testing • Yearly plans are budget-friendly compared to competitors • Simple and quick to set up |
• Fewer heatmap types available • Struggles with dynamic websites • Requires manual snapshot setup • Lacks advanced features like form analytics • Interface may feel outdated for some users |
| Microsoft Clarity | • Free to use with no restrictions • No data sampling or capture limits • Supports some mobile applications • Integrates easily with Google Analytics • Unlimited session recordings |
• Basic features compared to paid tools • Limited heatmap customization options • Randomized session recordings for replays • No real-time data processing • Minimal customer support options |
| VWO Insights | • Part of a larger optimization suite • Excellent third-party integration capabilities • Includes mobile app support • AI-driven recommendations for optimization |
• Starts at a higher price point of $169/month • Fewer heatmap types available • Lower-tier plans limit features • Some plans use data sampling • May be too advanced for simple heatmap needs |
When comparing these tools, pricing is a key factor. Microsoft Clarity offers a no-cost model, while VWO Insights is priced at the higher end with robust features. Beyond cost, consider additional factors like data accuracy and customer support. These elements can significantly affect how well a tool works for your specific needs.
For example, tools like Hotjar and VWO Insights provide broad integration options and advanced features, but they may require a higher investment. On the other hand, free tools like Microsoft Clarity cover the basics but lack advanced functionalities such as form analytics or user journey mapping.
Data reliability is another critical consideration. Some tools struggle with dynamic content unless manually configured, while others lack real-time data processing. Sampling methods can also influence the accuracy of insights, especially for websites with heavy traffic.
"This knowledge puts you ahead of your competitors and helps you to convert more visitors into customers." – Neil Patel, Digital Marketing Expert
Ultimately, the best choice depends on your business size, technical requirements, and budget. Smaller businesses might prefer simpler, cost-effective tools, while larger organizations may need more advanced platforms to scale and generate deeper insights.
Conclusion
Choosing the right heatmap tool hinges on aligning its features with your specific business objectives. For small businesses and startups, Microsoft Clarity is a standout option. It offers unlimited usage at no cost and boasts an impressive 4.8/5 rating on platforms like Capterra and G2. As Microsoft puts it:
"Clarity is a free, easy-to-use tool that captures how real people actually use your site".
Free plans like Clarity’s provide a no-strings-attached entry point into heatmap analytics. However, while some tools limit usage on their free tiers, Clarity does not. For mid-sized businesses, investing in paid plans from tools like Hotjar – with pricing starting at around $32 per month – can be a smart move. Hotjar, for instance, is recommended by 84% of its users, offering a great balance of cost and features to support scaling needs.
Enterprise-level organizations often require more advanced capabilities, making premium tools such as VWO Insights a strong contender. These tools excel in providing sophisticated features and seamless integrations, which are particularly valuable for businesses prioritizing in-depth data analysis and conversion optimization. Premium platforms not only adapt to growing business needs but also align with broader data strategies.
The ability to identify where users drop off in your funnel and optimize key elements is crucial. Choose a heatmap tool that aligns with your data strategy and emphasizes actionable insights over raw numbers. Pairing heatmap analysis with other analytics tools can give you a clearer, more comprehensive view of user behavior. Regularly reviewing heatmap trends over time can uncover patterns that inform strategic growth decisions.
In today’s data-driven world, heatmap tools have become essential for businesses aiming to enhance user experience, improve conversion rates, and map customer journeys. Whether you begin with a free tool or invest in a premium solution, these insights can lead to measurable improvements in both website performance and overall business outcomes.
Ultimately, select a heatmap tool that grows with your business, helps you uncover actionable insights, and drives meaningful improvements in conversions.
FAQs
What should I look for when selecting a heatmap tool for my business?
When choosing a heatmap tool, it’s important to align your choice with your specific goals and priorities. Think about the user behaviors you want to analyze – whether it’s tracking clicks, scroll depth, or mouse movements – and how these insights can help you achieve objectives like improving conversions or increasing user engagement.
Look for features that matter most to your workflow, such as real-time data tracking, an intuitive interface, and options for customization. Make sure the tool is within your budget and works seamlessly with your current systems. By matching the tool’s capabilities to your business needs, you can uncover insights that help you fine-tune your website or app for better performance.
What are the key differences between free heatmap tools like Microsoft Clarity and paid options such as Hotjar or Crazy Egg?
Free tools such as Microsoft Clarity are a solid option for businesses that are just getting started or need straightforward insights into user behavior. With features like unlimited heatmaps and session recordings, they provide essential functionality without any cost. That said, these tools often come with limitations, especially when it comes to advanced capabilities.
On the other hand, paid platforms like Hotjar and Crazy Egg bring more to the table. They include features like detailed analytics, customizable heatmaps, and user feedback tools. These extras make them a better fit for businesses looking to dive deeper into user behavior or those managing larger, more complex operations.
In short, free tools work well for covering the basics, while paid options are better suited for businesses aiming for more detailed, data-focused approaches.
What are some common limitations of heatmap tools for analyzing user behavior, and how can businesses address them?
Heatmap tools are fantastic for getting a visual sense of how users interact with a page, but they aren’t without their challenges. One key limitation is their focus on single-page interactions, which means they often miss the bigger picture – like how users navigate across multiple pages or their entire journey on your site. They can also stumble when it comes to dynamic elements, such as dropdown menus or mobile gestures, which might lead to gaps or even inaccuracies in the data.
To work around these shortcomings, businesses can combine heatmaps with other tools like session recordings, funnel analysis, or user feedback. This layered approach helps paint a fuller picture of user behavior. Additionally, narrowing the focus to specific user segments or prioritizing mobile-specific analysis can go a long way in refining the insights and making them more reliable.


