

Want to boost your app’s performance? Start by tracking the right metrics. Conversion metrics reveal how users interact with your app – from installs to purchases – and help identify where they drop off. Here’s why they matter:
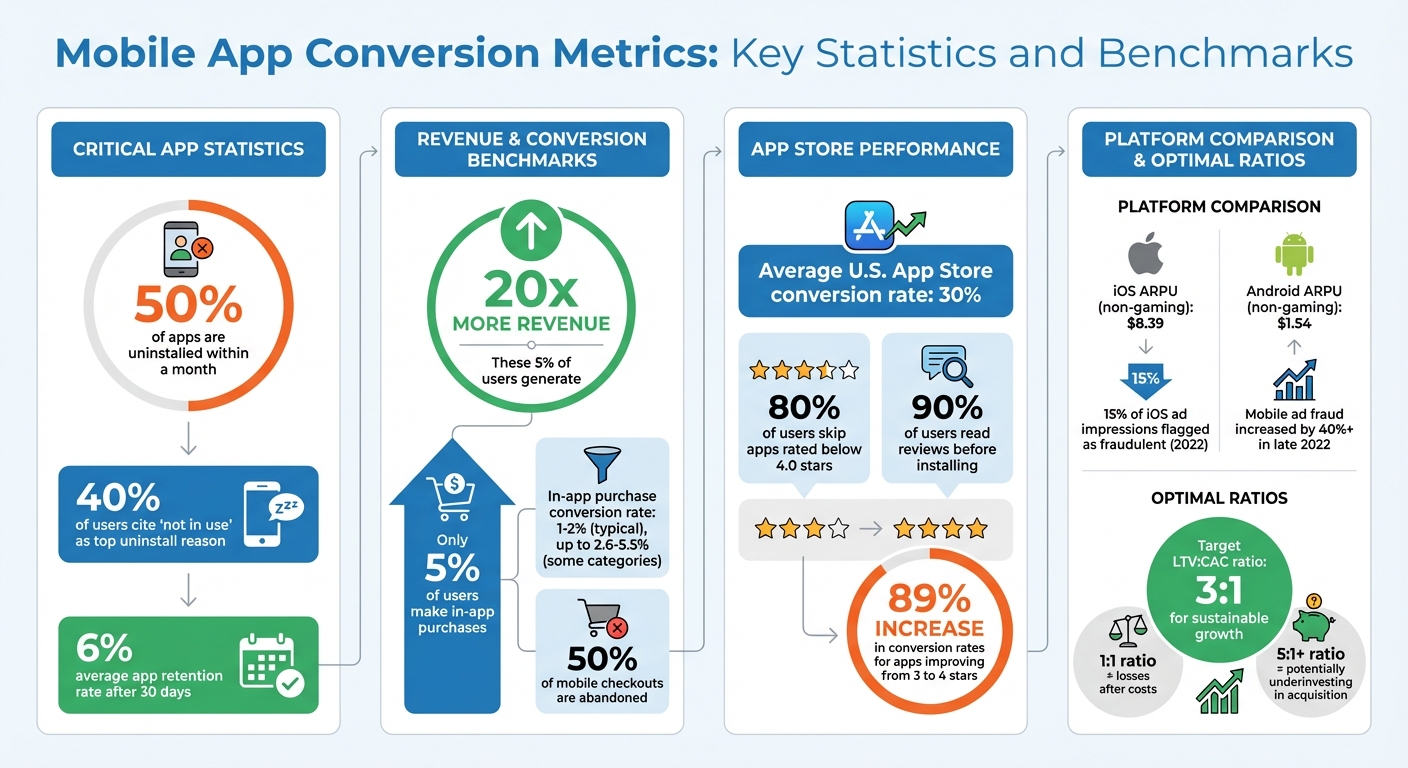
- 50% of apps are uninstalled within a month.
- Only 5% of users make in-app purchases, yet they generate 20x more revenue than other paying users.
- App store conversion rates average 30% in the U.S., but poor ratings (<4 stars) can deter 80% of users.
Key metrics to monitor:
- App Store Conversion Rate: Percentage of store visitors who install the app.
- In-App Purchase Conversion Rate: Tracks paying users, typically 1–2%.
- Subscription Conversion Rate: Measures trial-to-paid users and renewals.
- Retention Rate: Indicates how many users stick around after 30 days.
To improve, focus on clear app store listings, user-friendly onboarding, and frictionless checkout processes. Tools like Google Analytics for Firebase, Mixpanel, and AppsFlyer can help track these metrics effectively.
Pro Tip: Calculate your LTV:CAC ratio to ensure acquisition costs don’t exceed user lifetime value. Aim for a 3:1 ratio for sustainable growth.
Conversion metrics are the backbone of app success – track, analyze, and optimize to grow your user base and revenue.
Mobile App Conversion Metrics: Key Statistics and Benchmarks
Key Mobile App Conversion Metrics
Store Listing Conversion Rate
Store Listing Conversion Rate tracks how many users install an app after visiting its store page. Apple calculates this by dividing installs by unique impressions, while Google uses installs divided by store listing visitors. On average, apps in the U.S. App Store see a conversion rate of about 30%.
First impressions matter – a lot. Around 80% of users skip apps rated below 4.0 stars, and 90% read reviews before deciding to install. To boost conversions, focus on showcasing key benefits in your hero screenshot (e.g., "Save money in one tap") instead of just displaying generic interface images.
Both Apple and Google offer tools to fine-tune your strategy. Apple allows up to 70 custom pages, while Android supports 50. These pages let you target specific user groups and improve your conversion rates.
Now let’s look at how in-app purchases contribute to your bottom line.
In-App Purchase Conversion Rate
The in-app purchase conversion rate typically falls between 1% and 2%, though in some categories, it can climb to 2.6%–5.5%. Although only about 5% of users make in-app purchases, this small group generates revenue that’s 20 times higher than that of other paying users.
One major challenge? About half of mobile checkouts are abandoned. To combat this, streamline the process: reduce form fields, enable guest checkout, offer one-tap payment options like Apple Pay or Google Pay, and display trust signals like SSL badges.
Tailor your tracking to match your app’s goals. For instance, travel apps might focus on flight bookings, while eCommerce apps can analyze cart-to-purchase rates to identify key drop-off points.
Next, let’s explore how to turn trial users into loyal subscribers.
Subscription Conversion Rate
Subscription metrics measure how effectively you convert free or trial users into paying subscribers. The key numbers here are trial-to-paid and renewal rates.
A real-world example? American Dairy Queen boosted revenue by 138% by using targeted subscription offers through the Braze platform. Timing is critical – present subscription options only after users have experienced the app’s value. Use behavioral triggers or early bonus offers to nudge them toward commitment.
Paid vs Organic Conversion Rates
Finally, compare the performance of paid and organic channels to refine your overall strategy. Organic users tend to convert better because they’re genuinely interested in your app, while paid campaigns rely on precise targeting to deliver results.
It’s also important to track ROI by channel. For example, Facebook Ads and Google Ads may bring in users of varying quality. Data shows iOS users generate higher average revenue per user (ARPU) – $8.39 for non-gaming apps compared to $1.54 on Android.
Don’t overlook "organic uplift", which measures whether paid campaigns bring in users who wouldn’t have discovered your app otherwise. This metric can help you understand your product’s appeal, as organic users often reflect a genuine need for your app.
How to Measure Mobile App Conversion Metrics
Formulas for Key Metrics
To calculate the App Store Conversion Rate, divide the number of unique installs by the unique page views, then multiply by 100. For instance, if 1,000 people visit your app’s store page and 300 install the app, your conversion rate would be 30%.
After users install your app, track their journey with metrics like the Install to In-App Event Conversion Rate and Install to Purchase Conversion Rate. Both follow the same formula: divide the number of users who complete the desired action (such as completing registration or making a purchase) by the total installs, then multiply by 100.
Retention metrics are equally important. The Churn Rate measures how many users you lose over time. It’s calculated by dividing the number of users lost by the number of users at the start, then multiplying by 100. Another key metric is ARPU (Average Revenue Per User), which is determined by dividing total revenue by the total number of users. These metrics give a clear overview of your app’s performance and help identify areas where users or revenue might be slipping away.
Next, let’s look at tools that simplify tracking these metrics.
Tools for Tracking Conversion Metrics
A variety of tools are available to help you monitor these metrics effectively. Google Analytics for Firebase is a popular choice, offering free, unlimited reporting for up to 500 distinct events. It directly integrates with Google Ads and AdMob, making it easier to track ad performance. In GA4, you can designate specific events – like sign_up or level_complete – as key events for conversion tracking.
For detailed behavioral insights, Mixpanel excels in real-time funnel and retention analysis and allows you to run retroactive queries. It also integrates with push notification tools. Similarly, Amplitude provides multi-step funnel analysis and includes Amplitude Experiment, an A/B testing solution. If you’re working with large-scale data systems like BigQuery or Snowflake, Mitzu offers warehouse-native analytics while ensuring full data ownership.
Another standout tool is AppsFlyer, which specializes in mobile attribution and tracking marketing ROI by connecting user acquisition data with in-app behavior. Additionally, GA4 enables you to import events directly into Google Ads for optimizing conversions.
With these tools, you’ll have the foundation needed for effective funnel analysis.
Using Funnels to Identify Drop-Off Points
Funnel analysis allows you to map each step of the user journey and pinpoint where users drop off. By breaking the journey into stages, you can identify friction points. For example, if 1,000 users add items to their cart but only 500 proceed to checkout, you’ve identified a 50% drop-off at that stage.
This approach isn’t just theoretical – funnel analysis has real-world impact. For instance, one major brand improved feature adoption by 28% simply by addressing friction points.
To dig deeper, segment your funnels by device type (iOS vs. Android) or app version to uncover platform-specific challenges. Tools like heatmaps and session replays can provide additional insights into why users drop off. For example, they can reveal UI confusion, technical bugs, or issues in the payment flow. By identifying behaviors like "rage taps" or UI freezes, you can pinpoint technical issues that lead to abandonment. Once you know where users are exiting, test adjustments such as new copy, button colors, or simplified form fields to reduce friction and boost conversions.
With precise metrics and actionable funnel insights, you can create strategies to improve your app’s conversion rates – something we’ll dive into in the next section.
App Store Optimization for Beginners: What are App Conversion Rates? 📈
sbb-itb-2ec70df
Strategies to Improve Mobile App Conversion Rates
To boost your app’s conversion rates, focus on targeted strategies that address specific drop-off points identified through your data.
App Store Optimization (ASO)
Your app store listing is essentially your app’s landing page. It’s the first impression for users coming from organic searches or paid ads, so every detail counts.
- Make your icon stand out: Ensure it’s easily recognizable, even at smaller sizes, and avoid text that could become unreadable.
- Use a compelling "hero" screenshot: Instead of just showing the app interface, highlight a key benefit with short, high-contrast text overlays (e.g., "Save money in one tap"). This helps communicate immediate value.
- Craft a strong description: Lead with your best value proposition in the first three sentences, as most users won’t read beyond that point.
Even small changes can make a big difference. For example, apps with ratings that improve from 3 to 4 stars can see an 89% increase in conversion rates. Additionally, for targeted campaigns, take advantage of tools like Custom Product Pages on iOS (up to 70 variants) or Custom Store Listings on Google Play (up to 50 variants). These allow you to align your ad messaging with tailored store pages for better results.
A/B Testing for App Elements
A/B testing is one of the most effective ways to figure out what resonates with your audience. Platforms like Apple’s Product Page Optimization (PPO) and Google Play’s Store Listing Experiments (SLE) make it easy to test elements such as icons, screenshots, and videos.
- Test one element at a time: This ensures you can pinpoint which change is driving conversions. Aim for a minimum of a +5% lift in conversion with 90–95% statistical confidence.
- Expand testing beyond the store: Experiment with in-app features like button colors, copy, or the timing of permission requests. For example, Max, the streaming service, introduced an interactive "What’s Your Hogwarts House" survey through in-app messaging, which resulted in a sixfold increase in click rates.
The key to successful testing is isolating variables. If you change too many elements at once, it becomes impossible to determine which adjustment made the difference.
Streamlining User Onboarding
First impressions matter, and your onboarding process is critical. Aim to deliver value within the first 60 seconds.
- Reduce friction with guest options: Allow users to check out or explore without signing in.
- Ask for permissions at the right time: Only request permissions when they’re necessary for a feature. This approach has been shown to improve opt-in rates.
- Personalize the experience: In 2025, Styli, an eCommerce platform, used personalized push notifications and in-app messages to guide users through activation. This led to a 15% increase in user activation and a 21% rise in new user sign-ups.
Additionally, map out your user flows to identify where users drop off, then test small adjustments to those steps. Simple changes, like adding one-tap payment options, can make a big difference in keeping users engaged.
Advanced Analytics for Conversion Optimization
To truly understand how conversions impact profitability, it’s essential to analyze metrics like Customer Acquisition Cost (CAC), Lifetime Value (LTV), and Return on Investment (ROI). These metrics go beyond surface-level data, directly linking user behavior to cost efficiency and overall business outcomes.
Integrating Customer Acquisition Cost (CAC) and Lifetime Value (LTV)
A high conversion rate is meaningless if acquiring those users costs more than the revenue they generate. This is where the LTV:CAC ratio becomes critical. As Saras Analytics explains:
Growth is impossible if the customer acquisition cost (CAC) exceeds the lifetime value (LTV) of the company’s current clientele.
Here’s how the ratio works:
- A 1:1 ratio indicates losses after accounting for costs.
- A 3:1 ratio is often seen as the sweet spot for sustainable growth.
- Ratios over 5:1 might suggest you’re not investing enough in customer acquisition, potentially leaving growth opportunities untapped.
Breaking this down by marketing channel adds even more clarity. For example, calculating LTV:CAC for paid search, social ads, or organic traffic can reveal which channels deliver the most value. Blacklane, a professional chauffeur service, used personalized lifecycle campaigns and real-time segmentation to achieve a 194% improvement in lifecycle conversions and a 94% increase in CRM revenue in 2025.
Improving customer retention is another way to enhance LTV and justify spending more on acquisition. A great example comes from American Dairy Queen Corporation, which tested various welcome offers to boost average revenue per user (ARPU). Their efforts resulted in a 138% revenue increase compared to their average monthly CRM revenue.
Tracking Return on Investment (ROI) by Channel
To make ROI tracking effective, it’s crucial to connect marketing channels directly to revenue. AppsFlyer emphasizes the importance of accuracy in this process:
Working with accurate ROI data is the holy grail for performance marketers, whereas working based off of inaccurate ROI data can completely derail all marketing efforts and even risk your app’s financial stability.
Start by standardizing cost data across ad networks. Since platforms like Facebook and Snapchat use different metrics (e.g., likes vs. swipes), integrating APIs for real-time cost updates ensures consistency. Dive deeper by analyzing performance at the creative, keyword, and geographic levels, and consolidate all revenue streams – whether they’re from in-app purchases, subscriptions, or ads – into a single, unified view.
Failing to take this comprehensive approach can lead to costly mistakes, like cutting ad spend on channels that bring in your most valuable users. Also, keep an eye out for fraud. For instance, in 2022, 15% of ad impressions on iOS were flagged as fraudulent, and mobile ad fraud surged by over 40% in the latter half of the year.
Using Growth-onomics Data Analytics
For even deeper insights, specialized tools like Growth-onomics can identify where users drop off in the conversion funnel. Their Data Analytics service maps the entire user journey, from ad impressions to key in-app events, helping pinpoint specific friction points.
One of their strategies involves defining custom "activation" events, such as completing a tutorial or making an initial purchase. These milestones are critical indicators of long-term retention. Growth-onomics also segments data by factors like acquisition source, campaign, geography, and device type to uncover whether drop-offs are concentrated within specific user groups.
This granular analysis enables targeted re-engagement strategies. For example, automated push notifications with deep links can guide users back to the exact point in the funnel where they previously dropped off.
Conclusion and Key Takeaways
Summing up the insights from this analysis, it’s clear that keeping an eye on mobile app conversion metrics is what separates thriving apps from those that struggle to grow. As Team Braze aptly states:
Mobile apps don’t succeed by downloads alone. To grow and retain users, marketers need a clear, ongoing view of what’s working, what’s not and where to optimize.
The numbers tell a stark story: many apps are uninstalled quickly, with 40% of users citing "not in use" as the top reason. Without continuous refinement, even the most well-designed app risks losing its audience.
Key Metrics to Watch
There are three metrics you should prioritize:
- Store Listing Conversion Rate: This is your app’s first impression and a major factor in app store rankings.
- Retention Rate: If users don’t return, no other metric will matter. On average, app retention rates drop to just 6% after 30 days.
- Lifetime Value (LTV): This metric predicts the total revenue per user and indicates whether your acquisition efforts are paying off. Though only about 5% of users make in-app purchases, their contribution can be 20 times greater than revenue from other paid users combined.
Revisiting these metrics regularly ensures your strategies evolve alongside user behavior.
Steps to Boost Performance
To improve your app’s performance, start with these actionable strategies:
- Optimize your app store presence: Use benefit-focused screenshots that emphasize user outcomes, not just the interface. Platform-specific testing tools can help identify what drives higher conversions.
- Streamline onboarding: Deliver value within the first 60 seconds. Skip registration or permission requests until users experience their first success with the app.
- Simplify checkout: Offer one-tap payment options like Apple Pay or Google Pay, and use deep linking to guide users directly to relevant in-app pages. Even small improvements, like better user ratings, can significantly boost conversion rates.
These strategies lay a solid foundation for optimizing your app’s performance and keeping users engaged.
How Growth-onomics Can Support You
For a more advanced approach, Growth-onomics offers tailored solutions to transform your app’s conversion data into growth opportunities. Their Data Analytics tools map the entire user journey, identifying drop-off points and their causes. Through Customer Journey Mapping and Performance Marketing, they help lower acquisition costs and maximize LTV. Whether it’s App Store Optimization, A/B testing, or funnel analysis, Growth-onomics provides data-driven strategies designed to fuel sustained growth. Visit growth-onomics.com to see how they can help take your app to the next level.
FAQs
What are the best ways to improve my app’s conversion rate on the app store?
To boost your app’s store conversion rate, start by fine-tuning the essential aspects of your app listing. Pay special attention to your visual assets – your app icon, screenshots, and preview video should highlight your app’s key benefits and standout features in a way that’s clear and appealing. Next, create a short, keyword-focused title and description that not only captures attention but also aligns with what users are searching for.
Another important step is to actively engage with your users. Respond to feedback quickly and encourage positive reviews by addressing concerns and showing that you value their input. Don’t forget to regularly conduct A/B testing on various listing elements to see what connects most with your audience and leads to higher conversions. For those looking for a more analytical approach, Growth-onomics offers customized strategies to help enhance your app’s visibility and overall performance.
How can I increase in-app purchase conversion rates?
Improving in-app purchase conversion rates isn’t just about luck – it’s about smart strategies that make the buying process easier and more enticing. Here’s how you can make that happen:
1. Simplify the Checkout Process
The fewer steps it takes to complete a purchase, the better. Cut out unnecessary steps, use auto-filled fields, and integrate native payment options like Apple Pay or Google Pay. A smooth and quick checkout process reduces the chances of users abandoning their carts.
2. Test and Tweak with A/B Testing
Experiment with different variations of key elements like button text, price presentation, and layout. A/B testing can reveal which changes resonate most with your audience. Pay close attention to where users drop off during the purchase process – this can uncover issues like confusing pricing or a lack of trust signals.
3. Re-Engage with Personalized Offers
When users hesitate, a targeted nudge can make all the difference. Use push notifications or in-app messages to offer discounts, bundles, or limited-time deals. Personalization ensures your offers feel relevant and hard to resist.
4. Build Trust and Create Urgency
Incorporate social proof, like ratings or testimonials, to reassure users about their purchase decision. Additionally, use price anchoring – show the original price alongside the discounted one – to highlight the value of the deal. These tactics not only build confidence but also encourage quicker decisions.
By combining these strategies, you’ll create a more seamless and persuasive experience that encourages users to make a purchase. With the right data-driven approach, turning casual app users into paying customers becomes much more achievable.
Why is the LTV to CAC ratio critical for mobile app growth?
The LTV to CAC ratio measures whether the revenue a user brings over their lifetime (Lifetime Value or LTV) surpasses the expense of bringing them on board (Customer Acquisition Cost or CAC). This metric serves as a solid gauge of whether your app’s growth is both financially sound and worthwhile.
When the LTV:CAC ratio is in good shape, it means you’re not overspending to gain users, and your marketing efforts are delivering lasting returns. It’s an essential metric for guiding decisions about scaling your app and refining your user acquisition strategies.