If a cross-sell model can’t show why it made a recommendation, I shouldn’t trust it blindly.
Here’s the short version: this article shows that explainable AI helps me turn model scores into clear marketing decisions. The main use is simple: pick who to target, choose what to offer, and know when to hold back. In one energy retail case, a model scored 220,185 customers and reached 0.86 AUC, while SHAP showed which factors pushed scores up or down.
What I’d take from the article:
- SHAP is the main tool for both big-picture and customer-level explanations
- LIME helps explain one prediction at a time, but results can shift
- Tree-based models often score well, but they need extra explanation layers
- Simpler models like logistic regression and decision trees are easier to review
- Explainability helps marketing, sales, and compliance teams use the same logic
- It also helps spot when a customer should get service instead of an offer
The article points to use cases across:
- Energy retail
- Hospitality
- Banking
- Subscription businesses
- E-commerce
A few numbers stand out:
- 0.86 AUC in the energy retail case
- 43% of repeated LIME explanations shifted feature rankings by two to three positions
- About 67% of reviewed LIME use cases drew broad segment claims from single-case explanations
Explainable AI Using SHAP, LIME, GINI, and Permutation Feature Importance – D. Datta & S. Ray
sbb-itb-2ec70df
Quick comparison
| Method | What it explains | Main use in cross-sell | Main issue |
|---|---|---|---|
| SHAP | Whole model and single prediction | Propensity scoring, next-best-offer review, audience checks | More compute, harder for non-technical teams to read |
| LIME | Single prediction | Agent support, one-off offer review | Results can change across runs |
| Logistic regression / decision trees | Model logic directly | Review-heavy campaigns, smaller datasets | May score below more complex models |
So the core point is straightforward: explanations do not just support the model – they help people use it. That is what makes explainable AI useful in cross-sell work.
How Cross-Sell Prediction Models Work and Where Explainability Fits
Cross-sell models turn customer data into a ranked list: who to target and what to offer.
They usually pull from purchase history, product ownership, browsing behavior, email engagement, and basic demographic data. Those raw signals are turned into features like RFM scores, category preference, and channel preference. A supervised model then uses those features to produce a propensity score for purchase within a set time window, such as 90 days [10][12]. Teams use those scores to shape email lists, CRM tasks, on-site recommendations, and call-center prompts.
Explainability comes in after scoring. At that point, teams need to answer a simple but important question: why did this customer rank higher than that one? Or, just as important, why does this offer fit better than another? The next section shows how these methods appear in actual cross-sell studies.
Common Model Types in Cross-Sell Research
Three model families show up again and again in cross-sell and upsell work.
- Tree-based ensemble models such as XGBoost, random forests, LightGBM, and Extra Trees are the most common in research. They work well with mixed customer data and non-linear relationships, and they often beat simpler methods on metrics like AUC and F1-score [10][13].
- Recommendation engines such as collaborative filtering, matrix factorization, and learning-to-rank are common in digital channels like e-commerce sites and apps. In those settings, product-to-product and user-to-product relationships shape the ranked recommendations users see [5][16][17].
- CLV-oriented models estimate a customer’s future value. That helps teams decide who should get a cross-sell push first, not just which product to put in front of them [7][14].
Rule-based offers are easy to check, which is a plus. But they often miss interactions between variables and usually perform worse. The tradeoff is familiar: models that perform better are often harder to explain at the individual customer level [10][13]. That choice matters a lot when explanation quality shapes adoption, trust, and campaign design.
The Main Explainability Methods Used in Studies
Among post-hoc explanation methods, two names lead most of the work in cross-sell research: SHAP and LIME.
SHAP (SHapley Additive Explanations) works at both the global and local level. On the global side, it ranks the features that most affect cross-purchase across the full customer base, which helps with strategy and audience design. On the local side, it shows why one customer got a high or low score by breaking that prediction into feature contributions [1][7][14][15]. That mix makes SHAP a strong fit for marketing analytics.
LIME (Local Interpretable Model-agnostic Explanations) has a tighter focus. It changes the data around one customer, watches how the model output moves, and then fits a simple surrogate model around that one case to show the most influential features [6][7][8][9]. In cross-sell and recommendation work, that makes it useful for showing why a certain product was recommended or why one customer received a certain offer instead of another [6][7][8][11]. LIME is strongest for local explanations, while SHAP tends to be more steady across both global and local feature importance [15].
Logistic regression and single decision trees still have a place, mostly as baselines. They give teams a clear reference point when comparing more complex models, and governance teams can audit them without post-hoc explanation tools [12][13].
The next section shows where these explanations improved decisions in energy retail, hospitality, banking, subscription, and e-commerce settings.
Research and Use Cases: Explainable AI in Cross-Sell Decisions
Energy Retail and Hospitality Cases Using SHAP
Applied studies show a simple but important point: explanations can turn model scores into campaign rules that teams can actually use.
In energy retail, researchers modeled cross-sell propensity for 220,185 residential customers with gradient boosting and SHAP. The model used features such as contract type, tenure, and payment regularity. It reached an AUC of 0.86. [22][2][23] Researchers also checked SHAP results against observed purchases, which gave teams more confidence in the targeting logic.
That made the output useful for marketing, not just analytics. Teams used those findings to focus internet upsell campaigns on eco-aware homeowners with stable payment histories. They also tailored messaging around sustainability for green-tariff segments.
The same pattern shows up in service businesses, especially when timing matters.
In hospitality, SHAP pointed to room type, stay length, lead time, and seasonality as key drivers. That led teams toward longer stays in higher-category rooms and pre-arrival package offers for peak-season bookings. [18][19]
In regulated sectors, that same setup can also support tighter offer control and review.
Banking, Subscription, and E-Commerce Recommendation Cases
In banking, SHAP with LightGBM supports both offer targeting and compliance review. [24][25][26][4] In plain terms, it helps teams separate acceptable drivers – like balance and tenure – from risky proxies. It also gives them a way to pause when a sales offer may be the wrong move. For example, customers flagged by complaint history or financial stress can be routed to service recovery instead of a product offer.
That same explanation layer also helps with customer risk and timing across the lifecycle.
Subscription businesses run into a common tension: the strongest upsell prospects may also carry early churn risk. [20][21] SHAP and LIME make those drivers easier to spot, so teams can focus on high-usage, low-complaint segments and hold back customers whose profiles are dominated by negative signals.
Those same signals can shape how recommendations are delivered in digital commerce.
In e-commerce, explanations help both staff and customers understand why a recommendation appeared. [21][3] If SHAP or LIME shows that recent purchases and search behavior drove the recommendation, agents can tailor their outreach with a lot more precision.
Across sectors, these explanation methods helped teams make three core decisions:
- Who to target
- What to offer
- When to hold back
Business Impact, Limits, and Governance: What the Evidence Shows
SHAP vs LIME vs Interpretable Models: Explainable AI for Cross-Sell Marketing
Reported Benefits for Marketing Teams and Campaign Performance
After the use cases above, the main question isn’t whether XAI works. It’s when it improves campaign decisions enough to be worth the added complexity.
Across studies, XAI helps teams turn cross-sell scores into decisions they can explain and use. That matters most in three places: who to target, what to offer, and when to hold back. When marketers can see which features shape each score, they can check whether those drivers line up with known customer behavior, refine audience definitions, and build campaigns around actual behavior signals instead of black-box rankings. That makes targeting rules easier to review and easier to use in campaign planning.
SHAP global importance plots and LIME local summaries also give marketing, analytics, and compliance teams a shared frame for review. Instead of arguing over whether a model feels right, all three groups can look at the same feature rankings, compare them with known buyer personas, and move faster toward campaign changes.
Risks, Tradeoffs, and Governance Requirements
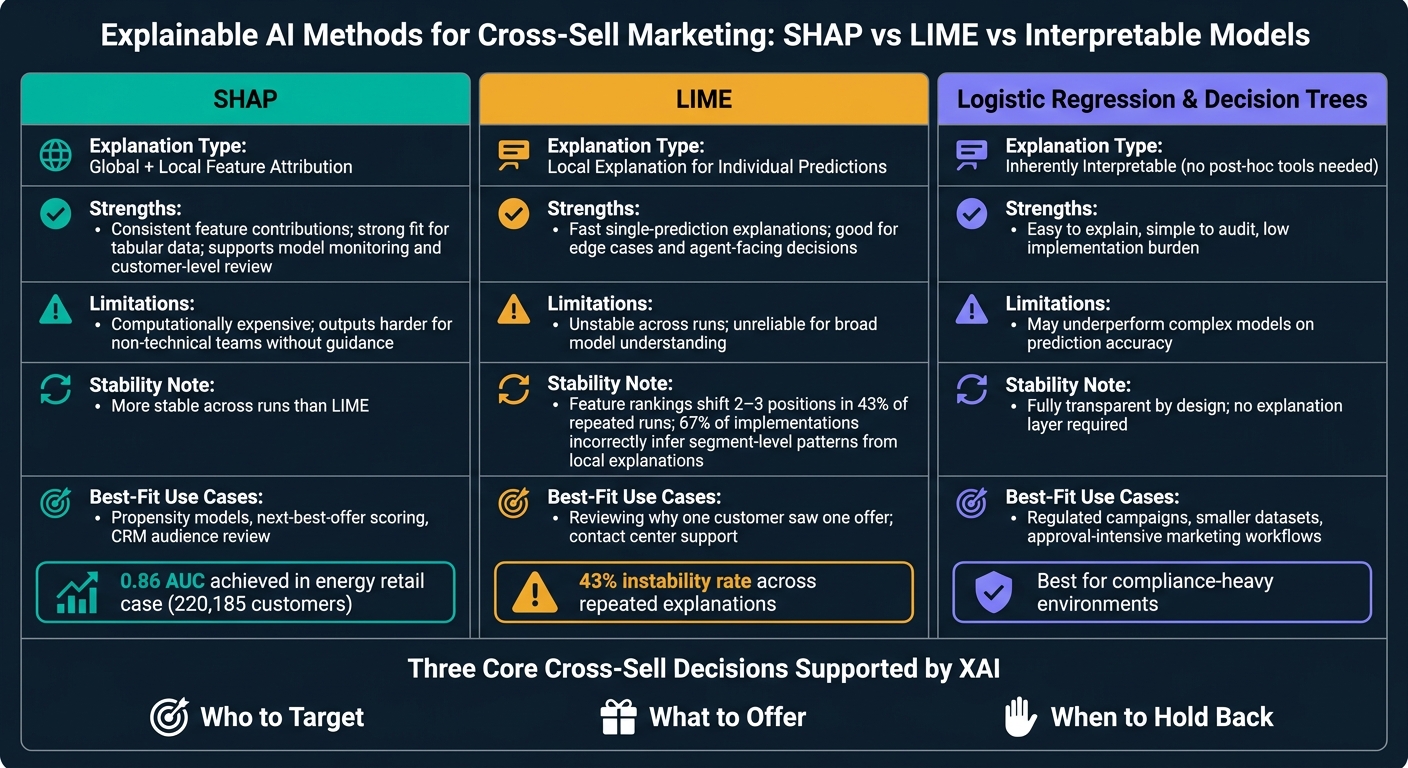
The upside is clear, but the limits matter too. LIME explanations can be unstable. One analysis found that feature importance rankings shift by two to three positions in 43% of cases across repeated explanations for the same instance, and about 67% of analyzed implementations improperly infer segment-level patterns from local LIME explanations. [31] That’s a real problem if a team takes one customer’s explanation and treats it like proof about a whole segment.
SHAP is often more stable for tabular marketing data, but it comes with its own tradeoffs. Computing Shapley values across large datasets or complex ensemble models can get expensive. And the outputs – marginal contributions, base values, and interaction effects – aren’t always easy for non-technical teams to read without help. [22][2][28][30] On top of that, neither method fixes bias by itself. They can expose problematic drivers, but teams still need feature governance, access controls for explanations, and audit trails that log model inputs, explanation outputs, and business rationale, especially in regulated industries. [27][29]
The tradeoff is pretty simple: more explanation can mean more operational value, but not always less complexity.
| Method | Explanation type | Strengths | Limitations | Best-fit cross-sell use cases |
|---|---|---|---|---|
| SHAP | Global and local feature attribution | Consistent feature contributions, strong fit for tabular data, supports model monitoring and customer-level review | Computationally expensive; outputs harder for non-technical teams without guidance | Propensity models, next-best-offer scoring, CRM audience review |
| LIME | Local explanation for individual predictions | Fast single-prediction explanations; good for edge cases and agent-facing decisions | Unstable across runs; unreliable for broad model understanding | Reviewing why one customer saw one offer; contact center support |
| Logistic regression or decision trees | Inherently interpretable | Easy to explain, simple to audit, low implementation burden | May underperform complex models on prediction accuracy | Regulated campaigns, smaller datasets, approval-intensive marketing workflows |
For approval-intensive or regulated campaigns, interpretable baseline models often make more sense than chasing small accuracy gains with a more complex model. The governance burden is lower, and the audit trail is easier to keep clean.
How Growth-onomics Applies Explainable AI Insights
Used well, these explanations do more than defend a score. They help shape the customer journey around it.
Growth-onomics can pair SHAP outputs with customer journey mapping to place offers where receptive behavior is strongest and friction is lowest. Then performance marketing and analytics help close the loop, so the model’s output guides not just who gets an offer, but also how and when that offer reaches them.
Conclusion: Key Takeaways for Marketers on Explainable Cross-Sell AI
Across these studies, the pattern is clear: explainable AI helps marketers use cross-sell scores with more confidence because it shows the drivers behind each recommendation. When teams can see why a model suggested an offer, they can judge whether it fits, tweak the offer, and shape messaging around actual customer behavior.
A good example comes from energy retail. In that case, explainable methods reached 86% AUC across 220,185 customers.[1][2][33] And across the research more broadly, adding explainability doesn’t meaningfully reduce predictive performance. What it does do is improve trust, interpretability, and compliance readiness.[32]
That matters a lot in regulated or relationship-sensitive categories like financial services, energy, and subscriptions. In those settings, explainability gives teams a defensible record for each offer and helps lower trust and compliance risk.
The day-to-day takeaway is pretty simple:
- Require tools that show feature drivers
- Train marketers to use those drivers to refine offers and creative
This gives teams a better shot at spotting model problems early. It also helps them build campaigns around the three decisions that matter most: who to target, what to offer, and when to hold back – instead of leaning on black-box rankings alone.
Explainable AI doesn’t get rid of complexity. It makes cross-sell models more usable, more defensible, and easier to improve.
FAQs
When should I use SHAP instead of LIME?
Use SHAP when you need feature importance for each individual prediction that stays consistent and rests on solid math. It shows how each feature nudges a prediction up or down.
That makes it a good fit for checking complex models and explaining specific cross-sell recommendations. If a marketing team needs a clear reason behind a decision, SHAP helps spell out what drove the model’s output.
How can explainable AI help me avoid bad cross-sell offers?
Explainable AI helps you avoid bad cross-sell offers by replacing black-box decisions with clear, data-driven insights.
Tools like SHAP show what’s behind a recommendation. Instead of guessing why an offer appeared, you can see which factors pushed it forward. That means offers are based on customer behavior that makes sense, not biased data or bad inputs.
It can also spot negative signals that should stop an offer in its tracks. Think unresolved support tickets or recent complaints. If a customer is already frustrated, pushing a cross-sell can do more harm than good.
A few guardrails help keep things on track:
- Frequency caps prevent customers from seeing the same offers too often.
- Feedback loops help the system learn from responses over time.
- Regular model checks make sure recommendations stay accurate and timely.
The result is a cross-sell process that feels more informed, more careful, and a lot less likely to damage trust.
Do simpler models make more sense for cross-sell?
Yes. Simpler models often make more sense for cross-sell when interpretability matters. Methods like logistic regression and decision trees make it easier for marketers to explain why certain customers are being targeted.
They’re also a smart place to start because they’re easier to use and need fewer resources. A lot of teams begin with simple models or plain heuristics, then test more advanced options later if they need to.