

Email read time metrics go beyond open rates to measure how long recipients engage with your emails. They categorize engagement into three levels: Glance/Delete (0–2 seconds), Skim (3–7 seconds), and Read (8+ seconds). This data provides deeper insights into how well your email content performs.
Key Points:
- Why It Matters: Open rates are no longer reliable due to features like Apple’s Mail Privacy Protection. Read time metrics offer a clearer picture of true engagement.
- How It Works: A tracking pixel records the time an email stays open. Tools like Litmus and HubSpot help analyze this data.
- Challenges: Factors like image blocking, proxy servers, and false opens can affect accuracy.
- Improving Read Time: Optimize email design, personalize content, and segment audiences based on engagement patterns.
- Benchmarks: Average email read time is 11.8 seconds, but this varies by industry and email type.
Practical Tips:
- Use Tracking Tools: Employ platforms like Litmus or HubSpot to measure read time effectively.
- Analyze Data: Identify patterns in engagement to refine your content and design.
- Segment Audiences: Tailor content for "readers", "skimmers", and "glancers" to improve overall performance.
- Focus on Mobile: Optimize layouts for mobile devices to prevent engagement drop-offs.
By integrating read time metrics into your email strategy, you can boost engagement, improve sender reputation, and drive better results.
Email Engagement Categories: Read Time Thresholds and Meanings
How to Measure Email Read Time
Tracking Methods and Tools
Measuring email read time often relies on a small but mighty tool: a 1×1 tracking pixel. This tiny image sends a server request every second the email remains open, capturing the duration of engagement.
"Email Analytics is building on the principle of image pixel tracking… we’ve done is take that concept five steps further." – Litmus
Tools like Litmus, Email on Acid, Oracle Eloqua, and HubSpot SalesHub take this concept further by categorizing engagement into predefined bands. For situations where images are blocked, many platforms rely on clickthrough tracking as a backup, recording link clicks to gauge engagement.
Despite the effectiveness of these methods, several challenges can impact the accuracy of tracking.
Measurement Limitations and Challenges
Accurately interpreting email engagement data requires understanding its limitations. For instance, Apple’s Mail Privacy Protection (MPP) pre-downloads email content, including tracking pixels. This process can falsely register an open, making it tricky to confirm if a real person viewed the email – or for how long. Similarly, automated bot actions can trigger false opens or clicks that don’t reflect genuine user interaction. Other factors, like image blocking, proxy servers, and preview panes, can also distort engagement metrics.
"The open rates displayed within your email reporting always exclude ‘proxy opens’ and are calculated based on your ‘confirmed opens.’ This is to ensure that your open statistics aren’t artificially inflated." – Constant Contact
To address these challenges, platforms often filter out proxy data and rely on clickthrough tracking as a backup. Adjusting read time thresholds based on the type of content can also help – for instance, a detailed newsletter will naturally require more time than a quick promotional email.
By integrating these insights into broader analytics platforms, marketers can create a more accurate picture of campaign performance.
Connecting Read Time Data to Analytics Platforms
Modern tools make it easy to connect read time data to your overall marketing analytics. Platforms like Litmus integrate seamlessly with Salesforce Marketing Cloud, Marketo, Oracle Eloqua, and HubSpot SalesHub, offering a unified view of email engagement alongside other customer data.
To ensure accuracy, embed the tracking snippet before the </body> tag and test the email before deployment. Choosing platforms that automatically remove personally identifiable information (PII) from tracking tags is essential for maintaining data privacy. Some advanced tools even report device and client data, which can lead to ROI improvements of up to 43%.
How to Use Read Time Metrics to Improve Email Performance
How to Analyze Read Time Data
To get started, break down your email engagement into three main categories: Glance/Delete (0–2 seconds), Skim (3–7 seconds), and Read (8+ seconds). These benchmarks can help you figure out where your audience is losing interest. For instance, if a large percentage of your readers fall into the Glance/Delete category, it could indicate issues like poor rendering on certain devices or a failure to grab attention right away.
Keep an eye out for unusual patterns. For example, if short emails show engagement times exceeding 30 seconds, it might suggest slow loading speeds or a confusing layout. Similarly, comparing read times across devices can reveal design flaws. If mobile users spend less time engaging compared to desktop users, it could mean your buttons are too small or your design isn’t mobile-friendly.
Here’s a quick reference table to help interpret engagement data:
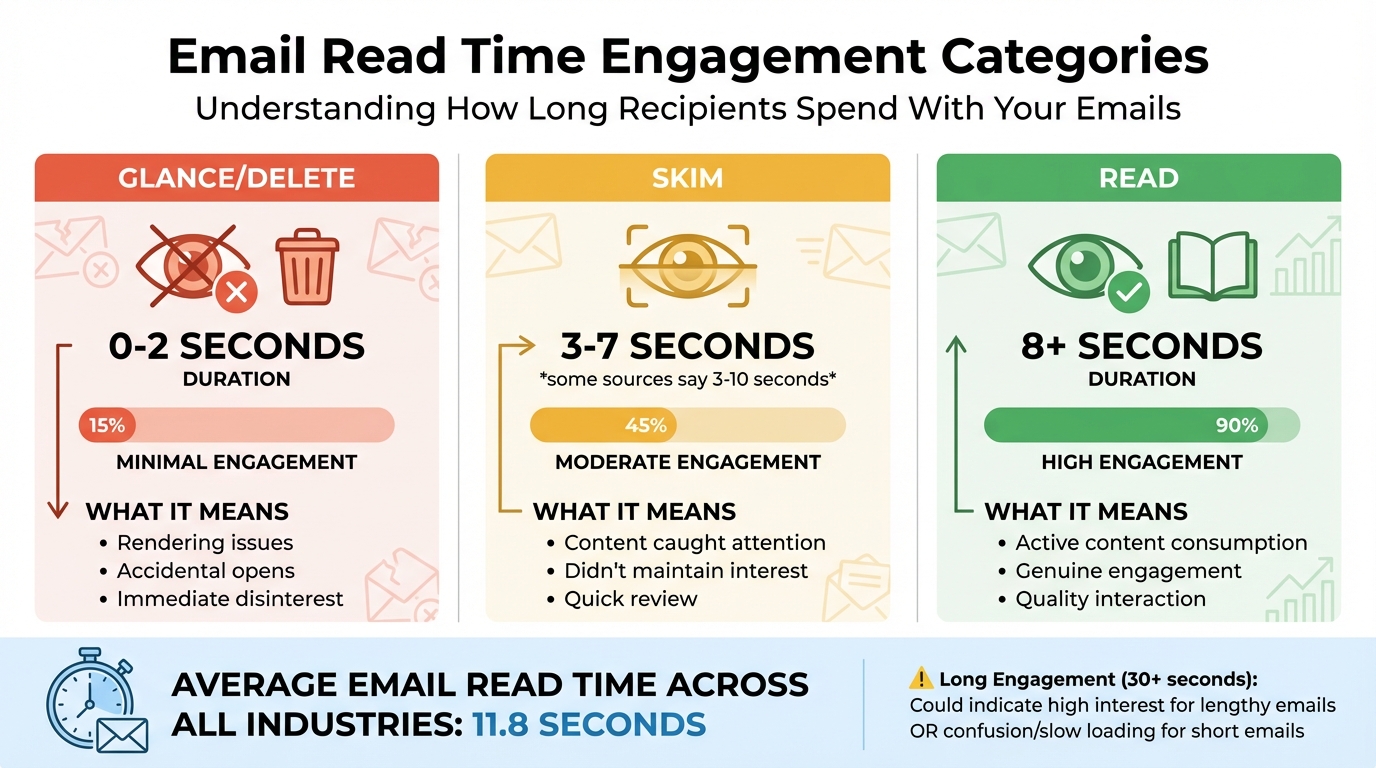
| Engagement Category | Duration | What It Means |
|---|---|---|
| Glance/Delete | 0–2 seconds | Likely caused by rendering issues, accidental opens, or immediate disinterest |
| Skim | 3–7 seconds | Content caught attention but didn’t maintain it |
| Read | 8+ seconds | Indicates active consumption of your content |
| Long Engagement | 30+ seconds | Could mean high interest (for longer emails) or confusion/slow loading (for shorter ones) |
Adjust these thresholds based on your content type. While the average email read time is around 11.8 seconds, this figure can vary widely depending on your audience and the type of emails you send.
Ways to Increase Email Read Time
Once you’ve identified where engagement falls short, take steps to address specific issues. A high Glance/Delete rate often calls for a design overhaul. Start by optimizing for mobile users with responsive layouts and ensuring buttons are large enough for easy tapping. Visual elements like images, GIFs, and videos can also help break up text and make your emails more engaging – these elements have been shown to increase click-through rates by up to 300%.
A great example of personalization comes from Peacock’s 2025 "year-in-review" campaign. By tailoring emails to individual subscribers, they reduced churn by 20% in just 30 days and saw a 6% jump in free-to-paid subscription upgrades.
"Litmus Email Analytics allowed us to pivot the client’s email strategy based on engagement data and create more effective emails. As a result, they saw a 35% increase in open rates."
– Connor Snell, Social Media & Content Strategist, Altos
To maximize engagement, place key content and calls-to-action in the top half of your email, where readers are most likely to focus. Keep subject lines under 40 characters to ensure they display properly on mobile devices. Experiment with different tones and personalization techniques to improve both open rates and engagement quality.
Audience Segmentation Using Read Time Data
Beyond improving design, segmenting your audience based on read time can refine your email strategy even further. Use engagement patterns to create tailored segments. For instance, readers who consistently spend 8+ seconds engaging with your emails might appreciate long-form content like embedded blog posts. On the other hand, "Skimmers" tend to prefer short, image-heavy updates.
Mercari demonstrated the power of this approach between 2021 and 2024. By using behavioral segmentation to deliver personalized messages at scale, they achieved a 70% year-over-year increase in U.S. gross merchandise volume and grew their user base to 2 million monthly active users.
Don’t overlook "graymail" subscribers – those who receive your emails but never engage. Email lists naturally degrade over time, so removing inactive recipients helps maintain your sender reputation and ensures better deliverability. For subscribers with declining engagement, consider running re-engagement campaigns before deciding to remove them.
Finally, analyze which email clients your most engaged readers use, such as Gmail, Outlook, or Apple Mail. Prioritize testing in these environments to optimize performance. Brands that leverage advanced analytics like read time segmentation often see up to 43% higher ROI compared to those relying on basic metrics alone.
At Growth-onomics, we specialize in helping businesses implement these data-driven strategies through advanced analytics and customer journey mapping to elevate email performance.
Read Time Benchmarks, Common Mistakes, and Advanced Tactics
Email Read Time Benchmarks by Industry
On average, people spend about 11.8 seconds reading an email across all industries. But this number isn’t a one-size-fits-all measure. The type of email you’re sending plays a huge role in how much time your audience should spend on it. For instance, a detailed newsletter will naturally require more attention than a quick, image-heavy promotional email. So, comparing your email’s performance to this general benchmark might not give you the full picture.
Instead, tailor your benchmarks to fit your content. For longer, educational emails, aim for higher read times. On the other hand, short promotional emails can still be successful if they hit that 10+ second engagement mark. The key is to push as many subscribers as possible out of the "Glance/Delete" zone. A high rate in this zone often points to issues like poor rendering or irrelevant content.
These tailored benchmarks can help you identify performance issues and improve your email strategy.
Common Mistakes When Using Read Time Metrics
A common pitfall is treating read time as the ultimate measure of success. For example, if a short promotional email shows a 30-second engagement, it might not be a good sign – it could mean your images are taking too long to load or your content is unclear. Similarly, assuming that longer engagement is always better misses the point that different types of content demand different levels of attention.
"Engagement Time tells us how long subscribers are spending with your email, but it’s not as straightforward as longer being better." – Luke Glasner
Another mistake is looking at read time in isolation. Even if engagement is high, it doesn’t mean much if it doesn’t lead to clicks or conversions. Plus, technical glitches like slow-loading elements can skew your data.
Recognizing these errors is essential before diving into more advanced analysis techniques.
Advanced Ways to Apply Read Time Data
Once you’ve avoided the common missteps, you can use read time data to fine-tune your audience targeting and improve campaign performance.
- Segment your audience: Subscribers who engage for 10+ seconds might be more receptive to detailed, long-form content. Meanwhile, those in the Glance/Delete category may respond better to short, visually driven updates.
- Analyze device-specific behavior: If mobile users consistently show lower engagement than desktop users, it could signal issues with your email layout, font size, or button design.
- Build an engagement scoring system: Combine read time with other metrics like clicks, forwards, and conversions to create a composite score. This helps you identify subscribers who not only read your emails but also take meaningful actions.
At Growth-onomics, we help businesses turn engagement data into actionable insights by developing scoring models and mapping customer journeys. This approach ensures your campaigns are not just engaging but also driving growth.
sbb-itb-2ec70df
Conclusion: What You Need to Know About Email Read Time Metrics
Summary of Main Points
Let’s revisit the key takeaways about email engagement metrics. Email read time tracks how long subscribers spend viewing your emails, using a pixel that fires every second to gather data. Unlike open rates, which only tell part of the story, read time helps distinguish between someone who quickly deletes your email and someone who genuinely interacts with its content.
Here’s a breakdown of engagement thresholds:
- Glance/Delete: 2 seconds or less
- Skim: 3–10 seconds
- Read: 8 seconds or more
However, these benchmarks aren’t one-size-fits-all. A lengthy newsletter requires more time than a quick promotional email, so it’s essential to adjust expectations based on the content type. High glance rates could signal issues like poor rendering or slow load times, while low engagement overall might indicate the need to rethink your content strategy.
Read time becomes even more valuable when paired with other metrics. For example, a high read time on a short email might suggest technical issues or user confusion rather than success. Similarly, if read time is high but lacks corresponding clicks or conversions, it might not translate into real business outcomes. The key is to segment your audience based on their engagement patterns – crafting detailed content for those who read deeply and more visual, quick updates for skimmers.
These insights provide a solid foundation for improving your email campaigns.
Next Steps for Using Read Time Data
Now, let’s talk about putting this data to work. Start by implementing tracking tools to measure engagement duration and syncing this information with your analytics platform. Define custom thresholds for different campaign types, and dig into device-specific performance. For instance, if mobile users consistently show lower read times than desktop users, it’s a clear sign to optimize your emails for mobile. This could mean using larger buttons, easy-to-read fonts, and responsive designs.
Consider building an engagement scoring system that combines read time, clicks, forwards, and conversions to identify your most valuable subscribers. Use this data to fine-tune your content strategy, clean up your email list by removing inactive contacts, and schedule emails to land at times when your audience is most likely to engage. These steps align with the data-driven strategies we’ve discussed and can help ensure your campaigns deliver results.
At Growth-onomics, we specialize in turning engagement data into actionable growth strategies. Through tools like Customer Journey Mapping and Data Analytics, we help ensure your email campaigns achieve measurable success.
7 Best Email Tracking Software Tools 2024 (For Sales & Marketing Teams)
FAQs
How do email read time metrics provide better insights than open rates?
Email read time metrics measure how long recipients interact with your email, breaking engagement into three categories: glance (less than 2 seconds), skim (2–8 seconds), and read (over 8 seconds). Unlike open rates, which only indicate that an email was opened, these metrics reveal how much attention your content actually gets.
By analyzing how long readers stay engaged, you can pinpoint what captures their interest and use that knowledge to fine-tune future campaigns. This deeper level of insight helps you adjust your content strategy to drive stronger engagement and connect more effectively with your audience.
What makes it difficult to measure email read time accurately?
Measuring how long someone spends reading an email is tricky because it relies on indirect cues rather than exact tracking. Most systems use a small tracking pixel that activates when an email is opened and stops when it’s closed. But this approach has its flaws.
For instance, the pixel can be triggered by preview panes or automatic image loading, which might register as a ‘skim’ or ‘glance,’ even if the email wasn’t actually read. On top of that, there’s no universal definition for what counts as ‘read,’ ‘skim,’ or ‘glance,’ and some tools limit their tracking to 20 seconds, potentially overlooking longer reading sessions. Privacy features and image-blocking settings add another layer of complexity by preventing the pixel from loading at all.
While email read time can offer insights into engagement, it’s crucial to interpret the data with these limitations in mind.
How can I improve email read time across different devices?
Email read time, often referred to as engagement time, tracks how long a subscriber keeps an email open. This is usually grouped into three categories: Glance/Delete (2 seconds or less), Skim (about 2–8 seconds), and Read (8 seconds or more). The goal? Get more subscribers into the “Read” category to maximize engagement.
To improve read time, start by ensuring your email design is clean and responsive across all devices. If the layout breaks or fonts don’t load, readers are likely to close the email immediately. A strong subject line paired with a concise pre-header can set the tone and grab attention. Make sure your key message is front and center – ideally within the first couple of lines of text. Keep images small (under 100 KB) to ensure fast loading and use descriptive alt text to make your content accessible. Personalization is another game-changer. Tailor your content and segment your audience to keep the email relevant, and don’t forget to include a clear, compelling call-to-action (CTA) early on.
Tools like Growth-onomics can help you dig into your read-time data, experiment with different layouts, and refine your content strategy. By applying these tactics, you can shift more subscribers from “Glance” and “Skim” into the “Read” category, no matter what device they’re using.