

Predictive Customer Lifetime Value (CLV) models rely on three key data types: transactional, demographic, and behavioral. These models analyze past transactions and customer behavior to forecast future spending patterns, helping businesses make informed decisions about marketing, retention, and budgeting. Here’s what you need:
- Transactional Data: Includes fields like Customer ID, Transaction Date, and Monetary Value. This data forms the foundation for calculating Recency, Frequency, and Monetary (RFM) metrics.
- Demographic Data: Information such as age, gender, location, and income enriches transactional data, providing deeper insights into customer profiles.
- Behavioral Data: Captures interactions like browsing history, email engagement, and loyalty program activity to reveal customer intent and engagement levels.
Clean, consistent, and well-organized data is essential for accurate predictions. Aim for at least 1–2 years of historical data with a minimum of 2–3 transactions per customer. Proper data preparation, including removing duplicates and handling outliers, ensures reliable results. By integrating these data types, businesses can identify high-value customers, reduce churn, and optimize acquisition costs effectively.
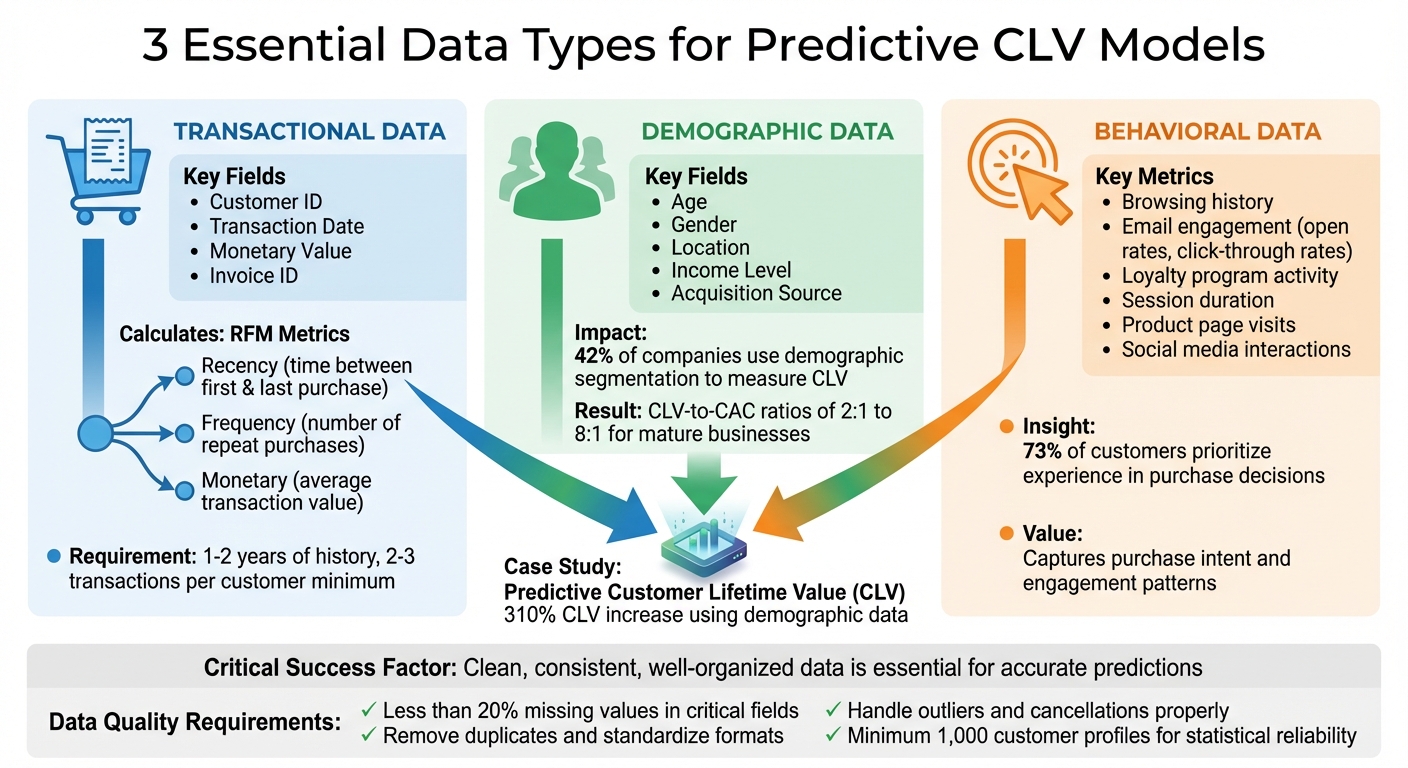
Three Essential Data Types for Predictive CLV Models
Full Tutorial: Customer Lifetime Value (CLV) in Python (Feat. Lifetimes + Pycaret)
Transactional Data Requirements
Transaction data forms the backbone of predictive CLV models. To get started, your dataset needs four essential fields: Customer ID, Transaction/Invoice ID, Transaction Date, and Monetary Value. These are the building blocks for identifying purchase patterns, which drive accurate forecasting.
Adding product-level details can take your analysis to the next level. Fields such as Stock Code (product identifier), Description, and Quantity allow you to calculate total sales per transaction and segment customers more effectively. This deeper level of detail helps uncover not just how much customers spend, but also what they’re buying and how their preferences shift over time.
Returns and cancellations are another critical piece of the puzzle. For example, invoice numbers starting with "c" typically indicate canceled transactions, which should either be excluded or incorporated into net value calculations. Overlooking these adjustments can inflate your CLV predictions, leading to flawed marketing decisions. Properly handling returns ensures your forecasts stay reliable.
Required Transaction Fields
Transforming raw transaction logs into actionable insights requires specific fields. The table below outlines the key fields and their roles in predictive modeling:
| Field Name | Description | Use in Modeling |
|---|---|---|
| Customer ID | Unique identifier for each user | Links transactions to individual customer behavior |
| Invoice Date | Timestamp of the transaction | Calculates Recency, Frequency, and Age (T) |
| Total Sales | Quantity multiplied by Unit Price | Input for Monetary Value in Gamma-Gamma models |
| Recency | Time between first and last purchase | Determines the probability of a customer being "alive" |
| Frequency | Number of repeat purchase time periods | Predicts future transaction volume |
| Monetary Value | Average value of a customer’s repeat sales | Predicts the average value of future transactions |
The T metric is crucial for understanding customer behavior over time. It measures the interval between the first purchase and the observation end. For example, five purchases in 10 days reflect a very different pattern than five purchases over 10 months. Including this metric ensures your frequency calculations are grounded in the right context.
These foundational fields pave the way for calculating RFM metrics, which we’ll dive into next.
Purchase Pattern Metrics
With the transaction fields in place, RFM metrics (Recency, Frequency, Monetary) provide a deeper look into customer behavior. These metrics fuel probabilistic models like BG/NBD and Gamma-Gamma.
- Frequency tracks repeat purchases (total transactions minus one).
- Recency measures the time span between the first and last transaction.
Customers with high frequency and recent activity are often still engaged and likely to purchase again. On the other hand, a customer who has a high frequency but hasn’t purchased in months may be at risk of churn. This granular insight into individual customers sets predictive models apart from simple averages.
Before applying the Gamma-Gamma model to forecast monetary value, check one key assumption: frequency and monetary value should not be correlated. For example, a retail dataset showed a weak correlation of 0.14, confirming the model’s validity. Run a Pearson correlation test on your data – if you find a strong relationship between purchase frequency and spending, the Gamma-Gamma model might not deliver accurate results.
Lastly, filter out one-time buyers when using BG/NBD or Gamma-Gamma models. Customers with a frequency of zero (only one purchase) are often treated as "churned" or inactive by these models. Excluding or modeling them separately ensures your repeat-purchase predictions remain accurate and focused.
Demographic and Profile Data
Transactional data tells you what customers buy, but demographic data sheds light on who they are. Details like age, gender, location, income level, and occupation help create customer profiles that can predict future shopping behavior. When paired with transaction history, these insights provide a comprehensive view, enabling highly accurate predictive CLV (Customer Lifetime Value) models. In essence, demographic data enriches transactional information, making predictive models far more effective.
Interestingly, 42% of companies use demographic segmentation to effectively measure CLV. Mature digital businesses often achieve CLV-to-CAC (Customer Acquisition Cost) ratios ranging between 2:1 and 8:1, underscoring the value of this approach.
"Customer lifetime value is one of our core metrics. It’s a topic we’re driving intensively at all levels of the organization and we have set clear goals from which we can only deviate in exceptional cases."
- Emmanuel Thomassin, Chief Financial Officer, Delivery Hero
Key Demographic Fields
Certain demographic fields play a critical role in CLV modeling. Age and gender, for example, reveal patterns in product preferences and long-term behavior. Location enables precise geographic targeting and helps identify which channels resonate most with specific audiences. Income and occupation provide clues about spending capacity, helping businesses pinpoint high-value customer segments. Additionally, understanding the acquisition source is vital for calculating CAC and determining which marketing channels yield the most profitable customers over time. These fields are essential for crafting targeted strategies and improving CAC calculations.
A great example of success in this area comes from Boyner, a Turkish retailer. In 2024, they used AI-powered tools and first-party data to focus on acquiring high-value customers. The result? A 310% increase in CLV, 240% more new customers, and a 20% reduction in acquisition costs.
Machine learning models like Random Forest and Gradient Boosting take these demographic features and combine them with transactional data to uncover complex, non-linear patterns that might otherwise go unnoticed. For instance, a 2022 study analyzing 541,000 e-commerce transactions found that using K-Means clustering – which integrates both demographic and behavioral data – led to higher repeat purchase rates and better retention.
Beyond demographic insights, unique identifiers help ensure consistency across channels.
Customer Identifiers
Customer Data Platforms (CDPs) bring demographic data together from sources like CRM systems and social media, linking it to transaction records through unique identifiers such as Customer IDs or email addresses. For anonymous users, browser-based profiles help maintain accurate cross-channel recognition.
To avoid errors during model training, it’s essential to standardize data formats (e.g., MM/DD/YYYY for dates or USD for currency). Regular data cleaning – like removing duplicates and validating fields – prevents inaccuracies that could derail marketing efforts. Additionally, anonymizing personally identifiable information (PII) and securing explicit consent ensures compliance with regulations like GDPR and CCPA. These steps are crucial for building a reliable foundation for predictive modeling and targeted strategies.
Behavioral and Engagement Data
Behavioral data goes beyond transactional records and demographic profiles to show how customers interact with your brand. This includes actions like browsing history, product page visits, website navigation, app log-ins, email engagement, and social media activity (e.g., likes and shares). These behaviors provide critical insights into product interest and early signs of purchase intent.
What makes behavioral data so impactful is its ability to capture individual patterns that averages simply can’t. For instance, a customer who spends 10 minutes browsing product pages every Thursday is quite different from someone who visits once a month and leaves almost immediately. These detailed behaviors allow predictive models to distinguish active customers from those who may have already disengaged.
"Features are personal attributes that can be based on behavioral or demographic information, like whether or not someone opened an email on a Thursday, or what IP address they typically purchase from when shopping online." – Retina.ai
Behavioral data also expands the concept of customer value by including referral activity and social engagement. Referrals and actions like sharing content or growing your social media following contribute to the overall value a customer brings to your brand. Consider this: 73% of customers prioritize experience when making purchase decisions, and 96% say excellent service fosters loyalty. While demographic and transactional data explain who your customers are and what they buy, behavioral data reveals the deeper story of how they engage.
Website and App Interaction Metrics
Metrics like browsing history, product views, and session duration are essential for calculating Customer Lifetime Value (CLV). Pages per session is a strong indicator of how engaging your content is – higher numbers often correlate with a lower likelihood of churn. Similarly, average session duration highlights which products or services capture the most interest, helping to predict future purchase behavior. For businesses with apps, metrics like daily active users (DAU) measure how "sticky" your platform is, signaling ongoing engagement.
These metrics also align with Recency, Frequency, and Monetary (RFM) analysis. Behavioral timestamps help identify how recently a customer interacted with your brand and how often they return – key indicators of whether they are still engaged or have churned. Advanced probabilistic models, such as "Buy Til You Die" (BTYD), use these patterns to estimate whether a customer is still "active" or has likely churned.
With diverse datasets that include browsing behavior, email interactions, and social media activity, these models uncover complex relationships that might otherwise go unnoticed.
Email and Loyalty Program Data
Email engagement data – like open rates, click-through rates, and patterns such as opening emails on specific days – provides valuable predictive insights. Loyalty program data, including points earned and redemption history, offers another layer of understanding. Customers who actively redeem rewards show a higher level of engagement, which often translates to greater lifetime value. Social media metrics, such as followers, likes, and reposts, highlight indirect value through brand advocacy.
"Value may also indicate product demand, referring to direct product purchases or indirect website visits, app log-ins, or product page views." – Retina.ai
Even without demographic data, behavioral RFM segmentation can be enough for effective CLV modeling. The key is to consistently track these interactions across all channels and link them to transaction records using unique identifiers like Customer IDs or email addresses. This approach creates a complete view of customer engagement, improving the accuracy of predictive models. These behavioral insights directly inform model calibration, ensuring high-quality data preparation and reliable predictions.
sbb-itb-2ec70df
Data Quality and Preparation
For predictive CLV models to deliver accurate results, the data they rely on must be clean and reliable. Errors, inconsistencies, or outliers in the input data can compromise the model’s accuracy, even if the results seem plausible at first glance. This makes data cleaning and preprocessing absolutely critical before diving into model development.
The importance of this step is clear. For example, one study forecasted a CLV of $471,000 per customer, but 75% of customers actually spent less than $2,000. The issue? A few high-value wholesale transactions skewed the average, highlighting the need to address outliers effectively.
Consider a UK online retailer that used UCI data to build a CLV model. They began by cleaning cancellation markers in the ‘InvoiceNo’ field, calculating ‘TotalSales,’ and organizing the data into an RFM (Recency, Frequency, Monetary) format. Only after these steps could they accurately predict customer purchases and profits over the next 30 days. This showcases how thorough data preparation is a non-negotiable step in creating reliable models.
Minimum Data History
To build effective predictive models, you need a solid foundation of historical data. Most enterprise platforms recommend 6 months to 1 year of transaction history as a starting point. However, 2 to 3 years of data is ideal for capturing long-term trends and customer lifecycles. Additionally, each customer ID should have at least 2 to 3 transactions spread across multiple dates to establish meaningful patterns. Without this depth, the model may struggle to differentiate between one-time buyers and loyal customers.
The length of historical data also depends on your prediction goals.
"To accurately predict CLV for the set time period, a comparable period of historical data is required. For example, if you want to predict CLV for the next 12 months, have at least 18–24 months of historical data." – Microsoft Dynamics 365
Seasonal businesses face unique challenges. If your business experiences annual spikes, like holiday shopping surges, you’ll need more than a year of data to ensure the model doesn’t misinterpret seasonal trends as permanent shifts. Additionally, a dataset of at least 1,000 customer profiles within the prediction window is typically necessary to achieve statistical reliability.
Once you’ve gathered enough data, the next step is meticulous cleaning and preprocessing to ensure accuracy.
Data Cleaning and Preprocessing
Combining datasets often introduces duplicates and inconsistent labels (e.g., "N/A" versus "Not Applicable"), which need to be standardized for proper analysis. Predictive algorithms also struggle with missing data, so you’ll need to either remove or impute missing values during preprocessing. Ideally, critical fields like Transaction ID, Date, and Amount should have less than 20% missing values to maintain the model’s reliability.
Here are some key cleaning steps:
- Remove records with null CustomerIDs, as these entries can’t be tracked over time.
- Exclude negative transaction values (typically representing returns or cancellations) and zero-spend records, which could distort the model.
- Convert fields like InvoiceDate to a datetime format and ensure monetary values are stored as floats for accurate calculations.
- Standardize units across datasets, whether it’s time (e.g., days or weeks), currency (e.g., dollars), or quantities, to maintain consistency.
For more advanced models like Gamma-Gamma, check that transaction frequency and monetary value are independent using Pearson correlation.
"The probability of being alive is calculated based on the recency and frequency of a customer." – Hariharan
Transform raw transactional data into a summary table with key metrics like Recency, Frequency, Monetary value, and T (customer age or time since their first purchase). This structured data is then ready for predictive models like BG/NBD.
| Data Quality Characteristic | Description |
|---|---|
| Validity | Ensures data complies with business rules or constraints |
| Accuracy | Reflects how closely data matches true values |
| Completeness | Measures whether all required data is available |
| Consistency | Verifies uniformity within and across datasets |
| Uniformity | Ensures standardized measurements across datasets |
When dealing with outliers, it’s essential to determine if they reflect genuine high-value customers or data errors. For instance, wholesale transactions in a retail model might need to be excluded to avoid skewing predictions. Additionally, keep an eye on error metrics like Mean Absolute Error (MAE) and Root Mean Squared Error (RMSE). If these metrics increase, it’s a sign the model may need retraining with updated data.
Data Volume and Sources
Dataset Size and Historical Depth
The size and depth of your dataset play a major role in how accurately you can predict customer lifetime value (CLV). Studies show that increasing data volume and variety can improve CLV prediction by 15.2% and churn prediction by 13.4%.
"Accuracy of CLV and churn prediction is predicated on complete data." – Amperity
To enhance accuracy, align your data collection with the full span of your customer lifecycle. If you’re working with limited data, a shorter timeframe – such as one to three months – can serve as a temporary proxy. However, longer historical data generally leads to more reliable forecasts. For example, probabilistic models like BG/NBD need sufficient historical data to calculate key metrics such as recency (time between the first and last purchase), frequency (number of repeat purchases), and the customer’s "age" (time since their first purchase). Ideally, you should aim for 1 to 2 years of transactional data for these models.
Your dataset should also be large enough to identify repeat purchasers. Customers with zero repeat purchases are often handled separately or excluded from monetary models like Gamma-Gamma. Once you have enough historical data in place, the next step is ensuring its quality and sourcing.
Data Collection Sources
In addition to having a robust dataset, the sources of your data are just as critical to building reliable CLV models. High-quality data is the foundation for accurate predictions, and this begins with where and how you collect it.
The primary sources for CLV modeling are your CRM and ERP systems, which store historical transaction records, customer identifiers, and details about customer relationships. E-commerce platforms also play a key role by tracking purchase frequency, transaction amounts, and product interactions. For insights into customer behavior and engagement, analytics tools can monitor browsing history, email activity, and participation in loyalty programs.
"CLV forecasts help you make forward-looking decisions around inventory, staffing, production capacity, and other costs. Without a forecast, you could unknowingly overspend and waste money or underspend and struggle to keep up with demand." – Austin Caldwell, Senior Product Marketing Manager, NetSuite
Other valuable data sources include POS systems, marketing automation platforms, and tools like Google Analytics (or GA360). Using API connectors and data warehouses can help you consolidate transactional, demographic, and behavioral data into a single, unified system for modeling. Automating data collection through your ERP or CRM not only reduces manual errors but also streamlines large-scale tracking and analysis.
Conclusion
Creating accurate predictive CLV models boils down to three key data types: transactional (purchase frequency, amounts, timestamps), demographic (age, location, acquisition source), and behavioral (engagement metrics, browsing history). These categories reveal what customers buy, who they are, and how they interact with your business.
The quality of your data is just as important as its breadth. As Amperity aptly puts it:
"Analysts and data scientists are always tuning their algorithms… They’re also obsessed with the quality of the data that’s fueling their models, citing the common wisdom of ‘garbage in, garbage out.’"
Poor data leads to inaccurate predictions, which in turn result in misguided marketing strategies.
Once your data is clean and organized, you can segment customers into meaningful groups and tailor your outreach. Telmo Silva, Founder and CEO of ClicData, highlights the value of this approach:
"Understanding the financial value of each customer allows you to: Make smarter, more targeted marketing decisions; Optimize resource allocation; Strengthen loyalty programs."
This shift from generic campaigns to highly personalized strategies enables you to focus on retaining your most valuable customers while fine-tuning acquisition efforts.
With the data preparation strategies outlined earlier, you can start by leveraging your current insights. Begin with the data you have and scale your models as your datasets grow. Regularly retraining these models ensures they stay relevant amidst seasonal changes and market trends. By focusing on data quality and selecting a model that aligns with your business needs, you can transform CLV insights into actionable strategies that drive long-term growth and profitability. This underscores the importance of maintaining data integrity and adapting your models as your business evolves.
FAQs
What’s the difference between transactional, demographic, and behavioral data in predictive CLV models?
Transactional data zeroes in on what customers purchase and when they do it. This includes details like purchase dates, amounts spent, and how often they buy. These insights are key for calculating metrics such as average order value and purchase frequency.
Demographic data paints a picture of who your customers are. It covers characteristics like age, gender, income, household size, and location. By using this information, you can group customers into segments and uncover trends within various demographics.
Behavioral data reveals how customers interact with your brand. It tracks actions such as website visits, email opens, and app activity. This type of data sheds light on engagement levels and can improve the accuracy of customer lifetime value (CLV) predictions.
To sum up:
- Transactional data: Focuses on what customers buy and when.
- Demographic data: Explains who your customers are.
- Behavioral data: Highlights how customers engage with your brand.
What steps can businesses take to ensure accurate and consistent data for predictive CLV models?
To build accurate and reliable predictive CLV models, businesses need to prioritize gathering and maintaining high-quality data. Start by identifying crucial data points: unique customer IDs, transaction dates (formatted as MM/DD/YYYY), order types, purchase amounts (in USD with two decimal places), and purchase frequency. A unified customer identifier is essential for linking data across different channels, reducing the risk of duplicates or missing records.
Automating validation processes is another critical step. These systems can flag issues like incomplete fields, out-of-range values, or inconsistencies. Regular data audits, de-duplication efforts, and timezone adjustments play a big role in keeping datasets clean and trustworthy. Make data completeness a top priority by ensuring all necessary fields are consistently captured and monitored.
For specialized support, you might want to collaborate with a data-focused agency like Growth-onomics. They can assist in creating strong data-governance strategies, integrating multiple data sources, and validating inputs – helping your CLV models produce insights you can confidently act on.
Why do predictive CLV models need at least 1–2 years of historical data?
Predictive CLV models use historical data to uncover patterns in customer behavior – things like how often they make purchases, their spending habits, and even seasonal buying trends. Ideally, having 1–2 years of data provides a solid foundation to capture these patterns and create a dependable model.
This amount of data enables the model to make reliable forecasts, often extending up to 24 months into the future. By analyzing consistent trends over time, the model can deliver insights that are both meaningful and actionable. Without enough historical data, however, predictions can fall short, lacking the depth needed to support sound decision-making.