

Cross-channel budget forecasting is a modern approach to allocating marketing spend across platforms like social media, search, email, and display ads. Unlike traditional methods, it connects the customer journey across multiple touchpoints, helping businesses understand which efforts drive results. This strategy is especially relevant as marketing budgets face tighter scrutiny, with companies spending 11.4% of their total budget on marketing and executives being 44.6% more likely to cut marketing during profit dips.
Here’s what you need to know:
- Why It Matters: Consistent messaging across channels can increase revenue by 23% and average order values by 13%. It also minimizes wasted spend on ineffective channels.
- How It Works: By analyzing customer journeys and historical data, cross-channel forecasting identifies which channels influence conversions, replacing outdated last-click attribution.
- Key Steps:
- Define clear, measurable goals tied to financial outcomes.
- Map customer journeys to understand how different channels contribute to conversions.
- Use historical data to create accurate forecasts and choose the right forecasting model (e.g., Marketing Mix Modeling for multi-channel campaigns).
- Allocate budgets strategically using frameworks like the 70-20-10 rule: 70% on proven channels, 20% on developing channels, and 10% on experiments.
- Regularly analyze performance and adjust budgets to optimize results.
How to Optimize your Cross-Channel Campaigns’ Performance by +77% | Nexoya Webinar
sbb-itb-2ec70df
Setting Goals and Understanding Your Audience
Before diving into forecasting, it’s crucial to define clear goals and understand customer behavior. This approach helps eliminate the guesswork that often fails to persuade CFOs.
Setting SMART Business Goals
Start by focusing on one specific outcome for a 30-day period. Whether your aim is driving more traffic, acquiring first-time buyers, or increasing online sales, narrowing your focus ensures measurable results. Trying to juggle multiple goals at once only dilutes your efforts and makes it harder to track progress.
To shift the perception of marketing from a "cost center" to a revenue driver, tie your objectives directly to financial outcomes. For instance, instead of setting a vague goal like "increase brand awareness", aim for something tangible – like acquiring 500 first-time buyers at a $45 customer acquisition cost.
Another key strategy is adopting "path views" to measure how every channel contributes to your goals. Don’t rely solely on last-click metrics. For example, a video impression might spark initial interest, a click on an open-web ad could build consideration, and a view on a retailer’s product page might seal the deal. Reliable event tracking is essential to capture these contributions accurately and measure your success.
Once you’ve set measurable goals, align them with the customer journey. This allows you to identify and optimize every touchpoint that influences the buyer’s decision-making process.
Mapping the Customer Journey
Today’s customers rarely follow a straight path to purchase. For instance, in 2026, a typical journey might start with a social media scroll, move to a product page on a retailer’s site, and end with a display ad prompting the final purchase. Budget forecasting needs to account for these "assists" rather than giving all credit to the last click.
"The job isn’t to bet on a single moment; it’s to make sure the story hangs together as people bounce around." – Elliott Moore, Global Content Manager, Criteo
To better allocate your budget, identify which channels serve as "assists" and which act as "closers". For example, video content often sparks interest, social media provides quick education, and retail media frequently drives the final decision. Recognizing these roles ensures that upper-funnel tactics are valued appropriately, even when they don’t directly close a sale. Tools like Growth-onomics Customer Journey Mapping services can help visualize these non-linear paths, making it easier to allocate budgets to the touchpoints that truly matter.
Accurate tracking is the backbone of successful goal measurement and journey mapping. It’s also important to monitor frequency and saturation thresholds for each channel. Every platform has a point where additional spending stops being effective. Use household-level frequency caps to prevent ad fatigue and reallocate budgets once a user has been sufficiently exposed. Start by targeting high-intent audiences, such as site visitors and cart abandoners, and use contextual placements to establish a baseline. From there, expand your efforts strategically based on actual performance data.
Analyzing Historical Data and Choosing Forecasting Models
Once you’ve mapped out the customer journey, the next step is to create a forecast based on actual performance data. This involves gathering information from all channels and selecting a model that aligns with your business needs.
Gathering and Interpreting Historical Data
Start by ensuring your data reflects when impressions or clicks occurred, not when invoices were paid. For example, if a paid social campaign ran in February but the invoice arrived in March, log the expense under February. This approach ensures accurate metrics for CAC (Customer Acquisition Cost) and ROAS (Return on Ad Spend).
Gather data from various sources:
- Use platform delivery logs for paid search and social campaigns.
- Rely on DSP logs and publisher confirmations for programmatic campaigns.
- Reconcile affiliate data directly in your CRM.
It’s crucial to cross-check end-of-month delivery data from platforms like Google, Meta, and DSPs against invoices. This helps catch any late-posting costs or credits.
The goal is to establish a single source of truth by consolidating all data – platform and non-platform leads – into a trusted system like your CRM. This ensures your records reflect the actual pipeline and revenue impact. For example, in 2026, awork.io used Marketing Mix Modeling through the Funnel platform to analyze historical data. They discovered that paid social drove far more downstream conversions than GA4 had indicated. This insight led them to reallocate 30% of their budget, reducing acquisition costs and scaling performance by 4x.
"We could raise our bids and outbid the competition in the important placements while saving our resources on campaigns that contribute less." – Tobias Hagenau, Co-founder and CEO, awork.io
Don’t forget to separate "working media" (direct ad spend) from "non-working media" (creative production and content operations). This distinction helps you understand the true costs of performance refreshes.
With reliable historical data in place, you’re ready to choose a forecasting model that fits your business size and channel mix.
Choosing the Right Forecasting Models
Once you’ve gathered accurate historical data, the next step is selecting the right forecasting model. The quality of your data directly impacts the accuracy of your forecasts.
Marketing Mix Modeling (MMM) is a solid choice if your business runs campaigns across multiple channels. It requires at least two years of weekly data – around 104 observations – to identify meaningful trends. MMM is especially effective for brands using five or more channels simultaneously. If your spend is concentrated on one or two platforms, simpler attribution models may be more suitable.
MMM also stands out in environments with strict privacy rules or limited cookie-based tracking. Since it works at an aggregate channel level, it doesn’t rely on user-level data. For instance, German e-commerce company Deuba combined MMM with multi-touch attribution to eliminate last-click bias in their data. This revealed that social media channels were undervalued by 80%. Incorporating these insights into their Google Ads strategy improved both ROI and cost per acquisition.
"Transitioning from a last-click attribution model to a holistic measurement approach… has given us the power to accurately measure the real ROI of every marketing move." – Mark Prediger, Head of Online Shops and Marketing, Deuba
Before you commit to a forecasting model, back-test it by comparing its predictions against the previous year’s actual results. This step ensures the model’s reliability for future planning. Keep in mind that models require variations in weekly spending to generate meaningful insights – flat budgets often produce inconclusive data. To improve accuracy, develop scenarios that account for factors like seasonality, rising CPC/CPM, and creative fatigue.
With digital channels now consuming 72% of marketing budgets and 64% of CMOs planning to increase digital ad investments through 2025, selecting the right forecasting model has never been more critical.
| Dimension | Attribution Modeling | Marketing Mix Modeling (MMM) |
|---|---|---|
| Granularity | User-level (clicks/views) | Aggregate channel-level |
| Data Requirement | Tracking pixels, cookies | Time-series spend + outcome data |
| Best For | Direct-response, digital channels | Brand-building, offline media, holistic view |
| Time Horizon | Days to weeks | Months to years |
| Privacy Impact | High (requires user tracking) | None (no PII involved) |
Allocating Budgets Across Channels
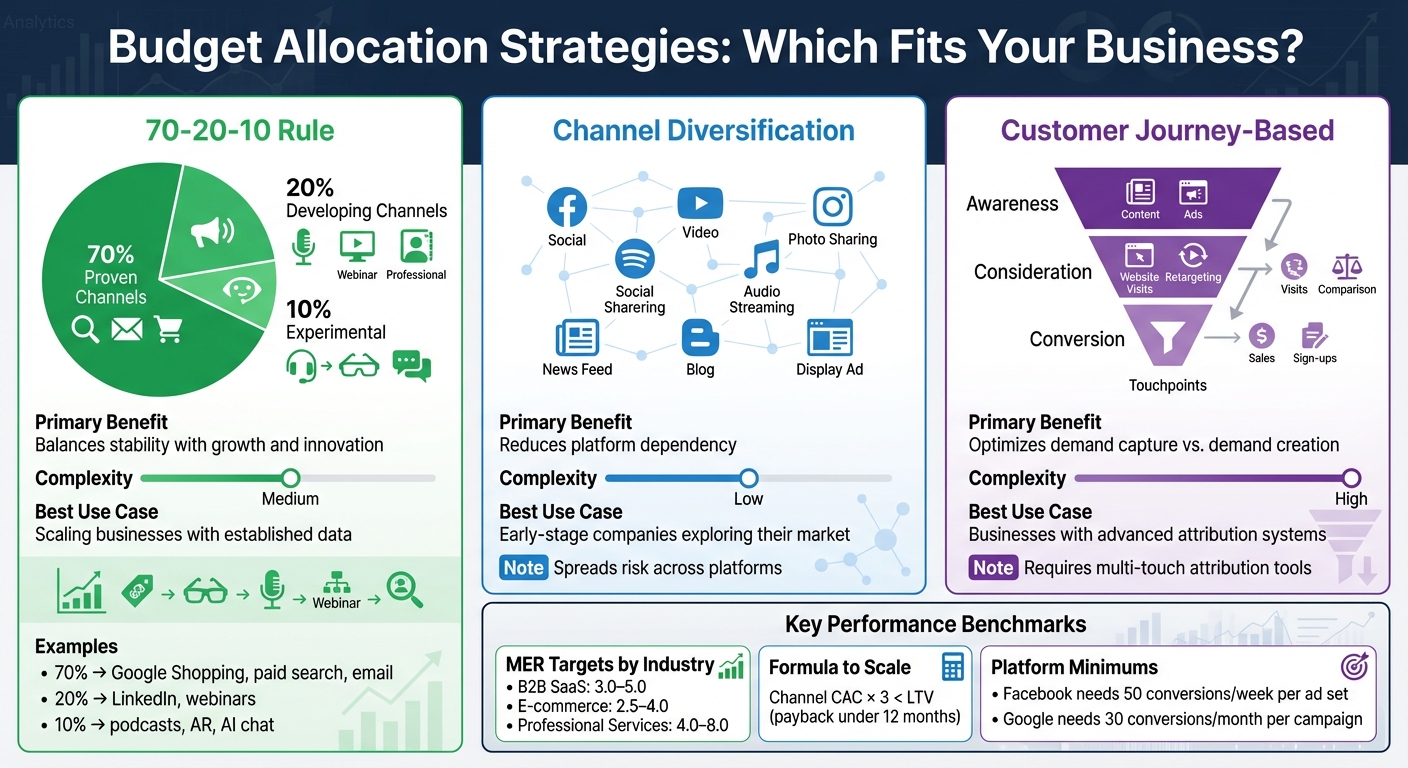
Marketing Budget Allocation Strategies Comparison Chart
Once you’ve nailed down an accurate forecasting model, the next step is figuring out how to allocate your budget effectively. The trick here is striking a balance between what’s already working and leaving room for growth and experimentation. Spreading your budget too thin can backfire – platforms like Facebook need around 50 conversions per ad set per week to exit the learning phase, while Google’s automated bidding requires at least 30 conversions per campaign each month.
"The truth is, how you allocate your budget matters more than how much you spend." – Rodney Warner, Founder & CEO, Connective Web Design
Your budget allocation should align with your business’s current stage and your data-driven forecasts. For smaller budgets (under $10,000/month), it’s wise to concentrate 85–90% of your spend on a single primary channel to ensure algorithms have enough data to optimize. On the other hand, businesses spending over $150,000/month can explore advanced strategies like portfolio management and incrementality testing. Across all budgets, scale any channel where the formula (Channel CAC × 3 < LTV) holds true and the payback period is under 12 months.
Using the 70-20-10 Rule for Budget Allocation
The 70-20-10 rule is a simple yet effective way to distribute budgets. Here’s how it works:
- 70% goes to proven channels that consistently deliver results at predictable costs, such as Google Shopping, paid search, or email marketing.
- 20% is allocated to promising but still-developing channels, like LinkedIn campaigns, webinars for B2B SaaS, or TikTok and influencer partnerships for e-commerce.
- 10% is reserved for experimental initiatives, such as podcasts, augmented reality features, or AI-driven chat marketing.
This approach creates a natural progression for your investments. Channels that perform well in the 10% experimental category can graduate to the 20% tier and eventually join the 70% core. For instance, B2B SaaS companies often allocate 70% of their budget to SEO, paid search, and email; 20% to LinkedIn and webinars; and 10% to experimental options like podcasts.
However, percentages aren’t set in stone. If a channel’s CAC surges or MER drops below target, adjust your budget allocations immediately. Protect your 10% experimental fund even during budget cuts – today’s experiments could become tomorrow’s top performers. Make changes gradually, limiting adjustments to no more than 15% per week to avoid disrupting platform algorithms.
"Diversification is for optimizing performing systems, not escaping underperforming ones." – LeadGen Economy
From here, you can explore other allocation strategies that match your business’s stage and risk tolerance.
Comparing Budget Allocation Strategies
Different strategies suit different business needs. The 70-20-10 rule is straightforward and works well for scaling businesses with solid data. Channel diversification, which spreads risk across platforms, is better for early-stage companies still finding their footing. Meanwhile, customer journey-based mapping focuses on balancing demand capture (e.g., search) with demand creation (e.g., social ads) but requires advanced tools like multi-touch attribution.
| Strategy | Primary Benefit | Complexity | Best Use Case |
|---|---|---|---|
| 70-20-10 Rule | Balances stability with growth and innovation | Medium | Scaling businesses with established data |
| Channel Diversification | Reduces platform dependency | Low | Early-stage companies exploring their market |
| Customer Journey-Based | Optimizes demand capture vs. demand creation | High | Businesses with advanced attribution systems |
To stay on top of things, monitor channel-specific CAC every month and MER every week. Successful companies aim for an MER of 3.0–5.0 for B2B SaaS, 2.5–4.0 for e-commerce, and 4.0–8.0 for professional services. If MER falls below your target, shift funds from underperforming to high-performing channels within a week. Keep in mind, emerging channels may start with CACs that are 50% higher than average; if they exceed a 12-month payback period, it’s time to reassess their role in your strategy.
Using Analytics and Optimization Tools
Allocating your budget is just the starting point; the real challenge lies in tracking performance and fine-tuning your spending in real time. Better ROI comes from directing funds toward channels that work, not just polishing dashboards. Analytics and optimization tools play a key role here, offering a clearer picture for cross-channel budget forecasts. By consolidating data from all platforms into one unified view and using predictive models, you can test scenarios before putting actual money on the line.
Setting Up Data Integration Tools
The first step? Breaking down data silos. Combine cost, conversion, and external data from platforms like CRMs, ERPs, digital campaigns, and even offline sources into a single dashboard for real-time insights. This requires normalizing metrics from platforms such as Facebook, Google Ads, and TV campaigns so they’re directly comparable. Without this integration, you’re flying blind.
A unified measurement framework is essential. It blends Marketing Mix Modeling (MMM) for strategic insights with Multi-Touch Attribution (MTA) to map customer journeys. Here’s how they work:
- MMM uses aggregated data to measure each channel’s sales contribution. It’s ideal for long-term planning and works well with privacy-focused environments.
- MTA focuses on individual user paths, assigning credit to various touchpoints. This is critical for making real-time decisions in digital-heavy campaigns.
Interestingly, 56% of marketers use AI or machine learning to optimize media mix and budget allocation. AI-powered MMM platforms are particularly useful for understanding channel interactions. They provide response curves that illustrate outcomes at different spend levels, helping you identify when a channel has reached saturation. If a channel isn’t delivering, these tools can signal you to redirect the budget to more effective avenues.
With a unified view of your data, you’re better equipped to make quick, informed adjustments to your campaigns.
Adjusting Budgets Through Regular Rebalancing
Once your data is integrated, set a schedule for rebalancing your budget. High-level models should be updated monthly or quarterly, while tactical adjustments – like tweaking PPC budgets by ±20% – can happen weekly based on real-time performance. Monitoring your spend continuously allows you to spot and address performance dips early. Running "what-if" simulations can also help when results deviate from expectations.
These "what-if" simulations let you test different investment levels (e.g., 10%, 15%, or 20% of revenue targets) to predict outcomes and weigh risks before making changes. This approach refines your forecasts by factoring in external influences like economic trends, competitor moves, and seasonal shifts. It also helps distinguish marketing-driven conversions from those that might have happened organically. Tools like incrementality and lift testing further enhance your models by accounting for time-lag effects and ensuring your efforts contribute to both short-term gains and long-term growth.
Conclusion and Key Takeaways
Starting with SMART goals and mapping the customer journey, cross-channel budget forecasting uses data to allocate funds where they’ll perform best. This approach builds on analyzing past performance and choosing the right forecasting models. Frameworks like the 70-20-10 rule strike a balance between reliable channels and new opportunities, while ongoing monitoring ensures spending stays aligned with real-world results.
This process doesn’t just deliver better outcomes – it also makes it easier to justify budgets in a challenging financial environment. With marketing making up 11.4% of company expenses and executives 44.6% more likely to cut marketing budgets when profits dip, data-driven strategies shift marketing from being seen as a cost to being recognized as a growth driver. Centralizing your data helps uncover relationships between channels and avoids over-investing by identifying diminishing returns early. Predictive models also help pinpoint when a channel reaches its saturation point, allowing you to reallocate funds for maximum ROI and reduce waste.
To build on these foundations, focus on measuring incremental ROI and causal lift instead of relying on surface-level metrics like clicks or conversions. Keep in mind that brand-building efforts often have delayed impacts, so account for time lags in your analysis to ensure long-term growth initiatives aren’t underfunded due to short-term biases.
Growth-onomics offers expertise in implementing these strategies using advanced Marketing Mix Modeling and predictive analytics. Their tools provide real-time scenario planning, allowing you to simulate budget adjustments and determine the most profitable allocation in minutes. By refining strategies at every stage – from initial goal setting to dynamic rebalancing – Growth-onomics turns complex budgeting into a competitive advantage.
FAQs
What’s the easiest way to start cross-channel forecasting with limited data?
When you have limited data, the simplest way to begin cross-channel forecasting is by leveraging proxy data, category benchmarks, and elasticity patterns from comparable markets. These elements can help you predict how shifts in spending, timing, or channel mix might affect conversions, revenue, or profit margins.
On top of that, scenario-based planning and tools that incorporate proxy inputs make forecasting more accessible. This approach allows businesses with minimal historical data to experiment with new channels or markets effectively.
How do I decide between MMM and multi-touch attribution for my business?
Choosing between Marketing Mix Modeling (MMM) and multi-touch attribution (MTA) depends largely on your objectives, the data you have, and the complexity of your customer journey.
MMM takes a high-level approach, analyzing how various channels – including offline factors like TV ads or in-store promotions – impact overall sales. This makes it particularly useful for strategic planning and understanding the broader picture of your marketing efforts.
On the other hand, MTA focuses on the granular details of digital touchpoints, helping you pinpoint which online interactions are driving conversions. This is perfect for optimizing specific campaigns and fine-tuning digital strategies.
Many businesses find value in combining both approaches. Using MMM for a wide-angle view and MTA for precise digital insights creates a balance between detailed attribution and a comprehensive understanding of your marketing performance.
How often should I rebalance budgets without hurting ad platform learning?
To get the best results, it’s smart to rebalance budgets on a regular basis. However, avoid making frequent, minor tweaks, as this can disrupt the ad platform’s learning phase. A good rule of thumb is to adjust your budgets every 1–2 weeks. During this time, keep a close eye on key metrics like ROAS (Return on Ad Spend), CAC (Customer Acquisition Cost), and conversion rates. This approach helps you stay responsive while allowing the platform to optimize effectively, leading to stronger performance over time.