How do you measure if your content is actually good? Pageviews and shares are helpful but don’t reveal if your content is driving leads, building trust, or boosting revenue. A content quality score solves this by assigning a numerical value (e.g., 78/100) based on specific criteria. Here’s a quick breakdown of the 10 metrics you need:
- Engagement Depth: Tracks scroll depth, time on page, and interactions to see if users are truly engaging.
- Organic Discovery Quality: Measures how well your content ranks for the right audience and search intent.
- Conversion Impact: Focuses on how effectively your content drives actions like signups or purchases.
- Relevance and Intent Match: Evaluates if your content aligns with the user’s search intent.
- Readability and Comprehension: Ensures your content is easy to read and understand.
- Brand and Authority Alignment: Checks if your content reflects your brand voice and expertise.
- User Feedback Quality: Analyzes direct audience reactions like comments, shares, and saves.
- Content Freshness and Accuracy: Assesses how up-to-date and reliable your content is.
- Structural Quality and UX: Looks at how well your content is organized and easy to navigate.
- Distribution and Channel Fit: Measures how effectively your content performs on the platforms you share it on.
Why it matters: Without a scoring system, you risk wasting resources on content that doesn’t deliver results. Use these metrics to evaluate, improve, and prioritize your content for better performance. Start by aiming for a score of at least 75/100 before publishing.
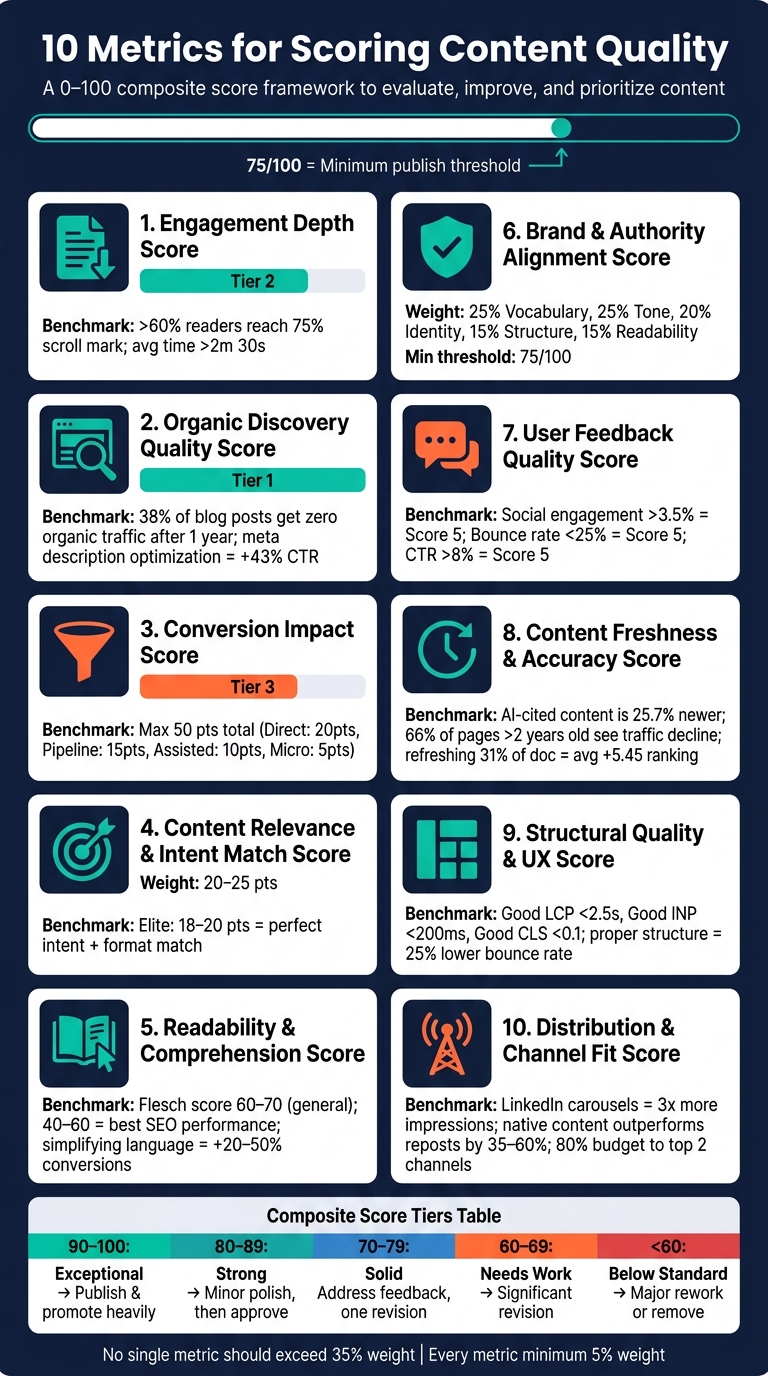
10 Content Quality Metrics: Scoring Framework & Benchmarks
KEY CONTENT QUALITY METRICS Your Writers Should Be Tracking
sbb-itb-2ec70df
How To Use A Content Quality Scoring Framework
A content quality score, measured on a 0–100 scale, provides a snapshot of how well your content performs across several criteria. It blends qualitative factors like brand voice, readability, and accuracy with quantitative data such as organic traffic, scroll depth, and conversions. This combined metric simplifies decision-making by showing how qualitative insights align with measurable results.
The key to an effective score lies in weighting metrics based on your primary goals. For example:
- If lead generation is your focus, give more weight to CTA and conversion metrics.
- If SEO is your priority, emphasize keyword rankings and organic traffic.
Here’s an example of a 100-point scoring model:
- Intent match: 25 points
- Engagement depth: 20 points
- Accuracy: 20 points
- Readability: 15 points
- CTA effectiveness: 10 points
- Technical SEO: 10 points
"Weights reflect priority. The criterion that matters most for content effectiveness should have the highest weight." – TeamBench
Three Core Tiers of Measurement
To calculate scores effectively, you’ll need reliable data organized into three main tiers:
| Tier | What It Measures | Primary Sources |
|---|---|---|
| Reach | Is the content being found? | Google Search Console, rank trackers |
| Engagement | Is it holding attention? | GA4 (scroll depth, average engagement time) |
| Conversion | Is it generating business? | CRM (HubSpot, Salesforce), GA4 events |
Practical Tips for Using the Framework
- Set a baseline: Aim for a minimum quality score of 75/100 before publishing any content. This ensures your content meets a strong standard right from the start.
- Reassess regularly: For high-value pages, re-score every 90 days. Content performance can decline over time, so regular checks help you spot and address potential issues.
Teams at Growth-onomics use this structured approach to integrate SEO analysis, data analytics, and performance marketing insights. This framework not only measures content quality but also helps guide decisions on whether to create, update, or remove content. Up next, we’ll dive deeper into the individual metrics behind this scoring system.
1. Engagement Depth Score
Pageviews tell you who stops by, but engagement depth reveals who sticks around. This metric blends key behavioral signals – scroll depth, active time on the page, and on-page interactions – into one score that shows whether users are truly engaging with your content or just skimming.
Here’s the reality: the global average time spent on publisher sites is a mere 26 seconds, and the median read depth for 343,000 articles is only 44%. In other words, most content gets skimmed, not fully read. That’s why engagement depth falls into Tier 2 of a content scoring framework, answering the critical question: "Is this content holding attention?"
This metric is a spotlight for diagnosing content issues. For instance, if your content has strong reach but low engagement, your headline might be pulling readers in, but the content itself isn’t delivering. On the flip side, high engagement paired with poor conversions often points to problems with your call-to-action (CTA) placement or messaging. Generally, blog posts with engagement times over 2 minutes and 30 seconds tend to lead to higher downstream conversions. Similarly, content is considered a strong performer when over 60% of readers reach the 75% scroll mark.
"The longer a visitor spends on your website, the more valuable they find your content. The more valuable they find your content, the more likely they are to engage with conversion text and calls to action." – Patrick, CEO, CopyDash
To track engagement depth, use GA4 with Google Tag Manager scroll triggers set at 25%, 50%, 75%, and 100%. But don’t stop at scrolling – also monitor interactions like internal link clicks, downloads, and text copying. Interestingly, text copying is a strong indicator of pre-click intent. Use scroll depth data strategically: place CTAs above the spot where most users stop scrolling, and refresh any article losing more than 20% of its traffic month-over-month.
Here’s a quick breakdown of how to evaluate engagement depth:
| Metric | Low Score | Medium Score | High Score |
|---|---|---|---|
| Time on Page | <20 sec | 40–60 sec | >120 sec |
| Bounce Rate | >75% | 35–65% | <25% |
| Scroll Depth | <25% | 50% | >75% |
Source: Adapted from Content Marketing Institute benchmarks and The Seo Engine.
Engagement depth is an essential piece of the overall content quality puzzle. It helps identify what’s working and what needs fixing. Up next, we’ll dive into the metrics that measure how well your content performs in organic search.
2. Organic Discovery Quality Score
Getting lots of traffic is great, but it only matters if the audience is the right fit. The Organic Discovery Quality Score helps measure how well your content attracts visitors who align with your target audience through search. It’s not just about ranking high on Google; it’s about ranking for the right search queries, in the right format, for the right people. This approach focuses on intent, which is key to measuring effective organic discovery.
This metric connects the basics of SEO with broader business objectives. For example, content quality accounts for 25% of Google’s ranking factors and scores as high as 9.5 out of 10 – the highest among individual ranking factors. Despite this, 38% of blog posts fail to generate any organic traffic after a year. That gap between creating content and driving results is exactly what this score helps address. It complements other SEO metrics by ensuring your content not only ranks but also reaches the audience it’s meant for.
At the heart of this score is intent match – how well your content’s format and depth meet what searchers are actually looking for. Before you start writing, analyze the top 10 results on Google for your target query. If the search results are dominated by listicles but you publish a long-form essay, that mismatch could hurt your rankings, no matter how well-written your piece is. Beyond format, topical coverage is also crucial. Covering related sub-questions can boost your content score from 70 to 85. These factors together create a strong measure of how relevant your content is to searchers.
"The content sub-score is the biggest lever in the SEO + GEO AI Search Score because it weighs 20% of the global number and is the only dimension fully under your control." – Juliette, SEO Expert, Bloomwise
To track this score, segment your average position and click-through rate (CTR) by individual page and query type. This reveals performance gaps. Focus on improving pages that rank in positions 6–15 – small ranking gains in this "striking distance" range can lead to the biggest traffic boosts. A simple yet effective fix: optimized meta descriptions can lead to a 43% increase in CTR. Also, adding a "last updated" timestamp can signal freshness, as outdated content can reduce AI engine citations by up to 40%. By following these steps, you can maintain a high organic discovery score and continuously improve your content’s performance.
| Score Range | Content Status | Recommended Action |
|---|---|---|
| 80–100 | High quality | Monitor for freshness; no immediate action needed |
| 60–79 | Moderate quality | Plan updates to improve depth or sourcing |
| 40–59 | Low quality | Rewrite or combine with stronger content |
| Below 40 | Very low quality | Consider removing or noindexing |
3. Conversion Impact Score
Engagement is great, but it doesn’t always translate into business results. That’s where the Conversion Impact Score comes in. This metric focuses on how effectively your content drives actions like demo requests, purchases, or signups – actions that directly contribute to revenue. It answers the big question every leader wants to know: Is this content making us money?
"In 2026, the right question isn’t ‘How did this perform?’ but ‘What business outcome did this influence?’" – Lauren Henss, Vice President of Marketing, First Team Real Estate
A strong Conversion Impact Score evaluates multiple factors, including direct conversions (final touchpoints), assisted conversions (earlier interactions), micro-conversions (like newsletter signups), and overall pipeline influence. Relying only on last-click attribution can undervalue top-of-funnel content. That’s why position-based or data-driven attribution models provide a more balanced view. For B2B marketers, tracking the content-influenced pipeline – sales opportunities tied to content engagement – can reveal how content impacts the bigger picture.
Here’s a breakdown of how the scoring works:
| Conversion Scoring Component | Max Points | Criteria |
|---|---|---|
| Direct Conversion | 20 pts | Last-touch demo request or purchase |
| Assisted Conversion | 10 pts | Content that appeared in a successful conversion path |
| Micro-Conversion | 5 pts | Newsletter signup or guide download |
| Pipeline Influence | 15 pts | Content engaged by an account that became an opportunity |
To track this effectively, integrate GA4 with your CRM (like HubSpot or Salesforce). By passing the GA4 Client ID and content path through hidden form fields into your CRM, you can map out the full content journey for every converted lead. Setting a 90-day lookback window in GA4 is also key – this accounts for the longer decision-making cycles typical in B2B. If a page shows zero direct or assisted conversions over six months, it’s time to reassess its call-to-action (CTA), internal links, or how well it aligns with user intent.
Want to boost conversions? Test your CTA placement. Mid-article CTAs often work better than those buried at the bottom, especially on high-engagement pages. Also, placing your key message or CTA within the first 100 words can increase conversions. It even helps AI tools surface your content to users with high purchase intent.
4. Content Relevance And Intent Match Score
Getting traffic is great, but attracting targeted traffic is the real goal. The Content Relevance and Intent Match Score evaluates how well your content addresses the reason a user clicked in the first place. This isn’t just about sprinkling in the right keywords – it’s about understanding and meeting the intention behind the search.
Search intent generally falls into three categories:
- Informational: The user is looking to learn something.
- Commercial: The user is comparing options or researching.
- Transactional: The user is ready to take action.
If your content ranks well but doesn’t align with the dominant intent, it can generate traffic but fail to deliver meaningful results. Daniel Mercer, Senior SEO Content Strategist, explains it perfectly:
"A page can be fully human-written and still fail, while a thoughtfully edited AI-assisted page can perform well if it solves intent better than competing pages."
A clear sign of intent mismatch is high traffic paired with poor conversions. For example, a blog post pulling in 10,000 visits a month but generating zero leads isn’t a win – it’s a drain on resources. Tools like Google Search Console can help identify this issue by showing you the queries driving traffic. Often, these queries don’t align with your original keyword targets, highlighting a gap in relevance.
To evaluate this metric, assign 20–25 points to intent alignment within your overall content quality scoring system. The table below breaks down how to award those points:
| Intent Match Score (0–20 pts) | Criteria |
|---|---|
| 18–20 (Elite) | Perfectly matches both primary and secondary intent; format aligns with SERP expectations |
| 12–17 (Adequate) | Covers the primary intent but leaves some related questions unanswered |
| 0–11 (Failing) | Misaligned format or fails to address the user’s actual need |
Another critical factor is time to insight – how quickly users find the information they’re looking for. Pages that bury answers under layers of unnecessary content often lead to "pogo-sticking", where users bounce back to the search results almost immediately.
Content scoring below 70 out of 100 overall should be flagged for improvement or consolidation. On the other hand, pages scoring 85 or higher are excellent candidates for paid promotion. To maximize impact, prioritize quarterly audits on your top 20 traffic-driving pages, as improvements here can yield the most immediate benefits.
This focus on intent alignment naturally feeds into broader discussions of key metrics for content performance.
5. Readability And Comprehension Score
Did you know most users only skim through web pages, reading about 28% of the content? If your content is packed with jargon or poorly organized, readers are likely to leave before they even get to the important stuff. That’s where the Readability and Comprehension Score comes into play – it measures how easy your content is to read and understand, which can directly influence your business performance.
What Does the Score Measure?
Readability focuses on the complexity of the language you use, while comprehension ensures your message comes across clearly. A page might check all the readability boxes but still confuse readers if the logic or structure is unclear. Both aspects are critical to delivering quality content.
Here’s the kicker: simplifying your language and improving the layout can increase conversion rates by 20–50%. One case showed that rewriting dense B2B product pages doubled user memory retention from 33% to 65%. These aren’t just minor tweaks – they’re powerful ways to make your content more effective.
How to Measure Readability
Readability is typically assessed using automated tools. Instead of relying on just one formula, it’s better to average results from multiple indexes like Flesch-Kincaid, Gunning Fog, and SMOG. For general audiences, aim for a Flesch Reading Ease score between 60–70. If you’re writing for specialized B2B or technical audiences, a score between 30–50 works better. Interestingly, research analyzing 32,110 data points found that pages with mid-range Flesch scores of 40–60 performed best in search rankings.
"Users won’t read web content unless the text is clear, the words and sentences are simple, and the information is easy to understand." – Jakob Nielsen, Principal, NN/G
Tips for Better Readability
- Keep sentences under 20 words.
- Limit paragraphs to 2–4 sentences.
- Use descriptive headings and bulleted lists to make content easier to scan.
6. Brand And Authority Alignment Score
Readability might capture attention, but building trust requires aligning content with your brand and authority. The Brand and Authority Alignment Score evaluates how well your content reflects your organization’s voice and expertise.
Consistent branding is a big deal – companies that do it across all platforms can see revenue jump by up to 33%. Yet, here’s the catch: while 95% of organizations have brand voice guidelines, only 25–30% actively enforce them. This gap often leads to brand voice drift, where content gradually strays from established guidelines. Causes? Team turnover, scaling challenges, or even switching AI tools.
What Does the Score Measure?
The Brand Voice Consistency Score (BVCS) is a weighted average that evaluates alignment across five key dimensions:
| Dimension | Suggested Weight | Rationale |
|---|---|---|
| Vocabulary Compliance | 25% | The easiest to automate and measure objectively |
| Tone Alignment | 25% | Strongly influences how readers perceive content |
| Identity Compliance | 20% | Answers the key question: "Does this sound like us?" |
| Structural Patterns | 15% | Relevant but less noticeable to readers |
| Readability Consistency | 15% | Helps catch drift before readers do |
One standout metric is Identity Compliance, also known as the Byline Test. Here’s how it works: strip all branding from a piece of content and ask a small group familiar with your organization to identify the author. If fewer than 60% can correctly identify it, your content lacks a distinct voice.
Authority Signals Matter More Than Ever
Brand voice is one thing, but authority takes it to another level. Search engines increasingly rely on E-E-A-T signals – like verified author credentials, original data or firsthand experiences, and high-quality citations. Google’s John Mueller put it bluntly:
"Sometimes SEOs come to us or like mention that they’ve added E-E-A-T to their web pages. That’s not how it works. Sorry, you can’t sprinkle some experiences on your web pages." – John Mueller, Senior Search Analyst, Google
Beyond E-E-A-T, the technical side of authority is gaining importance too. Entity salience – scored from 0 to 1 using NLP APIs – measures how well AI systems associate your content with your brand. A score above 0.5 indicates that your brand is clearly recognized as an entity, increasing the chances of being cited as a credible source. As SEO researcher Pushkar Sinha explains:
"AI engines cite the brands they can map to a clear entity. They do not cite the densest keyword pages on the web." – Pushkar Sinha, Head of SEO Research, VisibilityStack
This focus on authority strengthens trust while complementing other scoring metrics.
How to Track and Improve It
Set a minimum BVCS benchmark – say, 75 out of 100 – for content to meet before it gets published. Content falling short of this threshold? Revise it. Keep tabs on your Content Compliance Rate (the percentage of first drafts meeting the threshold) each month. If you notice a decline, it could be a sign of consistency issues. Also, refresh your brand voice guidelines every 90 days to ensure they align with your evolving market position.
This score lays the groundwork for evaluating how users respond to your content next.
7. User Feedback Quality Score
While other metrics focus on engagement and conversion, the User Feedback Quality Score digs into how readers genuinely feel about your content. This score measures direct audience reactions – like comments, ratings, shares, and saves – and distills their feedback into a clear indicator of how well your content resonates. It works hand-in-hand with other metrics, adding the audience’s voice to the mix.
Not all feedback is created equal. Generic praise might feel good, but it doesn’t offer much to work with. Instead, detailed comments provide deeper insights. Similarly, saves and bookmarks show that readers find your content useful enough to revisit, while shares highlight "redistribution value" – proof your content is helpful and worth recommending.
Pay attention to "silent data", too. Subtle behaviors like scroll abandonment or hover patterns can reveal friction points that explicit feedback might miss. These hidden signals often tell you where your content is falling short.
"Don’t just focus on the obvious metrics like clicks or open rates, but also on the data that isn’t making noise." – Jake Ward, Founder, Kleo
Fitting It Into Your Scoring Framework
This score builds on behavioral metrics by quantifying direct audience feedback. Below is an example of how to apply a 1–5 scale to key metrics:
| Metric | Score: 1 | Score: 3 | Score: 5 |
|---|---|---|---|
| Social Media Engagement | <0.5% | 1.5–2.5% | >3.5% |
| Bounce Rate | >75% | 35–65% | <25% |
| Click-Through Rate | <2% | 4–6% | >8% |
Source: Content Marketing Institute
Set a minimum quality threshold – for instance, a score of 70 out of 100 – that content must meet before moving forward in your workflow. If content consistently falls short, it signals a disconnect between what you’re creating and what your audience wants. Regularly review these scores to spot trends and address gaps, rather than overreacting to occasional dips.
8. Content Freshness And Accuracy Score
The Content Freshness And Accuracy Score measures how up-to-date and factually reliable your content is. This score plays a key role in search rankings and AI-generated citations.
Why does this matter? Studies show that AI-cited content tends to be 25.7% newer than standard organic search results. On top of that, 70% of AI Overview citations drop off within 2–3 months. And if that’s not enough, 66% of pages older than two years see a decline in organic traffic. This phenomenon, often referred to as content decay, can quietly undermine your ROI over time.
"Content decay is the natural loss of relevancy experienced by nearly all well-performing posts. Left unchecked, it quietly erodes the ROI of every article you have ever published." – Jimmy Daly, Founder/CEO, Animalz
Different types of content decay at different rates. For example, technology tutorials can lose 30–40% of their value annually, while evergreen how-to guides might only drop 5–10% per year. Understanding this variation is essential for deciding which content to update and when. Keeping your content fresh and accurate not only boosts rankings but also strengthens the engagement and conversion metrics you’ve already worked hard to build.
Fitting It Into Your Scoring Framework
To evaluate freshness, break it down into five components:
- Temporal currency: How old is the content?
- Statistical currency: How recent are the data sources?
- Contextual currency: Does it align with current events, tools, or trends?
- Structural currency: Does it follow modern formatting and schema best practices?
- Engagement currency: What’s the current traffic and link health?
Content with statistics older than 18 months should be flagged for updates. Refreshing at least 31% of a document can lead to an average improvement of +5.45 positions in search rankings.
To spot content decay, use Google Search Console. Compare performance from the last three months with the previous three months. Focus on pages with a traffic drop of 30% or more. Implement a tiered review schedule to make updates manageable:
- Review revenue-generating pages every 90 days.
- Update competitive informational content every six months.
- Refresh evergreen reference material annually.
9. Structural Quality And UX Score
The Structural Quality And UX Score measures how effectively your content is organized, formatted, and easy to navigate – for both human readers and AI systems. A strong structure doesn’t just improve readability; it also boosts retention, rankings, and the likelihood of being cited.
Content structure plays a significant role in search engine rankings, accounting for about 25% of Google’s ranking factors. Well-organized pages with a proper heading hierarchy (H2–H4) experience 25% lower bounce rates and 15% longer average time-on-page compared to poorly structured content. Additionally, improving Core Web Vitals can lead to a ranking increase of up to three positions. These improvements aren’t minor – they can create a ripple effect across all your content.
"Structure determines whether AI can parse meaning efficiently." – Pratik Thakker, CEO, INSIDEA
High-quality structure prioritizes scannability. Even a reader who only skims your page should quickly grasp the key points. To achieve this, use a clear H1, logical H2/H3 subheadings, short paragraphs, and visual elements every 300–400 words. Including a direct answer or TL;DR section within the first 150 words signals both readers and AI that your content delivers immediate value. When paired with strong engagement and readability, a solid structure amplifies your content’s overall impact.
Fitting It Into Your Scoring Framework
Structural clarity is often weighted at 10% in human content evaluation rubrics, but its influence extends to nearly every metric, from scroll depth to AI citation rates. For well-structured content, aim for a scroll depth benchmark of 60%. Beyond text, technical performance also plays a critical role in structural quality.
| Core Web Vital | "Good" Threshold | "Needs Improvement" | "Poor" |
|---|---|---|---|
| LCP (Loading) | < 2.5s | 2.5s – 4.0s | > 4.0s |
| INP (Interactivity) | < 200ms | 200ms – 500ms | > 500ms |
| CLS (Visual Stability) | < 0.1 | 0.1 – 0.25 | > 0.25 |
To improve and monitor your score, try the "30-second scan" test: if a mobile user can’t understand the main points within 30 seconds, revisit your structure. Tools like Microsoft Clarity can help you track scroll depth and heatmaps, while Screaming Frog is great for auditing heading hierarchies. Reassess your top-performing pages every quarter, and ensure schema markup is correctly implemented for better AI readability.
A strong structural foundation doesn’t just make content easier to use – it also enhances the performance of nearly every other quality metric.
10. Distribution And Channel Fit Score
The Distribution And Channel Fit Score evaluates how effectively your content performs on the platforms where it’s shared – and whether those platforms connect with your target audience and customer journey. Even the best content won’t succeed if it’s placed on the wrong channel.
Interestingly, many teams devote 90% of their effort to content creation and only 10% to distribution. A more balanced 50/50 approach is ideal. Considering that B2B buyers typically engage with over 10 pieces of content before making a purchase, reaching them consistently on the right channels is just as important as producing high-quality content.
"Distribution is to content marketing what shipping is to manufacturing: a critical step inside a larger workflow." – Ross Simmonds, Founder, Distribution.ai
Channel fit depends on six key factors: Audience Presence (are your target customers active there?), Content Format Fit (does the channel align with your content type?), Compounding Potential (does the content stay discoverable over time?), Measurability (can you track leads from this channel?), Cost to Test, and Competitive Density. Native formats often perform better – for example, LinkedIn carousels generate three times more impressions than posts with external links, and native content generally outperforms reposts by 35% to 60%. These factors serve as the foundation for determining your channel fit score within your broader content strategy.
Integrating Channel Fit into Your Score
A structured scoring framework is key to evaluating channel fit. Rate each platform based on the six criteria to ensure resources aren’t spread too thin. A common rule of thumb is to allocate 80% of your budget and time to your top two channels, 15% to a third, and no more than 5% to others. Before fully committing to a new channel, run a 30-day high-volume test to assess engagement and lead quality.
To make this metric actionable, combine your scoring framework with strong tracking systems. Use UTM parameters to link every distribution effort back to your CRM for clear insights into pipeline and revenue. Establish a Distribution SLA (Service Level Agreement) to ensure all content is shared on primary channels within 72 hours of publication. To stay ahead of changes, rescore your channels every three to six months, as algorithms, audience behaviors, and business goals evolve.
"Channel discipline, not content volume, is what separates teams that generate pipeline from those that generate noise." – Sofia Fairfax, Channel Marketing Expert, Channel Curated
Building A Composite Content Quality Score
To evaluate overall content quality effectively, you can combine ten individual metrics into a composite content quality score. This score is calculated by standardizing each metric onto a 0–100 scale, applying its assigned weight, and then summing the results.
Why a 0–100 scale? It offers more precise distinctions than a 1–5 scale. For example, a score of 72 ("decent but needs polish") is clearly different from an 84 ("almost ready to publish"). A narrower scale often blurs these nuances. For qualitative criteria like brand voice or accuracy, you can use a simple Yes/No checklist: tally the "Yes" answers, divide by the total number of questions, and convert the ratio into the 0–100 range.
Weights should reflect the priorities of the content type. For example, a B2B blog post might prioritize brand voice and readability, assigning them a combined weight of 50%, while SEO and accuracy might account for 35–40%. On the other hand, a product page would focus more on feature accuracy and conversion. To maintain balance, no single metric should exceed 35% of the total weight, and every metric should have at least a 5% weight to ensure its influence remains meaningful.
Once weighted metrics are in place, you can categorize content performance into tiers:
| Score Range | Performance Tier | Recommended Action |
|---|---|---|
| 90–100 | Exceptional | Publish as-is; promote heavily |
| 80–89 | Strong | Minor polish, then approve |
| 70–79 | Solid | Address specific feedback; one revision cycle |
| 60–69 | Needs Work | Significant revision or structural rewrite |
| <60 | Below Standard | Major rework, merge, or remove |
Setting minimum thresholds helps establish clear quality standards. For instance, blogs might require a score of 75/100, while compliance content may need 85/100 to pass. This approach removes subjectivity and ensures consistency. To further enhance reliability, have two reviewers independently score the same content. If their scores vary widely, it’s a sign that the evaluation criteria need more clarity.
Growth-onomics has demonstrated how a data-driven content strategy can simplify decision-making. By using clear metrics, content managers can quickly decide whether to keep, update, merge, or remove a piece. As Hardik Shah, Founder of ScaleGrowth.Digital, explains:
"The audit table is your decision engine. When a content manager can look up any page, see six numbers, and know exactly what to do next, you have eliminated the biggest bottleneck in content operations: the debate over what matters."
This structured, metrics-based approach transforms subjective debates into actionable steps, streamlining content operations and improving decision-making.
Conclusion
A content scoring framework eliminates uncertainty by providing your team with a unified, actionable system. This consistency leads to tangible benefits – 93% of marketers who maintain a single source of truth for data report it helps their organization, yet only 65% have implemented one.
The ten metrics outlined earlier offer a thorough view of your content’s performance. They go beyond intuition, uncovering patterns that help your team make informed decisions. By aligning your team around these metrics, your content strategy becomes easier to measure and scale.
Data-driven insights simplify everyday tasks. When writers, editors, and strategists work from the same criteria, quality reviews are quicker, revision cycles are shorter, and publishing decisions are easier to justify.
"A blog post generating 10,000 monthly visits and zero leads isn’t an asset – it’s an expense. The only content marketing metrics that matter are the ones that change what you publish next or how you spend money." – The SEO Engine Editorial Team
Start by focusing on your top five metrics to bring clarity and direction to your content strategy. Let these priorities shape your next steps.
FAQs
How do I pick weights for each metric?
When setting weights for your content metrics, it’s all about aligning them with your business goals. Start by asking yourself: Which metric, if improved, would make the biggest difference? That metric should get the highest weight.
Stick to using 4–6 metrics in total, and make sure the weights add up to 100%. For example, if lead generation is your top priority, give more weight to conversion rates rather than brand reach. And remember, every metric you include should hold significance – avoid assigning less than 5% to any one metric.
What tools do I need to track these scores?
To measure how your content is performing, combine analytics and optimization tools to gather both numbers and insights. Here are some tools to consider:
- Google Analytics 4: Great for tracking traffic and user behavior.
- Google Search Console: Helps you monitor your content’s visibility in search results.
- SurferSEO or Semrush: Useful for content optimization and keyword analysis.
- Hemingway App: A handy tool to check and improve your content’s readability.
- Social Analytics Tools: Platforms like Later or SharedCount can help you measure social media engagement.
- ChatGPT: Can assist with automated content analysis and suggestions.
By using these tools, you can get a clear picture of how your content performs and where it might need improvement.
How often should I rescore my content?
Content scoring isn’t a one-and-done task – it should be woven into your content planning process. Make it a habit to revisit and tweak your scoring framework regularly to keep up with changing goals and strategies. You don’t have to tackle everything at once, but aim for consistent reviews. Many teams choose to dive deeper during year-end evaluations. According to Growth-onomics, content scoring works best as an ongoing effort that adapts alongside your marketing strategy.