

Want to outperform your competitors online? Start by analyzing their traffic by device. Here’s why it matters:
- Mobile dominates: As of January 2026, mobile accounts for 66.42% of global web traffic, while desktop trails at 32.16%, and tablets barely register at 1.42%.
- Behavior varies by device: Mobile users focus on speed and simplicity, browsing fewer pages. Desktop users spend 37.7% more time on sites, diving deeper into content.
- Key metrics to track: Bounce rates, session duration, and conversion rates reveal gaps in competitors’ strategies. For instance, mobile bounce rates above 59% often signal poor user experience.
Actionable insights:
- Spot weak mobile experiences in competitors’ sites and improve yours.
- Use tools like Semrush, Similarweb, or Ahrefs to track device-specific trends.
- Optimize for mobile-first indexing and cross-device continuity to capture more conversions.
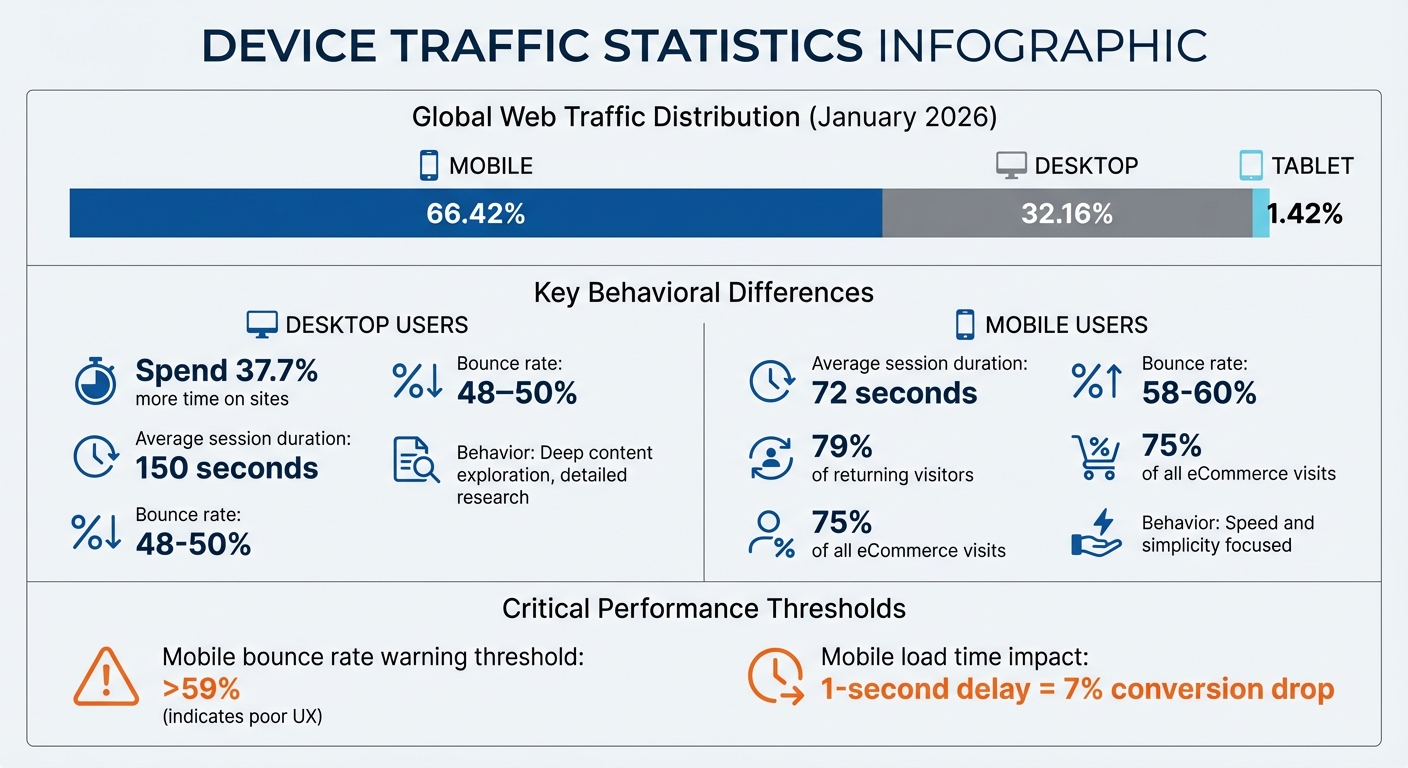
Global Web Traffic Distribution by Device 2026: Mobile vs Desktop vs Tablet Statistics
Research your Competitor’s Traffic & Engagement Performance
sbb-itb-2ec70df
Key Metrics for Device-Specific Competitor Traffic Analysis
Understanding these metrics can help you pinpoint how competitors are leveraging different devices, offering insights to refine your own strategies.
Traffic Volume by Device
Traffic volume highlights which platforms competitors perform best on. For example, mobile traffic accounts for 75% of all eCommerce visits, often indicating a strong social media presence or a focus on users who browse while on the move. Meanwhile, desktop traffic, at around 23%, tends to reflect an emphasis on professional users or those conducting in-depth product research.
Digging deeper, traffic patterns across specific site sections can reveal even more. If a competitor’s /blog subdomain attracts significant mobile traffic but their /shop section sees higher desktop usage, it suggests they’re using mobile content for awareness and relying on desktop for conversions. Spikes in device-specific traffic can also point to successful campaigns – like a surge in mobile visits following Instagram ad launches.
When mobile traffic is high but conversions are low, it’s a clear sign of potential issues like checkout friction. In the U.S., shoppers often switch between devices during the buying process, offering clues about where the experience might be falling short. Pair this with engagement metrics like bounce rates and session duration to get a fuller picture.
Bounce Rate and Session Duration
Bounce rates and session times reveal how well competitors engage their visitors. Mobile bounce rates typically range from 58% to 60%, compared to 48% to 50% on desktop. This gap reflects different user behaviors – mobile users are often multitasking or looking for quick answers, with an average session lasting 72 seconds. Desktop users, on the other hand, spend more time exploring, averaging 150 seconds per session.
These metrics can spotlight areas for improvement. For instance, mobile bounce rates exceeding 60% often indicate issues like slow load times, intrusive pop-ups, or poorly designed touch navigation. A great example of addressing this comes from The Washington Post, which introduced a mobile-friendly "morning briefing" format and a "save for later" feature for cross-device reading. This effort boosted mobile engagement time by 47% and cross-device weekly active users by 52%.
"Mobile users engage differently, making rapid micro-decisions about content worth." – Sarah Johnson, Content Strategist
Conversion Rates by Device
Conversion metrics build on engagement data to identify where checkout processes need work. Desktop users tend to convert more frequently on high-ticket items – those over $100 – because they prefer detailed research and comparison shopping. Meanwhile, mobile users, who make up 79% of returning visitors, lean toward smaller, routine purchases where convenience is key.
Sephora tackled cross-device challenges by noticing that mobile researchers often abandoned carts on desktop. They introduced persistent carts and an "Email to Myself" feature, which led to a 28% increase in cross-device conversions and a 17% drop in cart abandonment. This example shows how tracking device-specific conversion rates can help identify friction points and improve the customer journey.
If a competitor’s mobile traffic is high but conversions lag, they’re likely struggling with checkout barriers. A one-second delay in mobile load time can reduce conversions by 7%. Solutions like auto-fill forms, streamlined checkouts, and payment options like Apple Pay or Google Wallet can make a significant difference. Studying competitors with above-average mobile conversion rates can provide valuable insights into successful strategies.
Tools and Methods for Tracking Competitor Traffic by Device
Analytics Platforms for Device Tracking
If you’re looking to track competitor traffic by device, third-party intelligence platforms can fill the gaps left by tools like Google Analytics. For example, Semrush’s Traffic & Market Toolkit uses data from over 200 million internet users, processed through AI algorithms, to estimate competitor performance across desktop and mobile devices. While Google Analytics provides precise internal data, these third-party tools are invaluable for benchmarking your competitors.
Most platforms allow you to toggle between desktop and mobile views, offering insights into traffic trends, visitor counts, and engagement metrics. Features like the Organic Search Dashboard and Referral Dashboard highlight device-specific trends. These tools can reveal whether a competitor’s SEO strategy leans more toward mobile users or desktop users, as well as which external links are driving traffic to their site on different devices. Additionally, the Behavior Dashboard provides a breakdown of total visits and traffic share by device, helping you understand where their primary audience spends time.
Pricing varies depending on the tool. Semrush Pro starts at $139.95/month, with the full Toolkit priced at $289/month. Similarweb begins at $125/month, Ahrefs Lite at $129/month, and Owler offers a basic free plan with Pro options starting at $39/month annually. These platforms not only highlight competitor audience behaviors but also enable you to craft performance marketing strategies tailored to specific devices. Dive into their device-specific reports to uncover detailed traffic trends.
Reading Device-Specific Reports
Once you’ve gathered data from these platforms, it’s time to dig deeper into the reports for more nuanced insights. Start by comparing desktop and mobile traffic trends. For instance, if a competitor sees a spike in mobile traffic over the weekend while desktop traffic remains steady, it suggests their audience is more active on mobile when they’re away from their desks. Hover over key points in trend lines to identify whether traffic surges align with specific campaigns or events.
The Device Preference Share section in the Behavior Dashboard can tell you which device dominates their traffic. For example, if mobile drives the majority of visits but shows high bounce rates, it might point to issues like checkout friction or slow page load times. Similarly, the Sources & Destinations report can track where visitors go after leaving a competitor’s site. If mobile users frequently leave for other sites, it could indicate problems with mobile user experience (UX).
For a more direct comparison, use your own GA4 data. Add "Device category" as a secondary dimension in the "Tech details" report to see how your performance stacks up against competitor estimates.
"If a competitor shows strong mobile traffic, it may signal the need to improve your own mobile experience to stay competitive." – Semrush
Practical Strategies for Small Businesses
Understanding device-specific user behavior can help small businesses fine-tune their marketing and user experience (UX) strategies to stay competitive. By analyzing competitor traffic and identifying key trends, businesses can make smarter decisions to attract and retain customers.
Tailoring Marketing by Device
Once you’ve pinpointed where competitors excel, align your ad spending with device-specific trends. For instance, if a competitor dominates mobile traffic through organic social platforms, consider shifting your budget toward mobile-friendly ads on those same channels. A great example is Terra Organics, which used targeted Google AdWords campaigns in specific delivery areas. This strategy avoided wasted ad spend and brought in 25% of their new customers through these optimized campaigns.
Long-tail keywords are another powerful tool – they make up about 70% of all searches and are less competitive. Use competitor "Top Pages" reports to identify which content types thrive on mobile-heavy platforms versus desktop. For example, Ticketbis, an online ticket platform, used Similarweb Pro to analyze competitor referral traffic and market share. This insight helped them improve search rankings, increase visitors, and boost revenue.
Keep an eye on competitor website updates in real time. If they roll out new mobile navigation features or simplify checkout processes, analyze what’s working for them and adapt those ideas to your own site. Also, remember that two-thirds of all clicks go to the top five organic search results on Google. Focusing on search intent – not just keyword volume – can reduce bounce rates and improve device-specific performance. Enhancing the user experience across devices is equally critical for driving engagement and conversions.
Improving User Experience by Device
Mobile users expect a tailored experience, not just a scaled-down version of a desktop site. Start with a mobile-first design that emphasizes essential content and clear calls-to-action. Meeting Core Web Vitals goals and optimizing assets with techniques like lazy loading and minification can also improve site performance.
Cross-device continuity is another game-changer. Since 90% of users switch between devices to complete tasks, adding features that enable seamless transitions can increase conversion rates by as much as 19%. Simplify mobile forms by using input types like tel or email to bring up the right keyboards, enable autofill, and include progress indicators for multi-step processes.
While mobile users prioritize speed and simplicity, desktop users often look for richer, more detailed interactions. They prefer features like in-depth articles, detailed comparisons, and complex data visualizations. Use the larger screen real estate on desktop to include elements like product carousels, videos, and side-by-side comparison tools.
"Mobile users aren’t necessarily less engaged – they’re differently engaged. They’re making micro-decisions constantly about whether content deserves their limited attention." – Sarah Johnson, Content Strategist
Conclusion
Digging into competitor traffic by device isn’t just about gathering numbers – it’s about uncovering strategic insights that can fuel growth. By comparing desktop and mobile trends, you can better allocate resources and minimize wasted spending.
Take it a step further by diving deeper into the data. Look beyond surface metrics – study traffic graphs to identify exact visitor counts and usage patterns. Check out competitor "Trending URLs" to gain content ideas that resonate with their audience, and use these insights to shape your own strategy. Review flow diagrams of top traffic sources to see which search engines or referring domains are sending the most engaged visitors, and then focus your efforts on those same channels to capture qualified leads.
Optimizing for specific devices isn’t a one-and-done task – it requires ongoing attention. As AI-driven search results continue to change how users interact with search engines across devices, staying ahead means continually refining your data analysis. This includes breaking it down by location, device type, and other key details. Such in-depth analysis can reveal opportunities like underperforming competitor pages or overlooked keywords, helping you gain an edge. Combined with the competitor tracking tools mentioned earlier, this approach ensures your strategy adapts as the market evolves.
For small businesses aiming to compete effectively, expert data analytics services can be a game-changer. Growth-onomics (https://growth-onomics.com) specializes in turning complex device-specific data into actionable strategies. Their expertise in Data Analytics and Performance Marketing helps businesses interpret shifts like Google AI Mode insights and adjust to changes in search technologies that affect visibility across mobile and desktop platforms.
Start applying these methods now to boost your device engagement and drive growth. Compare usage patterns, optimize for your most important device types, and consistently track how your content performs. Success doesn’t always come from having the largest budget – it comes from making smarter, data-informed decisions about how and where to connect with your audience on every device. Stay consistent with these insights, and you’ll be better positioned to outpace the competition.
FAQs
What’s the best way to estimate traffic by device for other sites?
The most effective way to gauge traffic by device for other websites is by leveraging analytics tools that focus on device-specific traffic patterns. Tools like Semrush and Similarweb can provide detailed insights into how traffic is distributed across mobile, desktop, and tablet devices. These platforms compile data to estimate device usage, offering metrics that help marketers spot trends, evaluate performance, and better understand competitor strategies.
How can I tell if a high mobile bounce rate is a problem?
A high mobile bounce rate isn’t necessarily a bad thing – it all depends on the context. Factors like user intent and the type of page play a big role. For instance, informational pages often see higher bounce rates, and that’s not always a problem. But if your focus is on driving conversions or boosting engagement, a high bounce rate could point to issues like slow loading speeds or an ineffective design.
To get the full picture, compare your bounce rate with other metrics, such as session duration or conversion rates, to understand its true impact.
Which device metrics should I prioritize if my budget is limited?
If you’re working with a tight budget, concentrate on essential metrics such as monthly website visitors, traffic channel mix, and user engagement data. These metrics offer meaningful insights into how competitors are performing and can often be monitored using free or basic tools. Focusing on these key areas allows you to identify trends effectively without the need to invest in expensive analytics platforms.