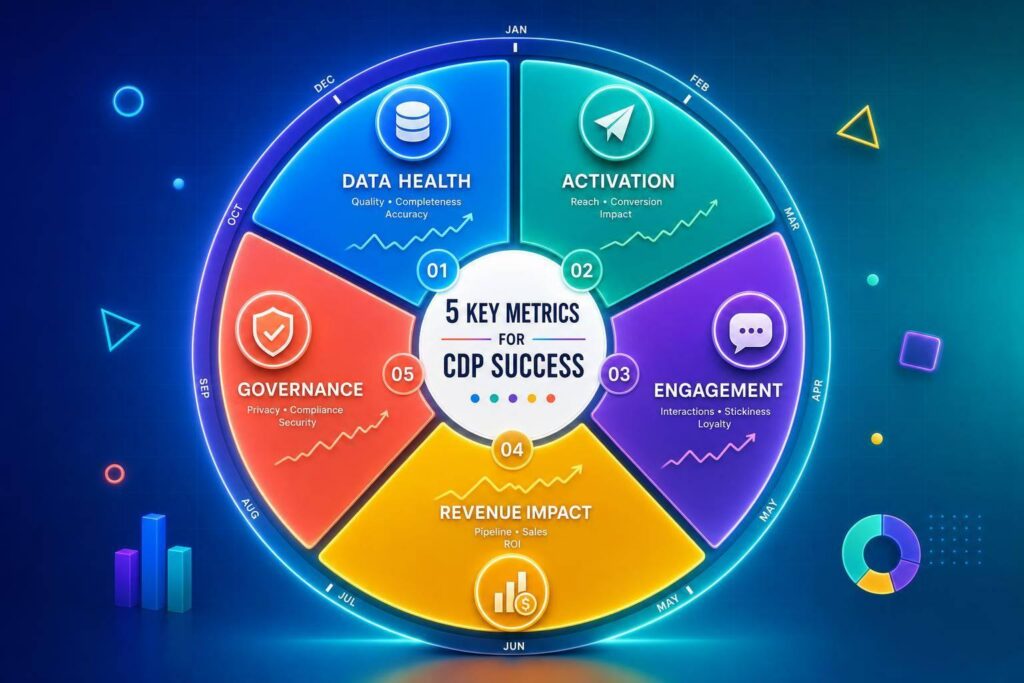
If I want to know whether a CDP is working, I look at five things every month: data quality, campaign speed, customer response, revenue, and team usage. If those five areas improve, the CDP is doing its job. If they don’t, the issue is usually bad data flow, weak audience delivery, low team use, or poor tracking.
Here’s the short version:
- Start with data health: match rate, duplicate reduction, source coverage, latency, completeness, and error rate
- Then check activation: segment build time, time-to-campaign, and delivery rate
- Then measure response: opens, clicks, conversions, retention, churn, CSAT, and NPS
- Then tie it to money: attributed revenue, repeat purchase rate, AOV, CAC, ROAS, CLV, and LTV:CAC
- Then confirm the CDP will keep working: active users, self-service use, consent coverage, DSAR response time, and audit logs
A few numbers stand out:
- A good identity match rate for many SMBs is 50%–70%
- Event latency should stay under 1–2 hours for marketing-triggered use cases
- Delivery rate to downstream tools should usually be 97%+
- Data completeness should be around 95%+
- Consent coverage should usually be 95%–98%
- Many teams aim for 3–5 live use cases in the first 3–6 months
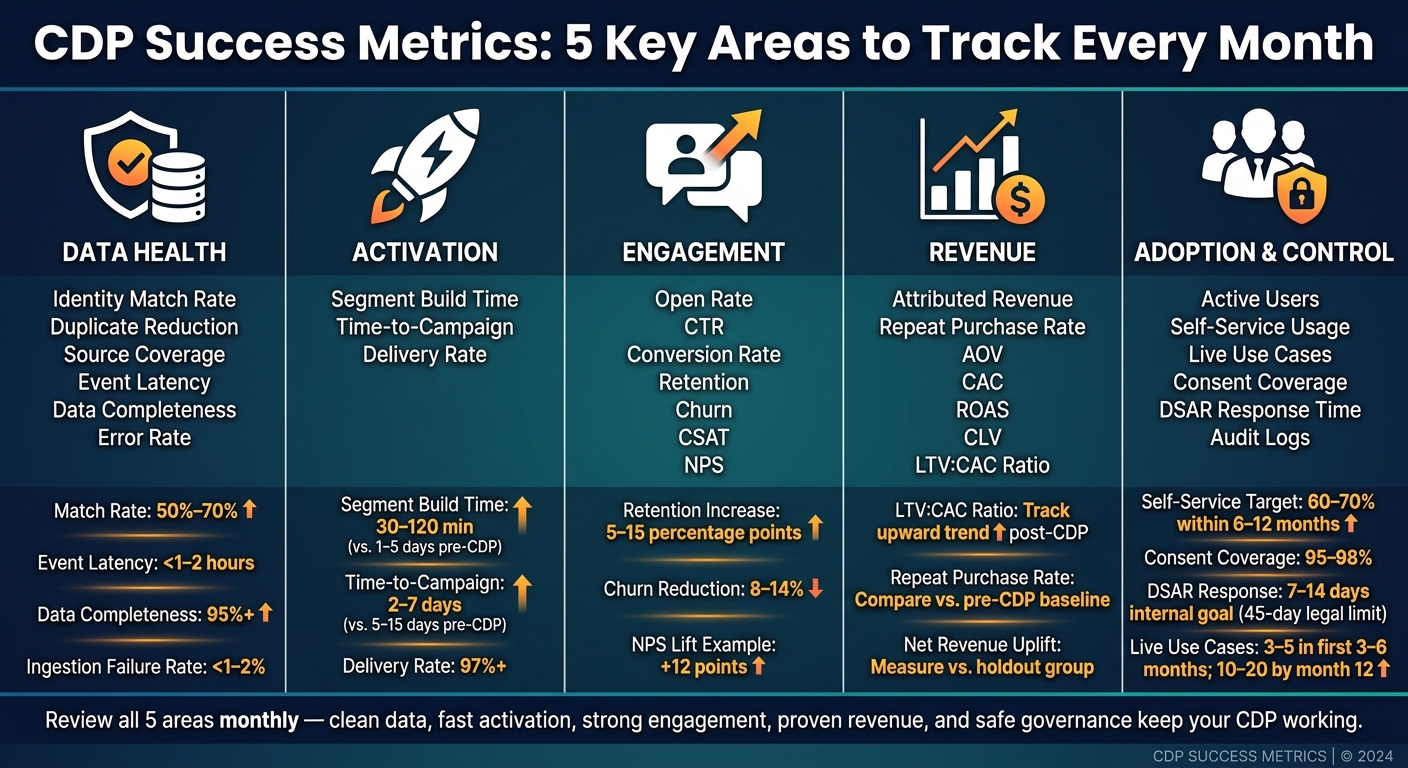
CDP Success Metrics: 5 Key Areas to Track Every Month
Quick comparison
| Area | What I check first | What it tells me |
|---|---|---|
| Data health | Match rate, duplicates, source coverage, latency | Whether the CDP data can be trusted |
| Activation | Segment time, campaign launch time, delivery rate | Whether teams can use the CDP without delays |
| Engagement | Open rate, CTR, conversion, retention, churn | Whether targeting is improving customer response through customer journey mapping |
| Revenue | Attributed revenue, repeat purchase rate, CAC, LTV:CAC | Whether the CDP is affecting sales and profit |
| Usage and control | Active users, self-service, consent, DSAR time | Whether the CDP will keep being used safely |
My takeaway: don’t track everything at once. I’d check the small set of metrics that shows whether the CDP is clean, used, and tied to revenue. That gives me a clear read without drowning in dashboards.
sbb-itb-2ec70df
Checklist 1: Data Health and Platform Performance Metrics
Start here. Before you look at campaign results, make sure the CDP can actually support the work your marketing team needs to do by optimizing your customer journey. If the data is weak, every KPI that comes after it gets shaky too.
Identity Match Rate, Duplicate Reduction, and Source Coverage
Identity match rate shows the share of raw identifiers – email addresses, device IDs, loyalty IDs – that the CDP links into one unified profile.
Match Rate (%) = (Unified profiles ÷ Total input identifiers) × 100
For SMBs connecting their main systems, a good target is 50%–70%. If that number drops all at once, it often means an integration broke or the way identifiers are collected on your site changed. Check this metric monthly, and weekly during the first 60–90 days.
Duplicate reduction shows how well the CDP merges records tied to the same person. Use this formula: ((Prior duplicate rate – Current duplicate rate) ÷ Prior duplicate rate) × 100. Review it monthly to make sure identity resolution is getting better over time.
Source coverage measures how many of your must-have systems are actively sending data into the CDP. For most U.S.-based SMBs, that usually means:
- e-commerce platform
- CRM
- POS system
- email platform
- customer support tool
If only 4 of 5 sources are connected, your coverage is 80%. That missing source leaves a blind spot. One retail case study reported a 40% increase in customer match rates after unifying online cart data with in-store purchases.[3]
Data Freshness, Completeness, Accuracy, and Error Rate
These four metrics answer one basic question: are your records current and usable?
| Metric | Formula | Practical Target |
|---|---|---|
| Event Latency | Avg. (CDP ingest time – event timestamp) in hours | Under 1–2 hours for marketing-critical events |
| Data Completeness | (Required fields filled ÷ Total required fields) × 100 | 95%+ for core marketing fields |
| Field validation pass rate | (Records passing validation ÷ Records checked) × 100 | 97%+ for critical identifiers |
| Ingestion failure rate | (Failed records ÷ Total records attempted) × 100 | Below 1–2%; investigate if consistently higher |
Old data ruins timing. If event latency drifts past two hours, triggers can fire after customer intent has already cooled off. Keep latency under two hours for time-sensitive campaigns.
For completeness and accuracy, percentage-bar dashboards work well because teams can spot gaps fast without digging through raw logs.
Uptime and Query Latency
Uptime tells you how often the CDP is available and working. The formula is: ((Total hours – Downtime hours) ÷ Total hours) × 100. Most cloud-based CDPs aim for 99.9% uptime, which comes out to less than 43 minutes of downtime per month. Track uptime all the time, and set real-time alerts so outages don’t derail triggered campaigns.
Query latency measures how fast the CDP returns results when someone runs an audience query or opens a profile. For most marketing use cases, sub-second to 2–3 seconds is fine. If you’re doing real-time personalization, aim for under 500 ms.
A CDP case study reported a 96% improvement in campaign speed and customer data queries reduced from hours to minutes after centralizing data access and quality controls.[4] Review latency trends monthly, or right away when rolling out new real-time features.
When these numbers stay steady, you can move on to activation speed and customer response metrics.
Checklist 2: Activation and Customer Engagement Metrics
Once your data is in good shape, the next step is simple: check whether the CDP is helping your team move faster and get better audience response. That’s what these metrics are for. They show whether cleaner data is turning into shorter workflows and stronger campaign results.
Segment Build Time, Time-to-Campaign, and Delivery Rate
Segment build time tracks the time from a request to an approved audience. Before a CDP, most SMB teams spend 1–5 business days putting together a single audience segment. After the CDP is live, that same job should usually take 30–120 minutes for standard segments, with most new audience requests finished the same day.[7]
To track this in a way that’s useful, log your average segment build time for 4–6 weeks before go-live. Then measure a rolling 3-month average after launch. That gives you a cleaner before-and-after view instead of relying on one busy week or one easy request.
Time-to-campaign measures the gap between campaign brief and first send. For many SMBs, a fair pre-CDP baseline is 5–15 days. With a mature CDP and standard workflows, that can drop to 2–7 days. For templated campaigns, some teams can get that down to 24–72 hours.[2]
Delivery rate shows what share of your audience actually makes it into downstream tools like your email platform, ad networks, or SMS provider. Use this formula: (Records successfully delivered ÷ Records attempted) × 100. For most channels, a target above 97% makes sense.[1] If that number slips, don’t shrug it off. It usually points to a sync issue, mapping problem, or process gap somewhere in the handoff.
| Metric | Pre-CDP Baseline | Post-CDP Target | Review Frequency |
|---|---|---|---|
| Segment build time | 1–5 business days | 30–120 minutes | Monthly (rolling 3-month avg.) |
| Time-to-campaign | 5–15 days | 2–7 days | Monthly |
| Delivery rate | Varies by channel | 97%+ | Monthly; investigate sharp drops right away |
Once delivery is stable, shift your focus to response. Fast audience building is nice, but if the audience quality doesn’t improve, you’re just moving faster in the wrong direction.
Conversion Rate, Open Rate, Click-Through Rate, and Response Rate
The clearest way to judge CDP audience performance is to compare it against a control group using the same creative and timing. In plain English: keep the message the same, keep the send time the same, and change ONLY the audience logic.
That means one group uses CDP-driven segments, while the control group uses your older targeting method. This kind of test makes it much easier to see what the CDP is actually doing.
| Metric | Baseline (Control Group) | CDP Audience | Uplift (%) |
|---|---|---|---|
| Email open rate | Your pre-CDP avg. | Post-CDP avg. | (CDP − Baseline) ÷ Baseline × 100 |
| Email CTR | Your pre-CDP avg. | Post-CDP avg. | (CDP − Baseline) ÷ Baseline × 100 |
| Conversion rate | Your pre-CDP avg. | Post-CDP avg. | (CDP − Baseline) ÷ Baseline × 100 |
| SMS response rate | Your pre-CDP avg. | Post-CDP avg. | (CDP − Baseline) ÷ Baseline × 100 |
Run these comparisons across at least 3–5 campaigns per channel before you call it a win or a loss. One campaign can swing for all kinds of reasons – seasonality, offer strength, channel fatigue, even plain luck.
There’s also an important nuance here. If CDP audiences produce better conversion rates but open rates stay about the same, that still matters. It usually means personalization is helping further down the funnel. The offer may be better matched, the timing may be sharper, or the message may land better with the people who matter most.
If response starts moving up, the next thing to check is whether those gains stick.
Retention, Churn, CSAT, and NPS
Engagement metrics tell you about short-term response. Retention and satisfaction metrics tell you whether the CDP is helping build longer customer relationships.
Track monthly retention rate with this formula: (Customers active this month who were also active last month ÷ Customers active last month) × 100. Track monthly churn rate as the inverse: (Customers active last month but not this month ÷ Customers active last month) × 100.
To get a cleaner read on CDP impact, compare cohorts. A useful setup is customers who received CDP-powered lifecycle campaigns – like win-back flows, onboarding series, or loyalty offers – against customers who got more generic messaging. That comparison helps separate CDP effect from normal business movement.
Research on data-driven personalization shows retention increases of 5–15 percentage points and churn reductions of 8–14% over 90+ day periods.[6] One CDP deployment case study reported a 30% improvement in customer retention within six months.[8]
For satisfaction, CSAT and NPS can stay pretty simple. CSAT works best right after key moments, like a purchase, a support resolution, or an onboarding session. NPS is usually better on a quarterly cadence. In both cases, track changes over time by segment instead of looking at one blended company-wide score.
A banking personalization case study found that after combining a CDP with AI-driven targeting, customer churn dropped by 28% and NPS increased by 12 points.[5] Breaking out the results by segment helps you spot where CDP targeting is doing its best work.
Checklist 3: Revenue and ROI Metrics
Strong engagement isn’t enough. Leaders need proof that the CDP is driving revenue after implementation. That means connecting CDP activity to sales results and unit economics.
Attributed Revenue, Net Revenue Uplift, and Repeat Purchase Rate
Attributed revenue is the revenue you can reasonably tie to a CDP-driven action, like an abandoned-cart segment, a win-back journey, or a high-value audience campaign. Track it separately from total revenue so you can isolate CDP impact.[14][15] Then pair it with campaign cost and conversion count. That way, you’re measuring efficiency, not just output.[9][10]
Net revenue uplift looks at the incremental gain after CDP activation against a baseline. Measure revenue from a target segment before the CDP campaign. Measure it again after launch. Then subtract the baseline trend or use a comparable holdout group to estimate the lift.[9][11] This metric carries more weight when the time window and audience scope stay the same.[9][11]
Repeat purchase rate is the share of customers who buy more than once. It shows whether the CDP is improving loyalty instead of just pushing one-time conversions. In many cases, this is where a CDP shows its value most clearly, because lifecycle messaging, loyalty segments, and replenishment campaigns tend to affect repeat behavior more than top-of-funnel metrics. Use your own historical rate as the baseline.
ROAS, CAC, CLV, AOV, and LTV-to-CAC Ratio
These five metrics show whether CDP-driven growth is profitable:
- AOV = total revenue ÷ total orders
- CAC = total sales and marketing cost ÷ new customers acquired
- CLV/LTV = AOV × purchase frequency × customer lifespan
- ROAS = revenue from ads ÷ ad spend
- LTV-to-CAC ratio = customer lifetime value ÷ customer acquisition cost
Track each one against your own pre-CDP baseline.
For CAC, don’t stop at a benchmark figure. Compare it with contribution margin on the first order.[12][13] That’s the check that tells you whether new customer growth makes financial sense.
The LTV-to-CAC ratio is the clearest roll-up metric in this group. If it goes up after CDP implementation, the CDP is likely improving targeting, personalization, or retention in ways that build over time. If engagement looks better but this ratio doesn’t move, that’s a sign to dig deeper. The issue may be that activation is driving more activity without leading to more profitable customer behavior.[9][10][11]
Checklist 4: Adoption, Governance, and Next Steps
Revenue shows that the CDP is doing its job. Adoption and governance show whether it can keep doing that job month after month. If only one team uses the platform, or if consent records have gaps, the gains from Checklists 1–3 can fade fast.
Active Users, Self-Service Usage, and Live Use Cases
Active users are the distinct people who log into the CDP and complete at least one tracked action in a given month. That action might be building a segment, publishing an audience, setting up a journey, or running a report. Track this number with adoption rate: active users ÷ total eligible users × 100. A healthy setup should show usage spreading across marketing, product, and customer success, not sitting with just one team.[16][18][14]
Self-service usage measures the share of CDP actions that business users handle on their own, without help from data or engineering. That includes things like segments built, audiences exported, and journeys launched. A good target is 60%–70% self-service for routine segmentation within 6–12 months.[17][14] If that number is still low after a year, the usual suspects are pretty plain:
- Training hasn’t clicked
- Data modeling needs work
- Integrations are slowing people down
Live use cases are production workflows that run on CDP data. Track the total each month and watch for steady growth. In the first 3–6 months, 3–5 live use cases built around quick wins – like abandoned cart, welcome series, and reactivation – make sense. By month 12, 10–20 active use cases is a fair benchmark for most SMBs.[14]
Consent Coverage, DSAR Response Time, and Audit Readiness
As usage grows, the next check is simple: can the data scale safely?
Consent coverage is the percentage of active profiles with a valid, timestamped consent record and linked preferences for key channels like email, SMS, push, and ads. A good range is 95%–98% coverage, with clear flags for opt-outs and channel-level permissions.[14][19]
DSAR response time is the average number of days between receiving a data subject request and closing it. Under CCPA/CPRA in California, teams have 45 days to respond. Many set an internal goal of 7–14 days to cut risk and avoid a pileup.[14] Track both the average and the maximum response time every month. The average shows the normal pace. The maximum shows where things are getting stuck.
Audit readiness comes down to proof. You should be able to show structured logs for data ingestion, profile merges, audience exports, and identity resolution changes. Keep data lineage docs up to date. Review policy exceptions too, such as manual exports with no documented purpose or missing retention controls.
Conclusion: The Core Metrics to Review Every Month
Review five areas every month: data health, activation, revenue, adoption, and governance. Looking at them together helps you spot problems early – weak data, slow workflows, low usage, or compliance gaps – before they spill into the rest of the system. It also makes patterns easier to read, like strong data health with low adoption, or thin consent coverage paired with slow DSAR response times.
FAQs
Which CDP metrics matter most first?
Start with metrics tied straight to business results: Customer Lifetime Value (CLV), conversion rates, and revenue attribution.
Then look at data quality metrics like completeness, validity, and uniqueness. Stick to 3–5 KPIs that match your goals so you can track both effectiveness and efficiency without drowning in too much data.
How long should it take to see CDP results?
It depends on the metric you’re tracking. Some signals, like click-through rates, can move within days or weeks. Other changes, especially inside day-to-day business processes, often take more time.
For example, data quality work may show measurable progress – such as fewer duplicate customer IDs – over about six months. That’s why clear benchmarks at the start matter so much. They make it easier to track progress and show the value of the work to stakeholders.
What if CDP engagement improves but revenue doesn’t?
If engagement goes up but revenue doesn’t, that can point to a gap between customer activity and profit. In plain English: people may be clicking, visiting, or sticking around more, but they’re not turning into the customers that drive revenue.
That often means your work is bringing in or keeping users who don’t convert into high-value customers.
To figure out what’s going on, take a close look at a few areas:
- Review your attribution models
- Audit data quality
- Analyze customer cohorts
The goal is to make sure your tracking connects back to CRM revenue and to check whether engagement is reaching the customer segments that matter most.