

Custom benchmarks are the key to measuring growth in a way that makes sense for your business. Instead of relying on generic industry averages, which may not align with your strategies or audience, custom benchmarks use your own historical data to set realistic, actionable goals. Here’s how to do it:
- Focus on the right metrics: Track KPIs like Monthly Recurring Revenue (MRR), Customer Acquisition Cost (CAC), and Net Revenue Retention (NRR). Avoid vanity metrics that don’t drive decisions.
- Use your data: Analyze 1–2 years of internal data to identify trends and set a baseline. Segment by acquisition channel, geography, or customer profile for deeper insights.
- Set realistic targets: Calculate growth rates and use formulas like Month-over-Month (MoM) or Compound Monthly Growth Rate (CMGR) to create achievable goals.
- Leverage dashboards: Use tools to track performance in real-time, segment data, and ensure accountability across teams.
- Review regularly: Adjust benchmarks based on market shifts, new products, or business changes.
Custom benchmarks provide clarity and precision, helping you allocate resources effectively and focus on what drives growth. Regular reviews and clear tracking ensure your metrics stay aligned with your business goals.
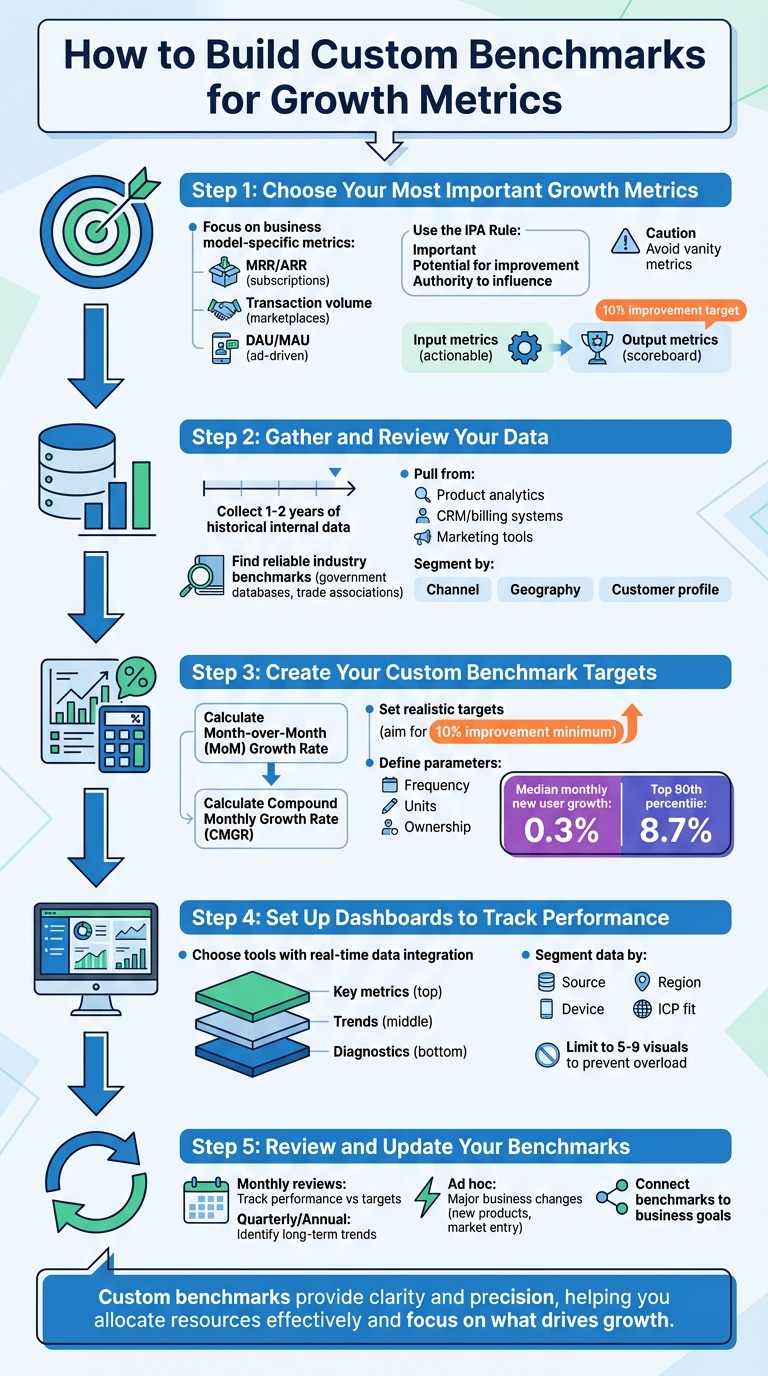
5-Step Process for Building Custom Growth Benchmarks
Use Historical Data to Grow Your Business (w/ Megan Bowen) | Metrics & Chill
What Are Growth Metrics and Why They Matter
Growth metrics are like your business’s vital signs – they reveal if you’re on the right path, highlight strengths, and pinpoint areas needing improvement.
Metrics like Monthly Recurring Revenue (MRR) and Annual Recurring Revenue (ARR) show your predictable, recurring income. These figures are crucial for projecting financial stability and managing cash flow effectively. Then there’s Customer Acquisition Cost (CAC), which tells you how much it costs to bring in a new customer, and CAC Payback, which measures the time it takes to recover that cost. Together, these metrics shine a light on how efficient your sales and marketing strategies are.
Churn Rate is another key metric, typically broken down into two types: logo churn (customers lost) and revenue churn (income lost). A high churn rate often signals problems with your product–market fit or customer satisfaction. On the flip side, Customer Lifetime Value (LTV or CLV) estimates the total value a customer brings over their relationship with your business. This metric helps you gauge how much you can afford to spend on acquiring new customers. A healthy LTV:CAC ratio is generally 3:1 or higher, while a ratio above 5:1 might suggest you’re not investing enough in growth.
Most SaaS companies track between 10 and 24 metrics to keep tabs on their overall health. Among these, Net Revenue Retention (NRR) stands out – it measures revenue growth from existing customers, factoring in upgrades and downgrades. An NRR above 100% means you’re growing without relying solely on new customers. There’s also the Rule of 40, a benchmark that combines your revenue growth rate and profit margin, with a target of 40% or higher.
Why do these metrics matter? They act as a roadmap for decision-making. They help you identify which customer segments, channels, and products bring the most value, so you can focus your efforts where they count. As Morgan Brown, VP of Growth at Shopify, explains:
"Having great telemetry is a necessary condition for being a great growth team. You can’t be great at growth without rock-solid data infrastructure".
Problems with Generic Benchmarks
While industry benchmarks can be helpful, they often fall short because they don’t reflect your business’s unique stage, industry, or customer base.
For example, companies define metrics like "conversion" differently. One might count a free trial signup, while another only counts paying customers. This inconsistency makes external benchmarks unreliable – you end up comparing apples to oranges.
Another issue is the tendency to chase short-term goals to hit benchmark numbers instead of addressing deeper business challenges. Teams that over-prioritize benchmarks risk making decisions that look good on paper but don’t drive real progress. As Ben Horowitz wisely puts it:
"The map isn’t the terrain. Every company is different, and you’re the expert on yours".
Advantages of Custom Benchmarks
Custom benchmarks, on the other hand, offer tailored insights by using your historical data as a baseline. Instead of wondering how your conversion rate compares to an industry average, you evaluate how it stacks up against your own past performance and set realistic improvement goals.
This tailored approach provides actionable insights. By breaking your metrics down by acquisition channel, customer profile, or pricing plan, you can pinpoint which areas are driving profitability and which are dragging you down.
Custom benchmarks also adapt to changes in your business – whether it’s a new product launch, a shift in marketing spend, team expansion, or entering a new market. For example, an ideal CAC payback period might be 12–18 months for SMBs or product-led growth models, but it can stretch to 24 months for enterprise sales. Similarly, monthly logo churn varies: 2–4% for SMBs, 1–2% for mid-market companies, and under 1% for enterprise clients.
The real win with custom benchmarks is precision. When you define what a "profitable day" looks like based on your specific costs and ad performance history, you can make quicker, smarter decisions about where to allocate your resources. Instead of relying on generic industry data, you’re building on your proven internal metrics to drive growth.
Step 1: Choose Your Most Important Growth Metrics
To effectively grow your business, start by identifying the metrics that directly align with how your company creates value and improves over time. These should be the numbers that truly drive your success.
How to Select the Right Metrics
The right metrics depend on your business model. For example:
- Marketplaces: Focus on transaction volume.
- Ad-driven companies: Prioritize engagement metrics like Daily Active Users (DAU) or Monthly Active Users (MAU).
- Subscription-based businesses: Keep an eye on revenue metrics such as Monthly Recurring Revenue (MRR) or Annual Recurring Revenue (ARR).
Interestingly, about 50% of businesses prioritize revenue, 35% focus on customer growth, and 30% emphasize consumption metrics. However, placing too much emphasis on revenue early on can sometimes limit your ability to make long-term adjustments.
To refine your choices, try using the Jobs to be Done framework. This approach helps you understand what users "hire" your product to do. For instance, a fintech app might track "bank accounts linked", while a freemium collaboration tool like Slack might measure "paid teams" to assess its success.
Avoid vanity metrics like total registered users – they may look good but don’t provide actionable insights. Instead, focus on metrics that reflect meaningful growth, such as weekly signups or conversion rates. The IPA Rule can help here: choose metrics that are Important, have Potential for Improvement, and fall within your Authority to influence.
Lastly, distinguish between input and output metrics. Output metrics, like revenue, serve as a scoreboard – they show results but don’t guide action. Input metrics, such as conversion rates or traffic volume, are actionable and provide quicker feedback for making adjustments.
Once you’ve selected your key metrics, prioritize them to tackle your biggest growth challenges.
How to Prioritize Your Metrics
Start by ranking your metrics based on their impact. Use the "Metric on Fire" principle – focus on the metric that’s currently causing the most trouble or acting as a bottleneck in your growth engine.
Assign ownership to each metric. For example, instead of tracking "Total MRR" as a single figure, break it down into "Self-service MRR" and "Enterprise MRR" so specific teams are held accountable. As Twilio Segment emphasizes:
"Your dashboard metrics should make it impossible to hide from failure".
Balance your focus between leading and lagging indicators. Leading indicators, like email open rates or the number of sales calls made, can predict future performance and allow for quick adjustments. Lagging indicators, such as closed revenue, reflect past results. Both are crucial: leading indicators help you course-correct, while lagging indicators measure outcomes.
For early-stage startups, prioritize cohort retention over revenue. This ensures you’re building something people want to keep using before optimizing for monetization. If your business relies heavily on performance marketing, focus on efficiency metrics like the LTV/CAC ratio or payback periods.
Finally, choose an appropriate time window for tracking your metrics. Daily or weekly tracking allows for faster iterations, while monthly tracking can smooth out short-term fluctuations. Pick a timeframe that’s stable enough to show meaningful trends without being overly reactive.
Step 2: Gather and Review Your Data
Once you’ve zeroed in on your key metrics, it’s time to build a solid foundation by combining your historical performance data with reliable external benchmarks. This step ensures you have a well-rounded view of your business performance in context.
How to Collect Internal Data
Start by gathering 1–2 years of historical data. This will help you identify seasonal trends and establish a baseline before comparing your numbers to external benchmarks. Your internal data is crucial because it reflects your specific business model, customer behavior, and market dynamics.
To get a comprehensive view, pull data from several sources:
- Product analytics platforms like Mixpanel or Amplitude
- CRM or billing systems for customer and revenue data
- Marketing acquisition tools for insights into how customers find you
Focus on key fields like customer IDs, payment and churn dates, plan IDs, MRR (Monthly Recurring Revenue), user activation events, timestamps, and acquisition channels. Financial reports can also shed light on sales and marketing expenses, cost of goods sold, and payment processing fees.
It’s also essential to standardize metric definitions across teams. For example, decide whether "customer" includes free trial users or only paying accounts. When calculating metrics like LTV (Lifetime Value) or CAC Payback (Customer Acquisition Cost Payback), use customer-level gross margin instead of raw revenue to get a clearer picture of profitability.
Segmenting your data can reveal hidden insights. Break it down by acquisition channel (e.g., Social vs. Organic Search), geography, or device type. Aggregated figures often mask important trends that segmentation can highlight.
Once you’ve analyzed your internal data, the next step is to compare it to external benchmarks to see how you stack up.
How to Find Industry Benchmarks
External benchmarks provide context for your internal performance, but the quality of the benchmark data matters more than the quantity. Reliable sources include government databases such as the US Census Bureau‘s Statistics of US Businesses (SUSB) and the Annual Business Survey (ABS). These resources offer industry-specific metrics on sales, payroll, and workforce demographics.
For gaps not covered by public data, third-party firms and industry reports can be helpful, but always check their methodology. Make sure the data is recent and accurately represents your industry. As Avinash Kaushik, a Digital Marketing Evangelist, advises:
"Input influences output more than the processing of the input. So, be aware of those three biases [sampling, self-reported, and methodology], and do your best to accommodate for them".
Opt for observed data over self-reported figures whenever possible. Tools like SimilarWeb provide "observed performance" metrics such as traffic sources and user engagement. Keep in mind, though, that these tools work best for websites with over 100,000 unique visitors per month. For smaller sites (under 50,000 visitors), the data may be less reliable.
Trade associations can also be a goldmine for sector-specific insights, especially for private companies and retailers.
When comparing your metrics to industry benchmarks, always consider the context. Factors like company size, go-to-market strategy (e.g., top-down vs. bottom-up), and product type (e.g., application vs. infrastructure) can have a significant impact on the numbers. Use these benchmarks as a reference point to refine your goals and set realistic targets.
sbb-itb-2ec70df
Step 3: Create Your Custom Benchmark Targets
Leverage historical data and industry standards to set realistic goals that strike a balance between ambition and feasibility.
Formulas for Calculating Your Targets
To measure short-term changes, use the Month-over-Month (MoM) Growth Rate formula:
((Current Month Value - Previous Month Value) / Previous Month Value) * 100.
For a broader view of growth over time, calculate the Compound Monthly Growth Rate (CMGR):
((Last Month Value / First Month Value)^(1 / # of months)) - 1.
If your business is revenue-driven, consider these metrics:
- Retained Monthly Revenue: Multiply your monthly retained users by the revenue per user.
- Expansion Revenue: Multiply new paid users by the revenue per user.
These calculations will give you a clearer picture of overall revenue growth. Keep in mind that even a seemingly small churn rate can have a big impact. For instance, a 5% monthly churn rate leads to a 45.96% annual customer loss.
When setting targets, avoid relying on small numbers with high percentage growth. As Archana Madhavan, Senior Learning Experience Designer at Amplitude, explains:
"Growth is rarely linear, so understanding the nuances of MoM increases and decreases – from what drives them to changing fluctuations – is the key to maintaining and increasing it".
If your current conversion rate is 2%, aim for a modest increase to 2.5% rather than an unrealistic leap to 5%. Digital Marketing Evangelist Avinash Kaushik suggests a straightforward approach:
"If all else fails just set your target for a 10% improvement. Anything, absolutely anything, can be improved by 10% with just a small amount of effort".
To provide some perspective, the median monthly new user growth rate is 0.3%, with the top 90th percentile achieving 8.7%. For engagement, median monthly active user growth is 0.5%, while leading companies hit 7.5%.
With these formulas and benchmarks in mind, focus on defining actionable parameters to guide your goals.
How to Define Benchmark Parameters
Once your targets are set, establish clear parameters for tracking progress. Start by deciding how frequently you’ll review each metric – daily, weekly, or monthly. Define the units you’ll measure, whether as absolute numbers (e.g., 1,000 new users) or percentages (e.g., 5% growth). Assign ownership of each metric to specific individuals or teams, such as your Growth Lead, Finance team, or Product Manager.
Organize your KPIs in a centralized dashboard, including historical data, targets, review schedules, and team responsibilities. This ensures accountability and keeps everyone aligned. To make your benchmarks even more precise, break down data by factors like traffic source, device type, or audience demographics. This segmentation allows you to set tailored targets that reflect the unique behavior of different user groups.
Step 4: Set Up Dashboards to Track Performance
Now that you’ve established your benchmark targets, it’s time to set up dashboards that make performance tracking a breeze. Dashboards help transform raw data into actionable insights, allowing you to quickly identify trends and address issues. As Beancount.io aptly puts it:
"A well-built growth dashboard isn’t just a collection of charts; it’s a decision-making engine".
By consolidating reports, you can view cross-project data in one place. This makes it easier to spot negative trends early, minimizing long-term damage. Dominique Jackson, Former Content Marketer at Baremetrics, emphasizes:
"The faster you can spot negative trends or issues in your business, the less long term damage it’ll cause you".
Dashboards also promote transparency by linking individual contributions to growth metrics, which can motivate teams and lead to better decisions. A well-designed dashboard can answer critical questions about your business’s health in just seconds. To maximize the benefits, choose tools that integrate real-time data and offer interactive features.
How to Select Dashboard Tools
Choosing the right dashboard tools is key to simplifying data tracking. Start with platforms that support real-time data integration. Look for tools that connect directly to sources like Google Ads, your CRM, Stripe, or Recurly using "Instant-On" connectors. This eliminates manual data entry errors and ensures you’re working with up-to-date information.
Interactive features are another must-have. Tools with drill-down capabilities, zoom functions, and interactive charts – like line graphs, bar charts, and tree maps – let you dig deeper into trends and uncover insights. Collaboration tools, such as commenting systems, @mentions, and Slack integrations, make it easier for teams to discuss findings without leaving the platform. With nearly 70% of Chief Data Officers aiming to improve how they use insights, dashboards and reporting remain a top priority.
To avoid confusion caused by conflicting data, opt for platforms that allow admins to designate specific dashboards as "official." Amplitude highlights the importance of this feature:
"By designating a dashboard as ‘official,’ you’re telling all Amplitude users in your organization that they can trust the content they find on it to be current, accurate, and vetted".
When assessing tools, organize your needs into three categories:
- Data connectivity: API integrations, CSV imports, and access to historical data.
- Analysis tools: Features like cohort analysis, segmentation filters, and anomaly detection.
- Output and sharing: Options for exporting data (PDF/PNG/CSV), white-label reporting, and shared links.
For clarity, structure your dashboard into three layers. The top layer should highlight key metrics like New MRR, CAC, and the LTV:CAC ratio. The middle layer can show trends over time, such as churn rates or payback periods. The bottom layer should provide diagnostic insights, like cohort heatmaps, channel performance tables, or reasons for churn. Even if your dashboard summarizes data monthly, ensure you’re storing data daily for accuracy.
How to Segment Data for Better Analysis
Blended metrics that represent your entire company can sometimes give a false sense of security. Beancount.io warns:
"Never rely solely on blended, company-wide metrics. Segment your data to uncover hidden truths about your business".
Segmentation helps you pinpoint which channels, customer groups, or products are driving growth and which may be holding you back. For instance, while your overall Customer Acquisition Cost (CAC) might seem acceptable, breaking it down could reveal that paid channels have a much higher CAC compared to organic ones.
Use multi-dimensional filters to refine your analysis. Segment by traffic source (organic vs. paid), device type (mobile vs. desktop), region, or Ideal Customer Profile (ICP) fit. If mobile users show lower engagement than desktop users, you’ll know where to focus your optimization efforts.
Cohort heatmaps are especially useful for tracking retention by signup month. They can reveal whether product updates are improving long-term retention or if newer cohorts are churning faster than older ones. Similarly, stacked bar charts showing MRR movements – like expansion, contraction, and churn – can clarify how each segment contributes to your Net Revenue Retention.
Another critical segmentation is distinguishing between voluntary churn (customer choice) and involuntary churn (failed payments). This helps you decide whether to focus on improving the product experience or addressing billing issues. Healthy SaaS companies typically see monthly logo churn below 1% for enterprise customers, while SMBs often face 2–4%.
To keep dashboards effective, limit them to 5–9 visuals. This prevents cognitive overload and encourages consistent use.
Step 5: Review and Update Your Benchmarks
Once you’ve set up performance dashboards, the next step is to regularly review and adjust your benchmarks. Why? Because business landscapes are constantly shifting. What worked six months ago might not hold up today. While it’s important to maintain consistency in your benchmarks, they should still adapt to reflect major changes in your business or market.
Set a regular schedule for reviewing benchmarks that aligns with your business operations. This will help ensure that your strategies stay relevant and effective.
When to Review Your Benchmarks
How often you review benchmarks depends on your goals and the type of campaigns you’re running:
- Monthly reviews: These are great for tracking performance against targets and making real-time adjustments as the year progresses.
- Short-term campaigns or A/B tests: For these, consider checking benchmarks every 2–4 weeks. Keep in mind that most A/B tests require at least 1,000 conversions per month to reach statistical significance.
- Annual reviews: These are essential for spotting trends over time. Use data from the past 6–12 months to identify seasonal patterns and year-over-year trends before setting new benchmarks.
- Ad hoc updates: Major business changes – like launching a new product, redesigning your website, or entering a new market – should trigger a review. Similarly, external factors, such as competitor moves or regulatory changes, might also call for adjustments.
Here’s a quick breakdown of review frequencies and their focus areas:
| Review Frequency | Purpose | Key Focus Areas |
|---|---|---|
| Short-term (2-4 Weeks) | Campaign Validation | Trial conversions, ad spend efficiency, A/B test results |
| Monthly | Tactical Tracking | Performance vs. monthly targets, seasonal adjustments |
| Quarterly/Annual | Strategic Alignment | Historical trends, YoY growth, long-term goals |
| Ad hoc | Major Business Shifts | Strategy pivots, new product launches, market entry/exit |
When setting targets, aim for a slight stretch beyond current performance levels to keep your team motivated and growing.
How to Connect Benchmarks to Business Goals
Benchmarks should tie directly to your business objectives. Start by working backward from your goals. For example, if your aim is to secure 1,000 new signups in a quarter, calculate the benchmarks needed to achieve that – like the number of leads required, expected conversion rates, or the traffic volume needed from specific channels.
Avoid wasting time on vanity metrics. As Neil Patel, Co-Founder of NP Digital, puts it:
"KPIs should be meaningful enough to use in your marketing decisions. They need to concentrate on material gains in terms of contributing cold hard cash to your bank account."
Focus on metrics that directly impact your bottom line, such as Customer Acquisition Cost (CAC), lifetime value (LTV), and Net Revenue Retention. To make benchmarks actionable, break them down by acquisition channels, audience segments, or device types. This way, you can clearly see where to optimize.
To get a clearer picture, align your benchmarks with the entire customer journey. Use multi-touch attribution models instead of relying solely on last-touch data, which often overlooks the value of earlier interactions. Keep everything organized by documenting benchmarks in a spreadsheet or dashboard, ensuring that all KPIs and targets are accessible and tied to specific goals.
How Growth-onomics Can Help
Refining benchmarks isn’t a one-time task – it’s an ongoing process that requires strategic insight and a data-driven approach. That’s where Growth-onomics comes in. They specialize in turning raw data into actionable strategies, helping you set benchmarks that align with your business goals.
Whether you need help segmenting your audience, implementing multi-touch attribution models, or assessing whether your targets are realistic, Growth-onomics has the expertise to guide you. Their performance marketing and analytics focus ensures that every benchmark you set drives measurable results.
Want to learn more about how Growth-onomics can support your growth? Visit https://growth-onomics.com.
Conclusion
Custom benchmarks act as a tailored roadmap, reflecting your specific business model, audience, and goals. While general industry standards can give you a baseline, custom benchmarks dive deeper, offering insights that can truly impact growth. By focusing on the right metrics, analyzing past performance, setting achievable targets, and consistently reviewing your progress, you can turn raw numbers into actionable strategies.
Experts often emphasize that KPIs should lead to real, measurable outcomes. Metrics like customer acquisition cost (CAC), lifetime value (LTV), and conversion rates are far more impactful than vanity numbers that don’t drive meaningful change.
Benchmarking isn’t a one-and-done process – it’s ongoing. Markets shift, customer preferences change, and your business evolves. What worked last quarter might not work today. Regular check-ins, whether monthly, quarterly, or tied to major business shifts, help keep your benchmarks relevant and aligned with your goals.
If you’re looking to translate these insights into real growth, having expert support can make all the difference. Growth-onomics specializes in performance marketing and analytics, helping businesses set realistic targets, implement advanced tracking, and connect every benchmark to measurable outcomes. With their guidance, you’re not just collecting data – you’re using it strategically to fuel growth.
Want to take your benchmarks to the next level? Visit https://growth-onomics.com to see how Growth-onomics can help power your growth strategy.
FAQs
How can I identify the most important growth metrics for my business?
To pinpoint the growth metrics that matter most, start by clarifying your primary business goal. Are you aiming to lower your cost-per-lead (CPL), boost customer lifetime value (CLV), grow monthly recurring revenue (MRR), or enhance customer retention? Defining this goal will help you zero in on the metrics that truly align with your objectives.
Once your goal is clear, focus on key performance indicators (KPIs) that directly connect to it. These KPIs should be measurable with reliable data and easy to track. Skip the metrics that may seem interesting but don’t contribute to meaningful progress. After selecting a few core metrics, set up a custom dashboard to track them in real time. Common metrics to consider include conversion rate, average order value, churn rate, and revenue growth.
As your business evolves, revisit and adjust your benchmarks regularly. By sticking to metrics that align with your objectives, you ensure every decision contributes to measurable growth and long-term progress.
What are the best tools to create and track custom growth benchmarks?
To create and track custom benchmarks for growth metrics effectively, a few tools stand out for simplifying the process:
- Panoramata: Automatically gathers competitor data, including traffic, ad spend, and SEO rankings, helping you establish benchmarks rooted in practical, competitive insights.
- SEMrush: Delivers detailed keyword, backlink, and paid search analytics, which can be translated into actionable benchmarks for growth.
- Databox: Provides a Benchmark dashboard, allowing you to compare essential metrics like revenue, churn, and customer acquisition costs (CAC) with similar companies.
These tools make it easier to pinpoint critical metrics, collect the data you need, and monitor progress over time. Plus, they’re tailored for U.S. standards, using dollars ($) for currency, MM/DD/YYYY for dates, and imperial units for measurements.
How often should I update my custom benchmarks to keep them relevant?
To keep your benchmarks relevant, plan to review and update them at least once a quarter. This ensures they align with your evolving business goals and reflect current market trends. It’s also wise to revisit them whenever your industry undergoes major shifts or your organization experiences significant changes.
Using up-to-date benchmarks – preferably based on data that’s no older than 18 months – can help you make smarter decisions and stay ahead in a competitive landscape.