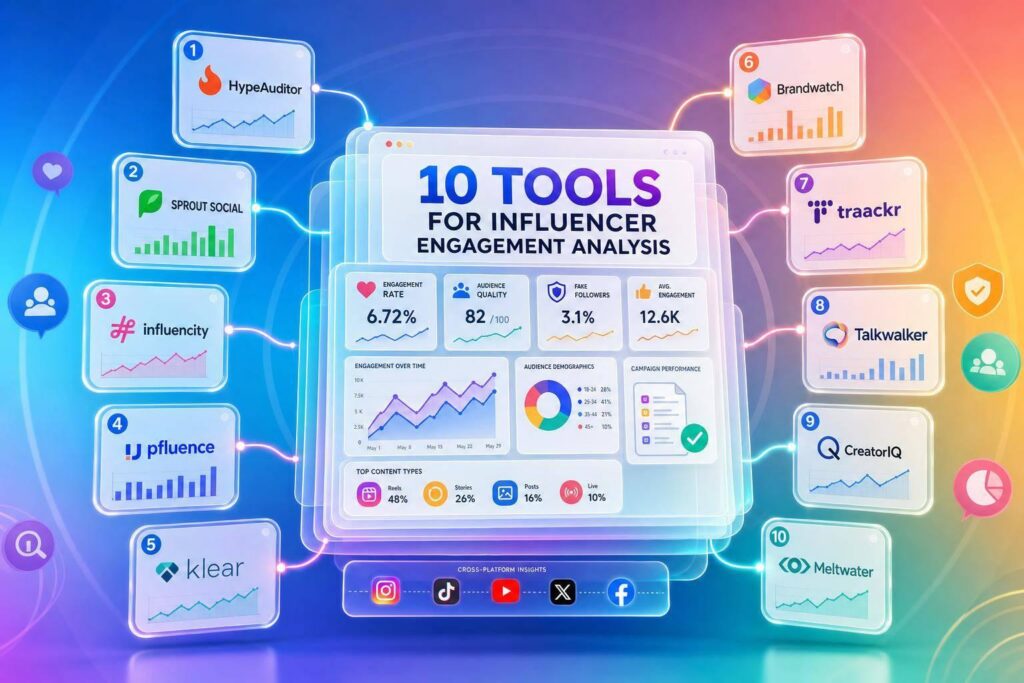
If I’m choosing an influencer analysis tool, I’d match it to the job first. For fraud checks, I’d look at HypeAuditor or Traackr. For revenue and post-click tracking, I’d lean toward Growth-onomics or Upfluence. For owned-account reporting, I’d use Instagram Insights and TikTok Analytics.
Here’s the short version:
- Engagement rate is usually measured as engagements ÷ followers × 100 or engagements ÷ reach × 100
- Follower-based ER% helps compare creators by size
- Reach-based ERR% gives a better read on post performance when reach data is available
- The best tools go beyond likes and comments and show:
- audience quality
- location and demographics
- fraud flags
- reporting tied to clicks, sales, or ROI
- For U.S. campaigns, I’d pay close attention to:
- audience location
- saves and shares
- watch time and completion rate
- cost per engagement, click, and acquisition
This list covers 10 options: Growth-onomics, HypeAuditor, Upfluence, Later, Brandwatch Audiences, Meltwater, Traackr, IQFluence, Instagram Insights, and TikTok Analytics.
Quick take: if I need creator vetting, I want fraud checks and audience data. If I need campaign reporting, I want cross-platform data and exports. If I need owned-profile stats, native platform tools are enough.
Quick Comparison
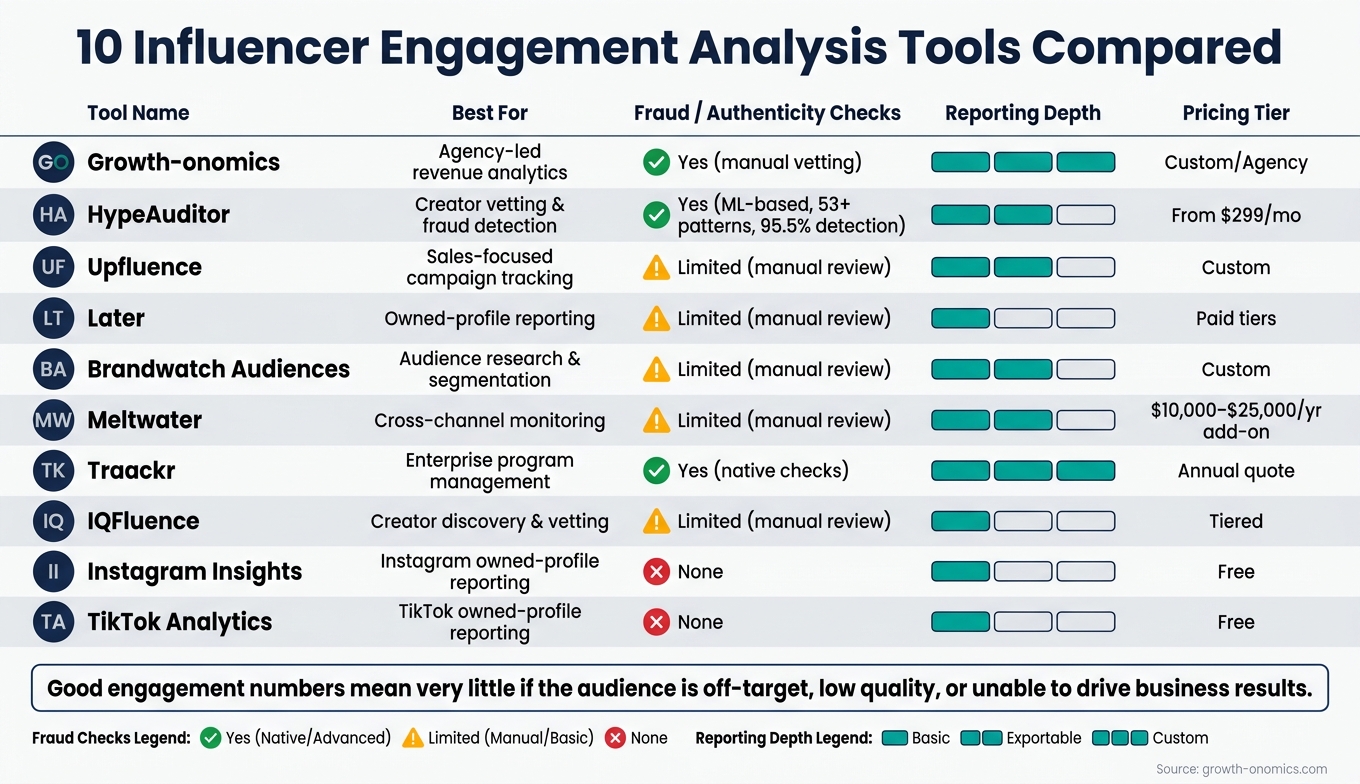
10 Influencer Engagement Analysis Tools Compared
| Tool | Best use | Main strength | Main limit |
|---|---|---|---|
| Growth-onomics | Revenue-linked analysis | Connects engagement to traffic, leads, and sales | Service-led, not simple self-serve software |
| HypeAuditor | Creator vetting | Strong fraud and audience checks | Starts at $299/month |
| Upfluence | Sales-focused campaigns | Tracks revenue, CPA, AOV, and creator sales | Fraud review is less strict than top vetting tools |
| Later | Owned-profile reporting | Good behavior and content-timing data | Not built for auditing creators |
| Brandwatch Audiences | Audience research | Deep audience segment and conversation data | Less focused on fake follower scoring |
| Meltwater | Cross-channel reporting | Mixes influencer data with listening and campaign views | Pricing is custom, often $10,000–$25,000/year for the influencer add-on |
| Traackr | Program management | Benchmarks, spend tracking, and cross-platform reporting | Annual quote-based pricing |
| IQFluence | Creator discovery | Audience breakdowns, overlap checks, and campaign metrics | Smaller platform scope than some large suites |
| Instagram Insights | Instagram reporting | First-party reach, saves, shares, and audience data | No fraud checks, Instagram only |
| TikTok Analytics | TikTok reporting | First-party watch time, completion rate, and traffic source data | No fraud checks, TikTok only |
If I had to boil the article down to one point, it’s this: good engagement numbers mean very little if the audience is off-target, low quality, or unable to drive business results.
sbb-itb-2ec70df
What To Look For In Influencer Engagement Analysis Tools
Not all tools give you the same level of detail. Some are broad but shallow. Others give you deeper data, but only if the creator connects their account. To sort through the noise, focus on four things: metrics, audience quality, access, and reporting.
Engagement Metrics Covered
At a minimum, the tool should track reach/impressions, watch time, completion rate, click-throughs, and engagement rate. Those numbers tell different parts of the story.
Watch time on TikTok or YouTube shows whether people stick around. Completion rate and click-throughs tell you if viewers took interest and acted on it.
It also helps if the tool shows both ER% and ERR%. Follower-based engagement is simple to compare across creators. Engagement by reach is often more dependable when the platform can pull first-party analytics from connected accounts. If a tool only shows one of these, you’re missing context, especially when algorithm-based reach swings a lot from one creator to another.
Audience Quality And Behavior Data
A high engagement rate doesn’t mean much if the audience isn’t real. Good tools surface follower authenticity scores, flag odd growth spikes, and show which locations, demographics, and content types drive engagement. For U.S. brands, a big share of overseas engagement can be a warning sign unless the creator has a clear global audience.
Fraud checks are only part of it. You should also look for demographic and behavior data, such as:
- Age
- Gender
- Location
- Language
- Audience interests
- Activity patterns
When available, state- or city-level location data can help U.S. brands confirm that the influencer’s audience lines up with the target market.
Cross-Platform Coverage And Access Limits
If your campaign runs across Instagram, TikTok, and YouTube, a tool that covers only one platform leaves gaps. The best options give you unified creator profiles that pull data from multiple channels, so you can compare total reach and engagement in one dashboard.
You should also check how the tool gets its data. Some rely only on public data. Those can show follower counts, likes, and comments, but they usually can’t provide solid reach, impressions, or audience demographic data. Tools that use authenticated account connections can unlock richer first-party data, which makes them better for deeper reporting. That gap matters when you compare the tools below.
Benchmarking, Fraud Checks, And Reporting
Engagement numbers need context. A tool is far more useful when it gives you category and tier benchmarks with U.S.-specific ranges and historical trendlines. For example, 2026 data shows Instagram nano influencers (1K–10K followers) usually land between 3.5–8% engagement, while macro influencers (1M+) average closer to 0.8–2%.[2]
On the fraud side, look for tools that flag anomalous growth patterns. A follower jump of more than 15% within seven days, without a viral post or press coverage, is a red flag[1]. It also helps when the tool reviews comment quality and checks whether engagement sources match the creator’s stated audience.
Add exportable reports and dashboards to the mix, and you have what you need to vet creators, back up spend decisions, and share results with stakeholders.
Use these filters to judge the tools below. That’s where the biggest differences show up.
1. Growth-onomics
Growth-onomics is an agency-led analytics service that links influencer activity to traffic, leads, and revenue. Instead of looking at likes and comments on their own, it connects creator performance to business results that U.S. brands can track. For growth-focused teams, that means engagement is tied to performance, not just surface-level numbers.
Engagement Metrics Tracked
Growth-onomics tracks engagement rate per post, saves, shares, link clicks, CTR, comment quality, profile visits, and on-site time from influencer traffic. It also breaks results out by content format, so brands can see if Reels, Stories, or TikTok videos are doing the heavy lifting in a given category.
It also normalizes results per 1,000 followers and per $100 spent. That makes creator comparisons a lot more useful, especially when one influencer has a big audience and another has a smaller but more active one.
Metrics mean more when they match audience fit and what people do after the click.
Audience Quality And Behavior Insights
Growth-onomics looks at audience quality through platform data, audience signals, and on-site behavior. It combines influencer data with customer journey data to show how referral traffic moves from discovery to purchase.
The analysis checks geographic alignment, demographic fit, and interest affinity to see whether an influencer’s audience lines up with a brand’s buyer personas. It also tracks post-click behavior like bounce rate, pages per session, and conversion rate. That helps separate creators who bring in high-intent traffic from those who mostly generate vanity engagement.
If people come back later through branded search after first seeing an influencer post, that can point to stronger brand recall and purchase intent.
Cross-Platform Coverage And Access Limits
When direct platform data isn’t available, Growth-onomics uses tracked campaign signals to close the gap. It usually covers Instagram, TikTok, YouTube, and Facebook, with X (Twitter) or Pinterest added based on where the brand’s audience spends time.
It uses official APIs and tracked links when access is limited. Metrics are then normalized across platforms, which gives brands a cleaner way to compare performance from one channel to another.
Benchmarking, Fraud Checks, And Reporting
Growth-onomics builds benchmarks by category, platform, format, and influencer tier, from nano to macro. That helps U.S. marketers judge whether results are strong for their niche instead of relying on broad averages that don’t say much.
On the fraud side, it flags:
- Sudden follower spikes
- Engagement that looks low for the size of the follower base
- Bot-like comment patterns
- Geographic mismatches between audience location and the brand’s target market
If an influencer shows several warning signs, they’re either removed from consideration or tested with a smaller budget first.
Reporting comes through custom scorecards that cover reach, clicks, conversions, revenue, CPA, funnel views, and scale recommendations.
2. HypeAuditor
HypeAuditor is an AI-powered influencer analytics platform built for audience authenticity and reach. It has a database of 227.3M+ creator accounts across Instagram, TikTok, YouTube, Twitch, X (Twitter), and Snapchat. For U.S. marketing teams, that means a more structured way to vet creators before putting ad dollars on the line.[14][16] It works best when the big question is simple: Is this creator’s audience real enough to justify the spend?
Engagement Metrics Tracked
For engagement analysis, HypeAuditor’s main strength is telling apart real interaction and pumped-up activity. It tracks engagement quality, not just raw volume.
It looks at comment authenticity, flagging generic or emoji-only comments as low quality while treating longer, context-rich comments as real engagement.[5][4] It also monitors the like-to-comment ratio and engagement consistency over time. That helps teams spot suspicious spikes that may point to inflated activity, versus steadier organic performance.[5][8]
Audience Quality And Behavior Insights
One of its main scoring tools is the proprietary Audience Quality Score (AQS), which rolls up multiple signals – engagement authenticity, follower growth patterns, and audience composition – into a single 1–100 index.[4][5][11]
Teams often use AQS as a first-pass filter. For example, a U.S. ecommerce brand might create an internal rule to only work with influencers scoring above 70–80, or pay higher CPMs to creators above 85.[7][10] That kind of score doesn’t make the whole decision for you, but it does give teams a quick read before they dig deeper.
HypeAuditor also shows audience geography and demographics. So if a brand is running a U.S.-only campaign, it can check right away whether a creator’s followers are concentrated in the United States or whether a large portion sits overseas.[7][9]
Benchmarking, Fraud Detection, And Reporting Depth
For final screening, HypeAuditor adds fraud detection and deeper reporting. Fraud detection is one of its core features. Its model uses 53+ behavioral patterns to identify suspicious followers, bought likes, engagement pods, and unnatural follower spikes.[6][13]
HypeAuditor says it detects 95.5% of known fraudulent activity with a mean error rate of 0.73%.[13] On the reporting side, the platform includes 35+ metrics per creator report, industry benchmarks by follower tier, side-by-side creator comparisons, and historical trend graphs. In practice, that gives teams metrics, authenticity checks, and benchmark data in one place when they’re making final creator calls.[14][12]
Plans start at $299/month.[15]
3. Upfluence
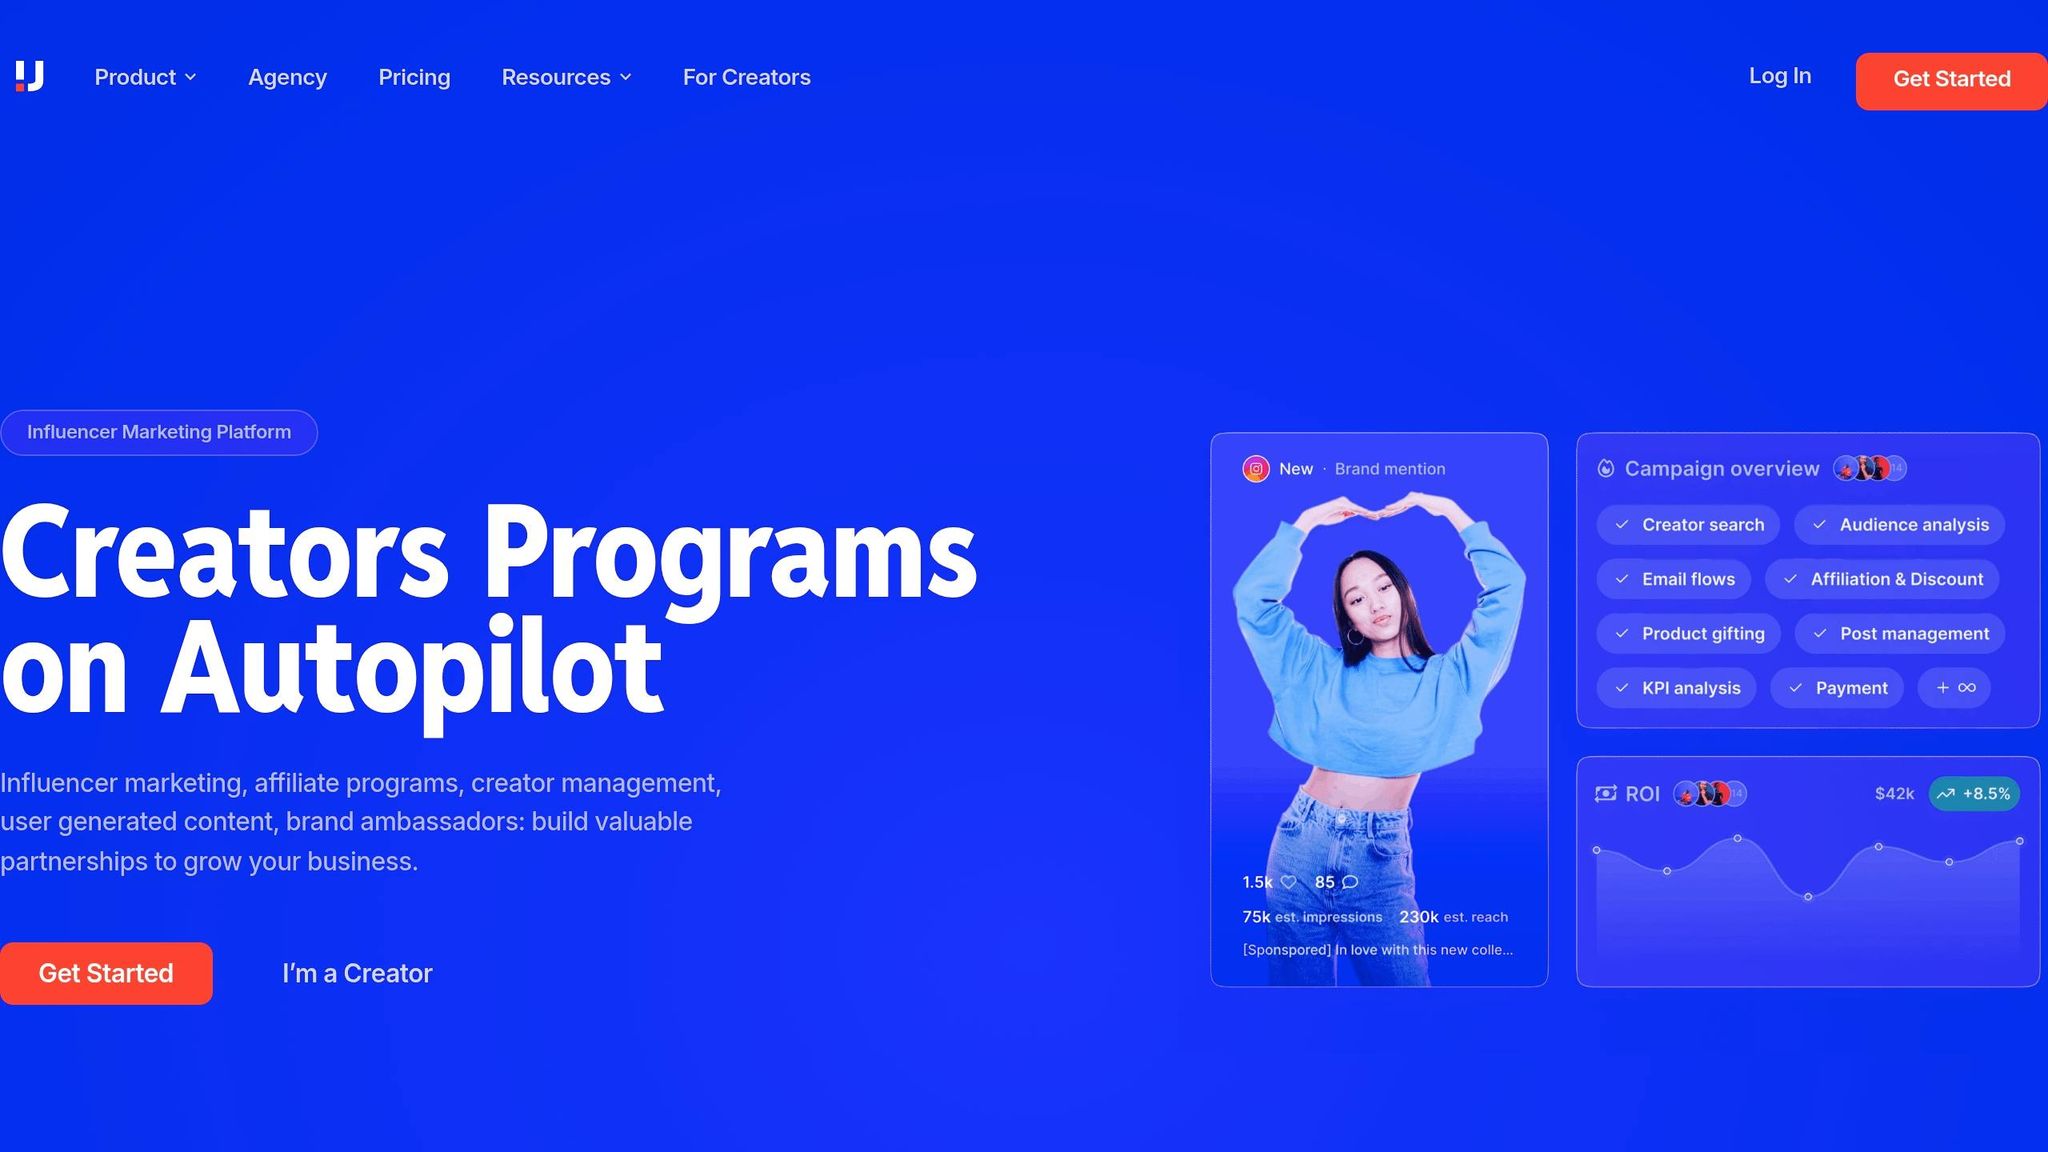
Upfluence is at its best when you need to connect engagement data to sales. It’s built for teams that don’t just want to see likes and comments – they want to know what happened after the post went live. In plain terms, it helps trace creator performance from post to purchase.
Engagement Metrics Tracked
Upfluence tracks post performance all the way from engagement to revenue. The main metrics include CTR, conversion rate, CPA, average order value (AOV), revenue generated per creator, Cost Per Engagement (CPE), effectiveness rate, and saturation rate.[24][26][17][28]
Two metrics stand out here.
The effectiveness rate shows how affiliate or branded content performs compared with a creator’s organic posts. That matters because a creator can have strong engagement in general, but branded content may land very differently.
The saturation rate shows what share of a creator’s posts mention brands. If that number gets too high, it can point to audience fatigue.[17]
Audience Quality And Behavior Insights
Upfluence also looks at audience quality, not just size. It estimates the share of real engaged followers for each creator and adds a confidence indicator based on sample size. A green mark signals high confidence.[17]
On top of that, the platform gives demographic breakdowns for age, gender, location, and interests. That helps brands check whether a creator’s audience lines up with the market they want to reach.[25][26][27]
Cross-Platform Coverage And Profile Access
Upfluence supports influencer discovery and analytics across Instagram, TikTok, YouTube, Twitch, Pinterest, X (Twitter), Facebook, and blogs.[30][31][3][32][33]
It also offers a free Chrome plugin that shows key metrics right on creator profile pages. That includes fake follower percentage, engagement rate, audience growth, and demographic breakdowns. For teams doing fast creator reviews, that can save a lot of time.[27][3]
Benchmarking, Fraud Detection, And Reporting Depth
For fraud checks, Upfluence analyzes follower location, growth patterns, engagement quality, and story performance to estimate the share of fake versus real followers.[18]
A U.S. brand screening creators might set an automatic cutoff for accounts with less than 80–85% real followers before moving to manual review.[17][18][20][21] That kind of filter helps trim risk early instead of wasting time on weak candidates.
For benchmarking, teams can compare creators of different sizes on a like-for-like basis with standardized engagement rate percentages.[3][17][21][22] That makes comparisons cleaner. A large creator and a smaller niche creator won’t look the same on raw numbers, so percentage-based views help level the field.
Dashboards also track earned media value, audience reach, and media engagement over time. That gives teams a clearer way to compare current campaigns against past results.[19][22][23]
4. Later
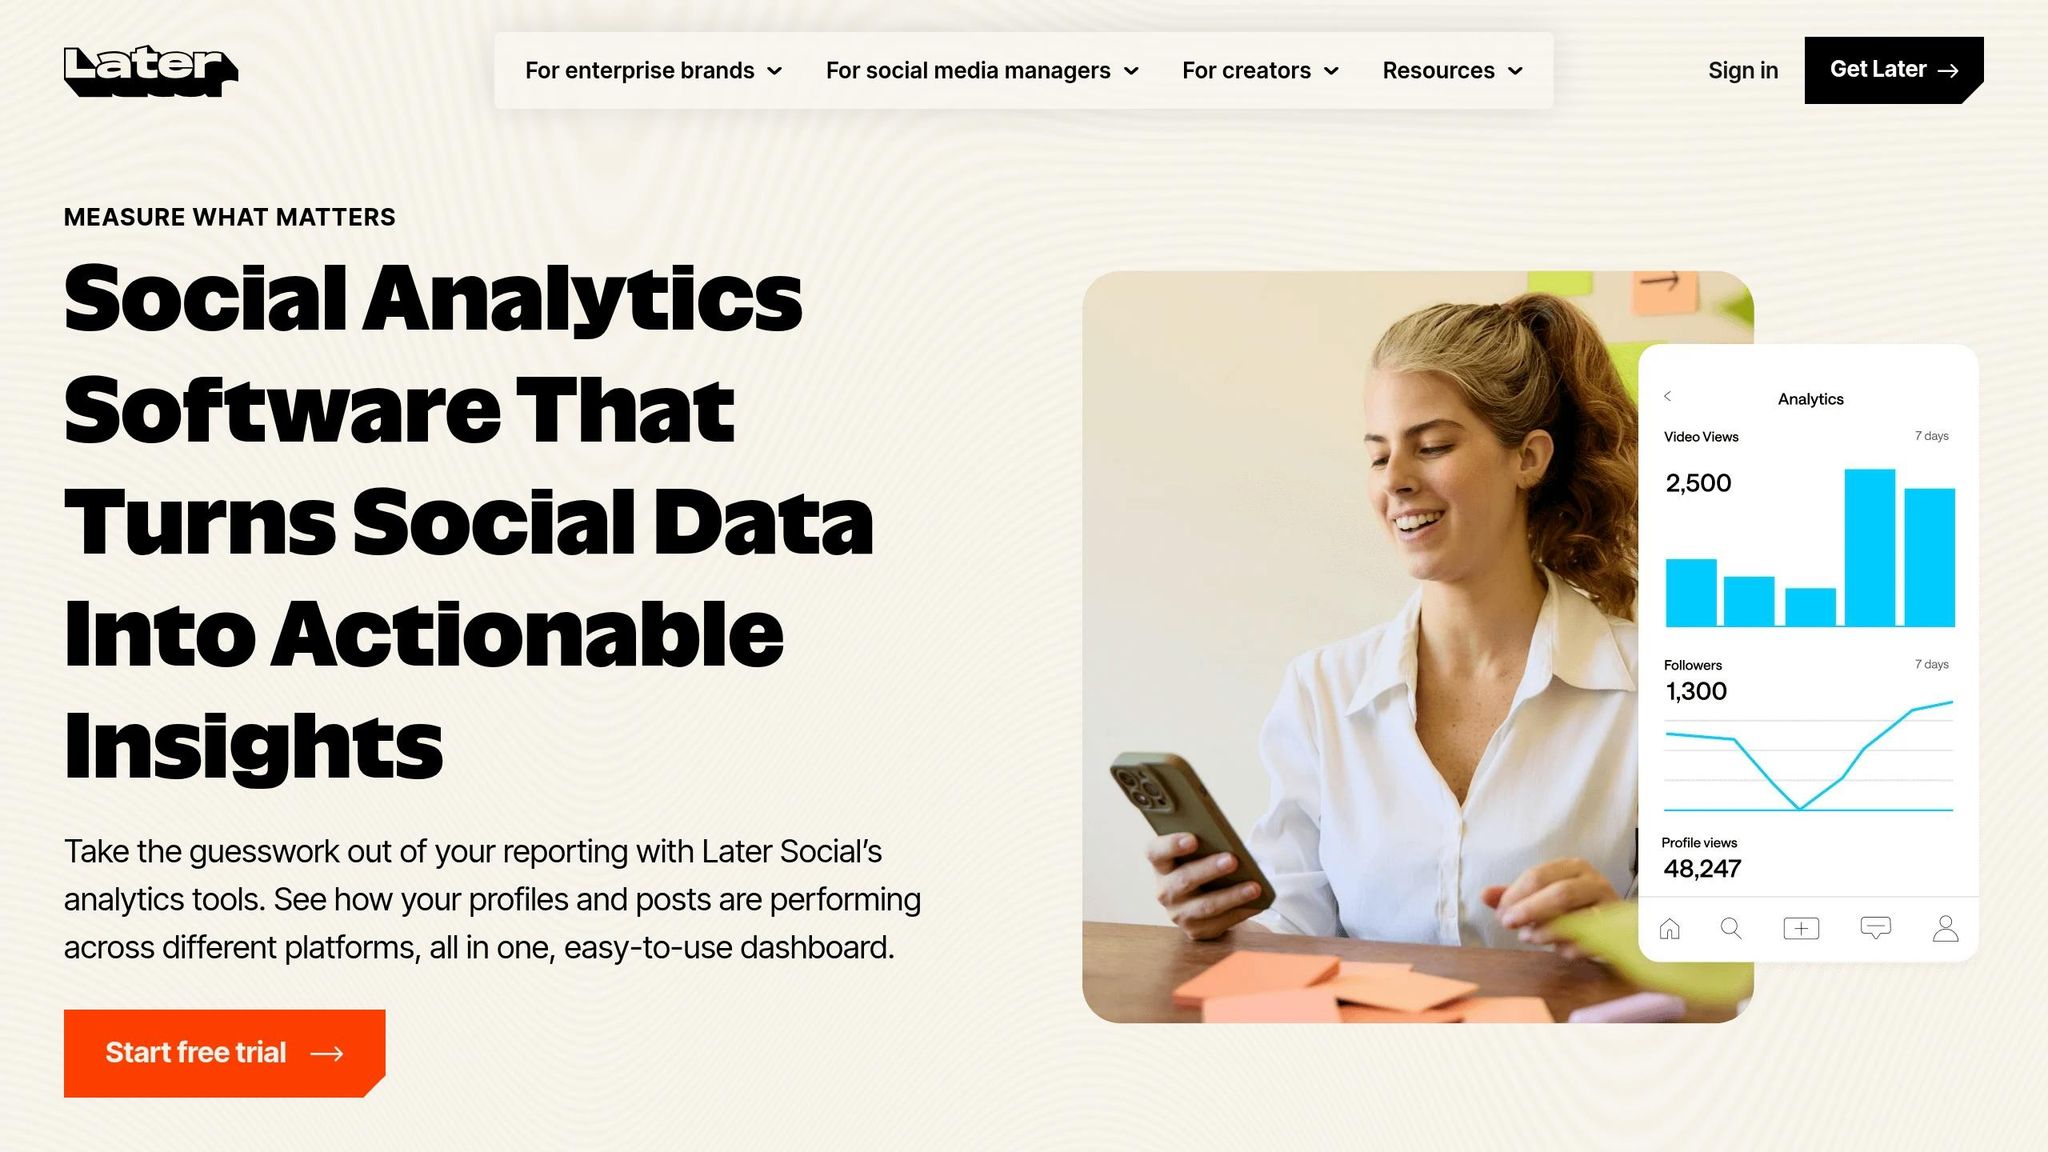
Later is a social media analytics tool built to track engagement on owned profiles across Instagram, TikTok, Pinterest, Facebook, Threads, Snapchat, and X.[44][47][51] In plain English, it’s stronger for campaign reporting and audience behavior than for checking creators before you work with them.
Engagement Metrics Tracked
Later tracks video-level metrics like views, average watch time, and completion rate for Reels and TikToks. That helps brands see if creator video content is actually keeping people watching.[44]
It also uses network-specific engagement formulas, so comparing results across platforms takes some care.[45] A strong engagement rate on one platform may not mean the same thing on another. These numbers make the most sense when you look at them alongside posting time and content format.
Audience Quality And Behavior Insights
Later does not include fraud detection or fake-follower scoring. Where it stands out is behavior data: which formats lead to saves and shares, which hashtags help reach, and when audiences are most active.[46][48]
Its Best Time to Post feature uses past engagement patterns to suggest better posting windows. That gives brands clear guidance they can share with creators, instead of just handing over raw numbers.
Cross-Platform Or Profile Access Scope
Later reads owned profiles, not creator accounts. For influencer campaigns, brands need to rely on UTM-tagged links and Link in Bio analytics to track clicks and traffic.[48][50]
That limit matters. If you want to audit a creator directly, Later isn’t the tool for that. If you want to report on how your own accounts performed during a campaign, it fits the job much better.
Benchmarking, Fraud Detection, And Reporting Depth
Later supports benchmarking by time period and content type, but it’s weak for direct creator-to-creator comparison.[34][35][36][38] So if your team wants to stack one influencer against another, you’ll likely need a different platform.
For reporting, though, Later is easier to work with. It turns behavior data into shareable dashboards and exports. Higher-tier plans add custom analytics, 2 years of history, CSV exports, and shareable reports.[39][40][41][42][43]
Later Influence’s campaign reports also pull key numbers into one dashboard, including Earned Media Value (EMV), total impressions, engagement rate, influencer counts, and content counts.[37][49] That makes internal reporting a lot simpler, especially when a marketing team needs to show results without digging through several tools.
5. Brandwatch Audiences
Brandwatch Audiences starts with the audience, not the creator profile. That matters when audience fit is more important than big creator numbers.
Engagement Metrics Tracked
Brandwatch tracks likes, comments, shares, reactions, video plays, link clicks, and engagement rate across recent posts. It looks at the last two months and up to about 500 posts, so the data is tied to what’s happening now – not what worked six months ago.[52][55][58]
That makes Brandwatch more useful for audience-fit work than tools that lean too hard on simple creator scoring.
Audience Quality And Behavior Data
Marketers can build very specific audience segments. For example, you can look at X users who follow a set of fitness accounts and mention terms like meal prep or workout plan. From there, Brandwatch shows what those people talk about and what they share.[57][53]
It also surfaces top hashtags and posts inside that segment. That can help brands brief creators with messaging that lines up better with what the audience already cares about.[57][53]
Brandwatch’s Influence Graph adds another layer here by scoring more than 200 million active X users based on how often they engage and how often others engage with them.[57][60] In plain English, it helps separate people who actually move conversation from accounts that just look big on paper.
Cross-Platform Coverage And Access Limits
Its strongest audience signals are on X. Brandwatch also connects with Brandwatch Analytics, which means audience lists can feed into deeper social listening, sentiment analysis, and conversation tracking across connected networks.[57][60]
Marketers can also export audience lists to X ad tools for retargeting and creative testing.[57][60]
Brandwatch’s Social Panels push audience research past X by adding Reddit and other forums. That gives brands a broader, multi-source look at what target communities are talking about.[62][63]
Benchmarking, Fraud Checks, And Reporting
Brandwatch benchmarks a target audience’s conversations against broader X activity. It uses machine learning to surface the topics, entities, influencers, sites, hashtags, and emojis that are more closely tied to that group.[60][56]
Campaign reports track:
- Reach
- Impressions
- Engagements
- Follower growth
- Conversions
That makes it easier to compare influencers over time and spot the difference between steady performance and a short spike.[54][56][61]
Brandwatch does not put much weight on explicit fake-follower audits or comment-authenticity scoring in its public docs.[52][56][59] Still, weak audience quality can show up in other ways: low engagement compared with follower count, odd audience growth patterns, or weak interaction networks.
Use Brandwatch when you need deep audience analysis. Then pair it with a tool that does stronger fraud checks when creator trust is the main concern.[58][61]
6. Meltwater
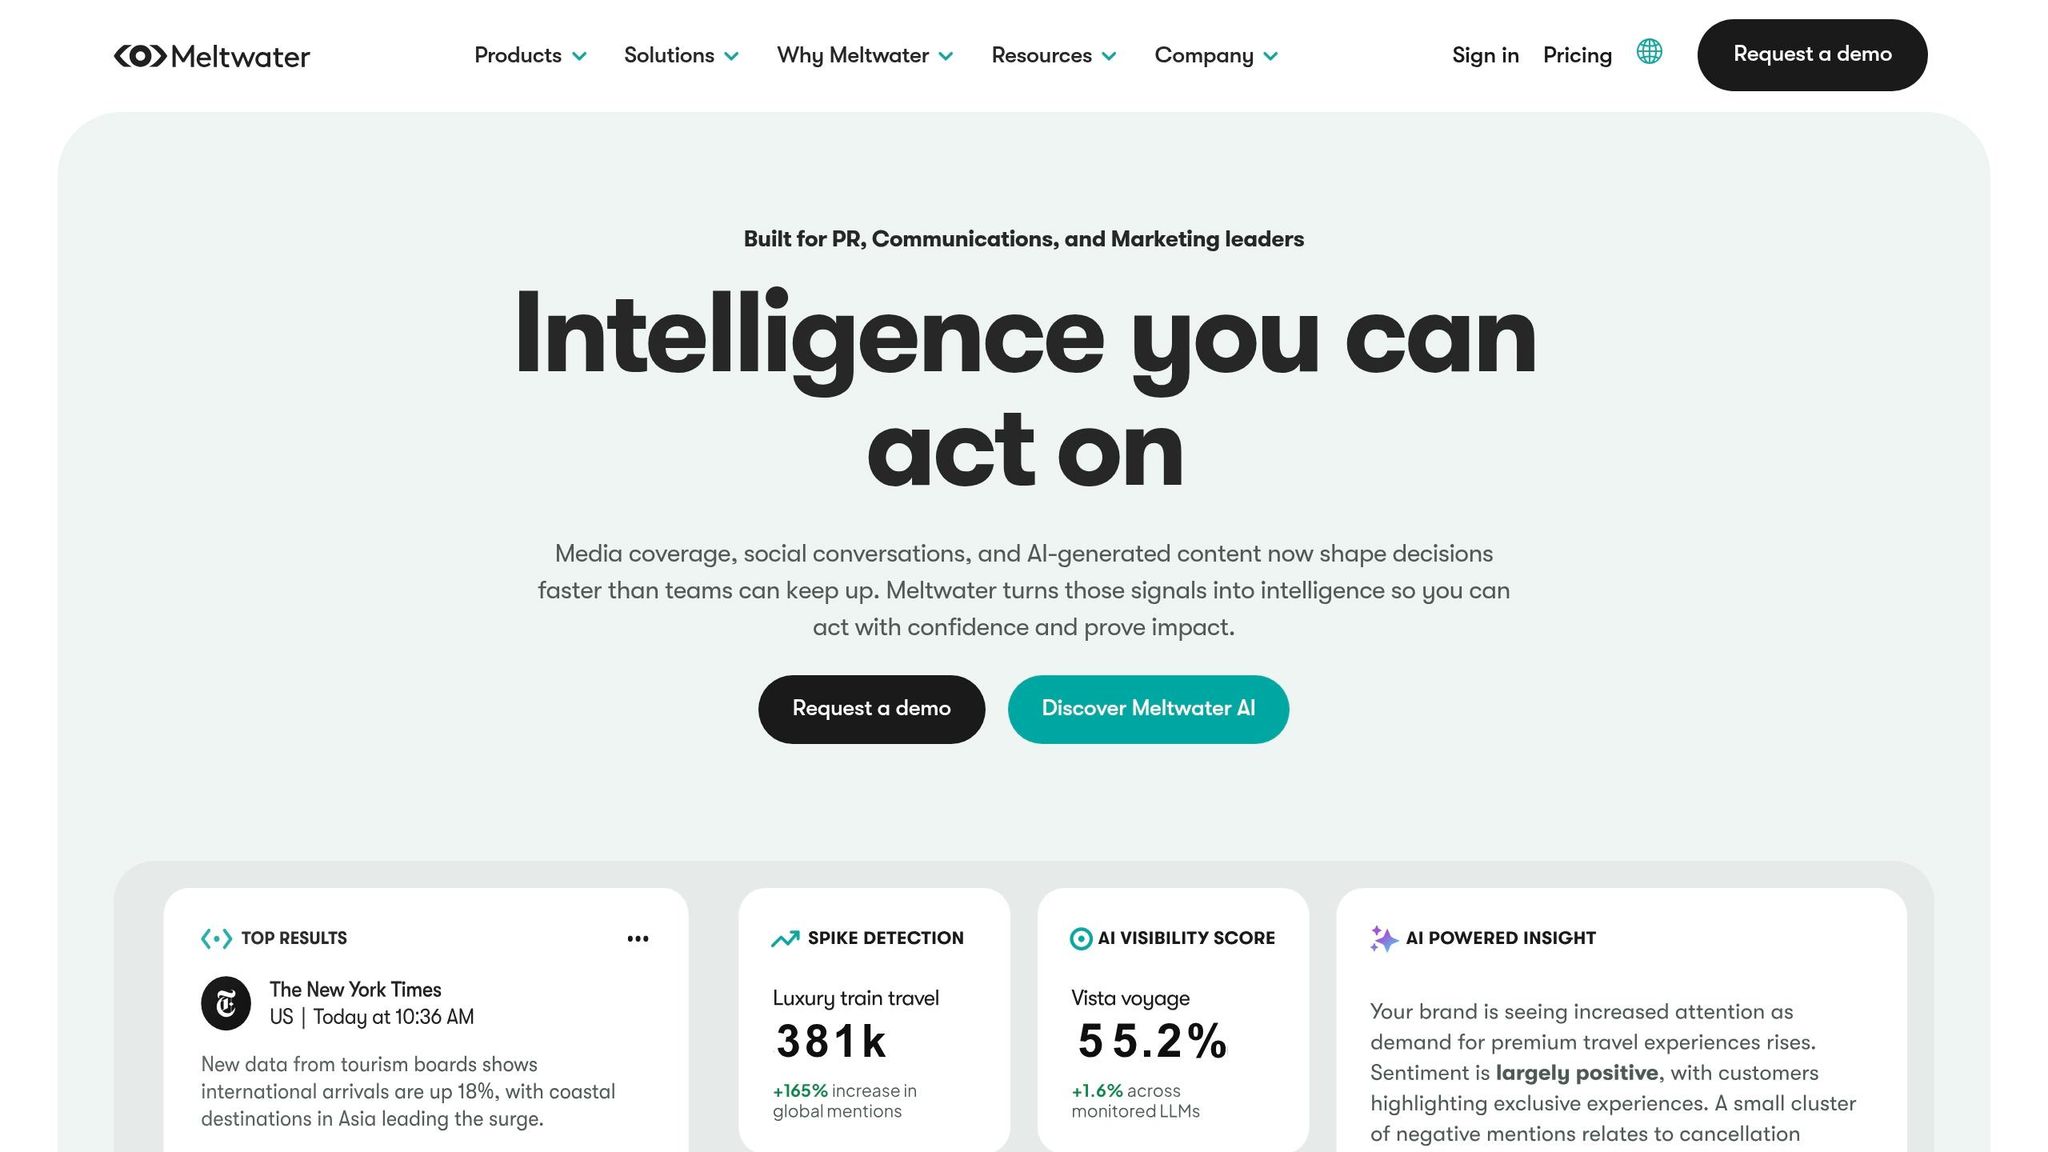
When you want audience fit and campaign results in one place, Meltwater does both. It combines influencer analytics with social listening, so you can go from audience research to campaign measurement without bouncing between tools.
Engagement Metrics Tracked
Meltwater tracks engagements, engagement rate, reach, impressions, views, clicks, conversions, sales, Earned Media Value (EMV), and Social ROI. It also includes True Reach, which estimates how many actual people likely saw the content.
For U.S. marketers, that matters a lot. Two creators can look similar on paper, but their actual visibility may be very different.
Audience Quality And Behavior Insights
Meltwater surfaces audience demographics, locations, interests, affinities, and shopping habits. That makes it useful for checking whether a creator’s audience lines up with your target regions, age groups, and interest areas.
It also shows the topics, hashtags, and keyphrases that connect most with a given audience. That can help shape creative briefs and tighten up messaging.[67][71]
Cross-Platform Or Profile Access Scope
Meltwater pulls performance data from Instagram, TikTok, YouTube, Facebook, LinkedIn, and X into unified campaign dashboards.[64][65][68][69][70] Instagram Story taps and saves need connected profiles.[66]
Benchmarking, Fraud Detection, And Reporting Depth
Meltwater’s benchmarking feature lets teams compare up to 10 accounts at once across Facebook, Instagram, and X. You can track engagement rate trends, follower growth, and page performance against a benchmark average.[72]
Its campaign dashboards also break results down by influencer, channel, and individual post. So if one creator is doing the heavy lifting, you’ll see it fast.[65][68][69]
On fraud checks, Meltwater doesn’t publish direct fake-follower scores. Still, its mix of True Reach, engagement rate benchmarks, and audience location data can help spot accounts that look off.[65][69][71] If your team needs a stricter fraud check, the practical move is to pair Meltwater’s audience and performance data with a separate vetting step.
Pricing is custom and quote-based. The influencer module usually runs $10,000–$25,000 per year as an add-on to the base platform subscription.[73][74][75][76]
7. Traackr
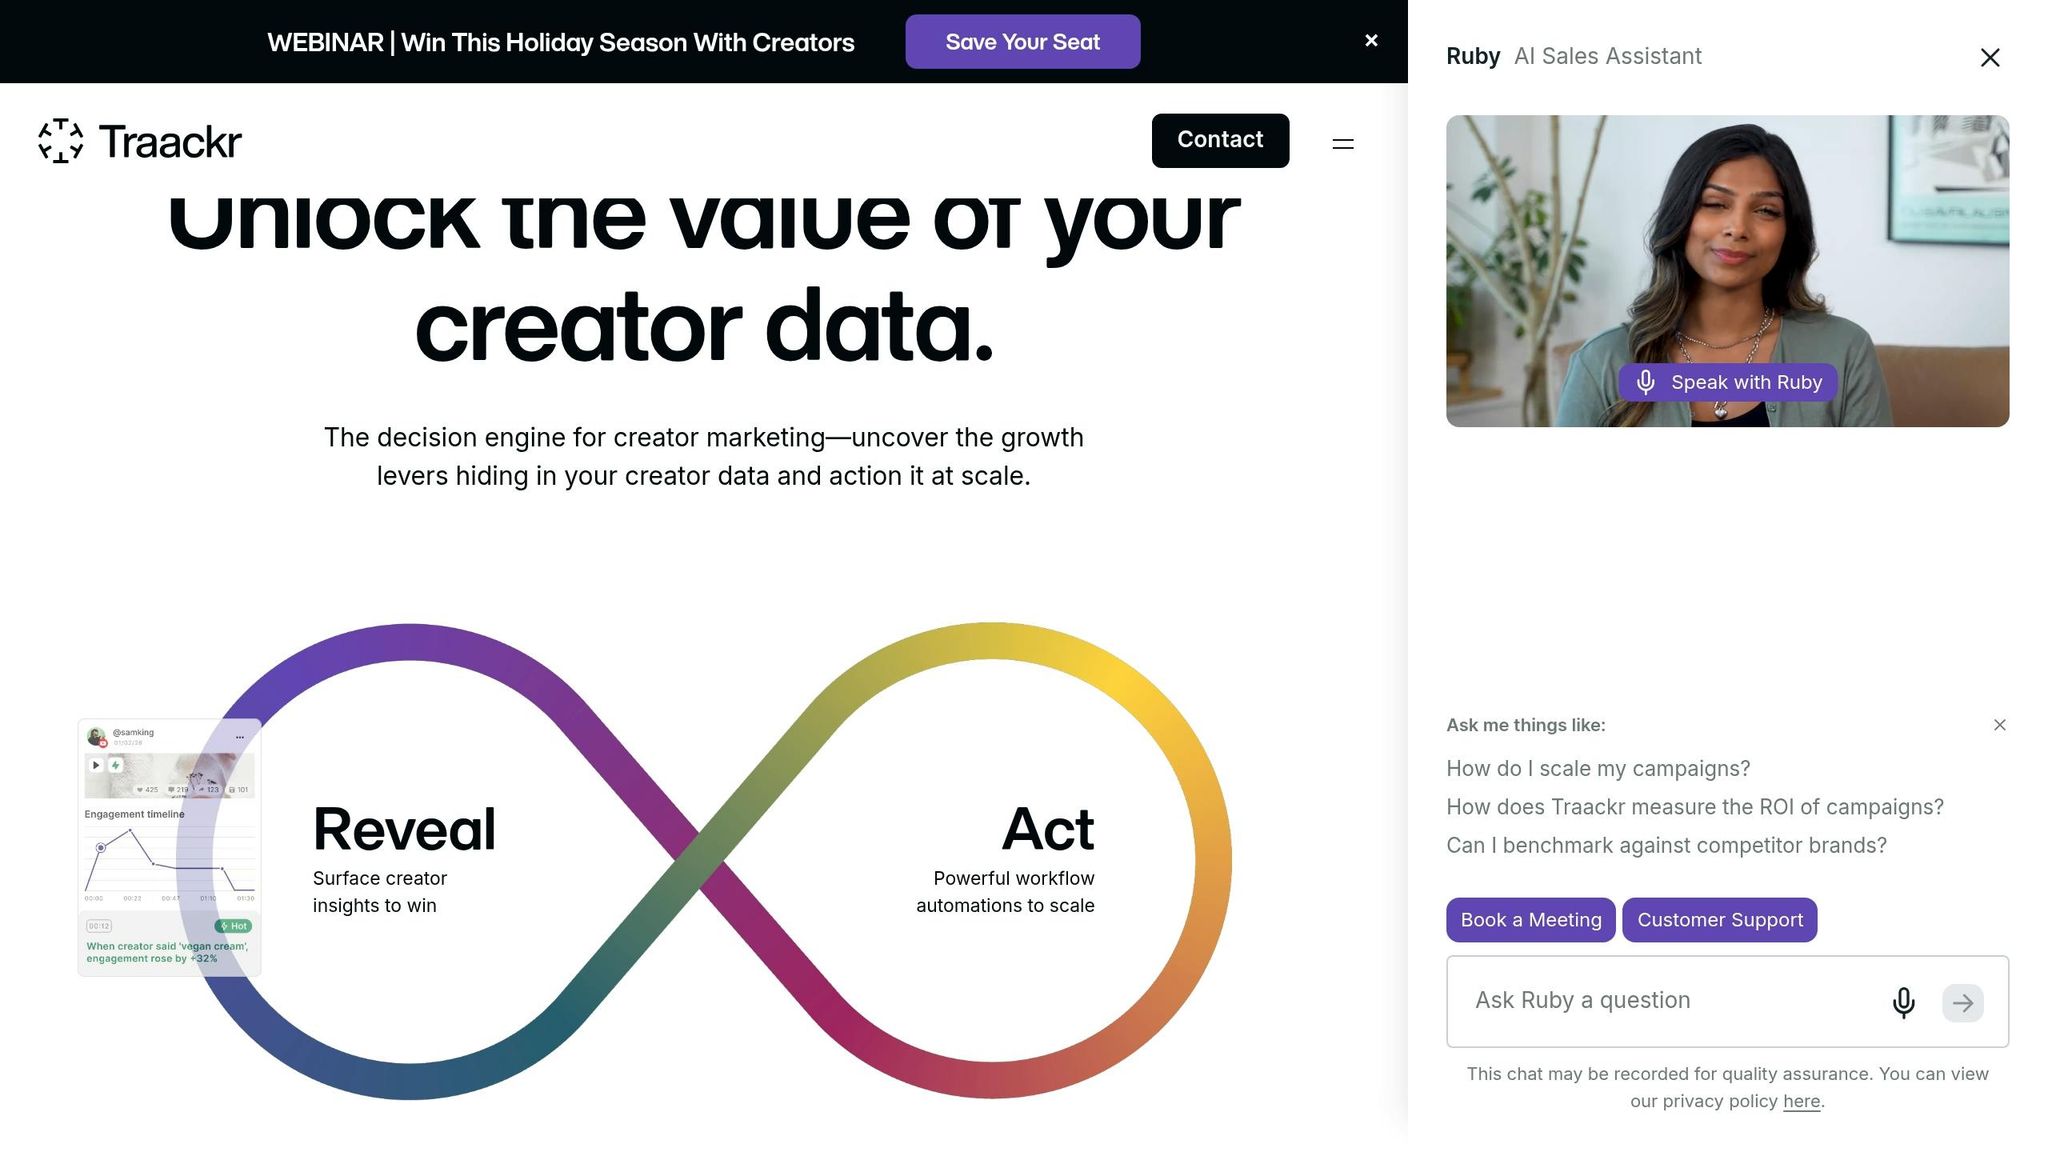
Traackr pulls influencer performance data into one place across Instagram, TikTok, YouTube, Facebook, and X. It also connects that data to campaign and budget numbers. So if your team cares about benchmark-led reporting and clear budget tracking, Traackr brings a stronger performance view.
Engagement Metrics Tracked
Traackr tracks total engagements, including likes, comments, shares, and saves, along with engagement rate, video views, video view rate, reach, and impressions.[78][82][84][85]
Its standout metric is the Brand Vitality Score (VIT). VIT combines reach, weighted engagement, and brand relevance into a single score.[77][81][83] That gives teams a simpler way to look at brand impact instead of staring only at raw engagement totals.
Audience Quality And Behavior Data
Traackr also flags suspicious follower growth, engagement spikes, and fraud signals so teams can judge whether a creator’s audience activity looks organic.[87] In plain terms, it helps sort genuine engagement from numbers that look padded.
Cross-Platform Coverage And Access Limits
Because Traackr relies on first-party creator data and official platform partnerships, it can show more reliable, real-time metrics for authorized profiles.[80] That matters when you’re trying to make budget calls without second-guessing the data.
The platform also makes cross-platform comparison easier. Brands can look at the same creator on TikTok and Instagram Reels, for example, and see where that creator performs best before putting money behind a campaign.[80][84][86]
Benchmarking, Fraud Checks, And Reporting
This is where Traackr starts to stand out. It brings performance, cost, and peer comparison into the same view.
Its Influencer Market Benchmark (IMB) lets teams compare VIT and engagement metrics against category peers and competitors.[77][81][83] On the reporting side, unified campaign reporting tracks:
- Total mentions
- Engagements
- Reach
- Impressions
- Cost per engagement
- Cost per 1,000 impressions
These reporting views can be filtered by creator, platform, market, or campaign, which makes it easier to spot which partners and formats are doing the best work.[78][79][80][82][84] Teams can then break results down further by creator, platform, market, or campaign to see where spend is paying off.[79][81][84]
Advanced fraud checks still need manual review.[85][87]
Pricing is annual and quote-based, and Traackr does not offer a free plan.[88][89]
8. IQFluence
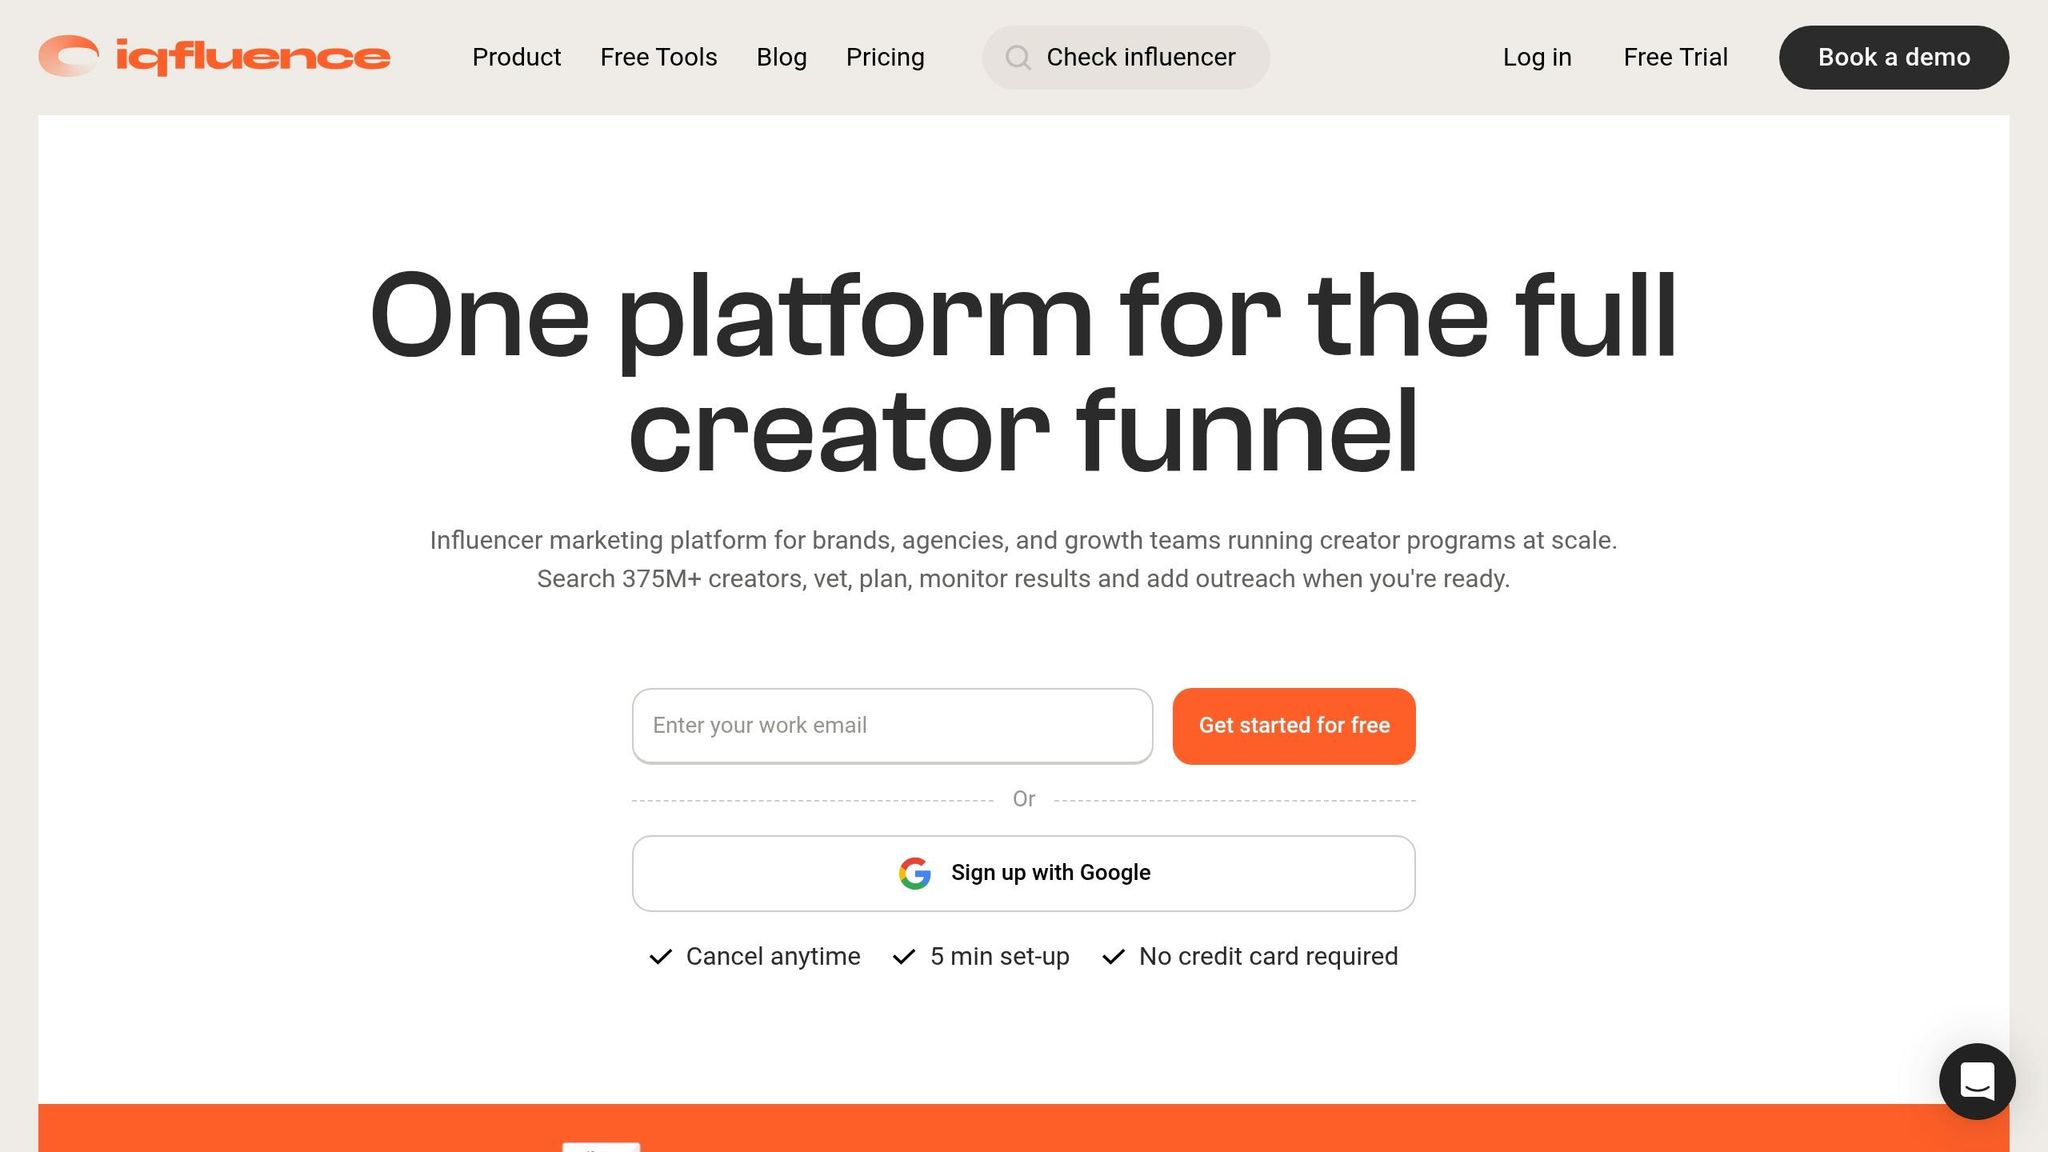
IQFluence is an influencer analytics platform built for creator vetting and campaign tracking. It supports Instagram, TikTok, and YouTube, and it indexes 375M+ creator profiles across those networks.[90][97][98] It’s a strong fit when you need to screen creators, check audience quality, and spot overlap before putting more budget behind a campaign.
Engagement Metrics Tracked
IQFluence pulls data from each creator’s last 30 posts through its API. From there, it surfaces metrics like engagement rate, average views per post or video, likes, comments, saves, and audience visibility rate.[94][95][97]
That matters because a smaller creator with higher engagement can show more buying intent than a bigger account with weaker interaction.[92][91] In plain English: follower count alone doesn’t tell the whole story.
Audience Quality And Behavior Insights
IQFluence shows audience age and gender split, top countries, languages, Instagram city-level location data, and audience visibility rate.[94][29] It also sorts audiences into groups like real people, mass-follower accounts, influencers, and suspicious accounts.
For a U.S. brand, that’s useful fast. You can filter out creators whose audience doesn’t line up with your target market or whose follower base looks inflated. The platform also flags suspicious accounts and shows audience overlap across 2–9 creators.[94][29][97][98] Those checks can shape campaign reports and spending calls right away.
Cross-Platform Coverage And Access Scope
IQFluence gives teams a single workspace to compare creators across TikTok, YouTube, and Instagram.[90][91] That makes side-by-side review much easier. You don’t have to jump between tools or deal with extra exports just to see how one creator stacks up against another.
Benchmarking, Fraud Checks, And Reporting
Its campaign dashboards track CPA, CPE, CTR, CPC, and CPM in live reporting views.[95][97] If your team already has its own analytics setup, IQFluence also offers a REST API. You can use it to send engagement metrics, audience demographics, and fake-follower data into custom dashboards.[95]
Pricing is tiered based on reports, exports, and the number of tracked influencers.[93][96]
9. Instagram Insights
For Instagram-only campaigns, Instagram Insights is the main first-party source for performance data. It’s Instagram’s built-in analytics dashboard for Business and Creator accounts, available in the app and on instagram.com through the Professional dashboard.[108] Use it for fast checks on owned profiles or when creators send screenshots.
Engagement Metrics Tracked
For each post, Instagram Insights shows reach, impressions or views, and core engagement actions like likes, comments, saves, and shares or sends.[100][101][102] Reach tells you how many unique accounts saw the content. Impressions and views show total displays or plays.[100][101][102]
A simple engagement rate formula works well here: divide total interactions by reach, then multiply by 100.[102][103]
Don’t stop at likes. Saves and sends per reach often say more about how strong a post is and how far it may spread.[100][102] A like is easy. A save means, “I want this later.” A send means, “You need to see this.”
Audience Quality And Behavior Insights
Instagram Insights also breaks down reached audiences by country, city, age range, and gender, and it separates followers from non-followers.[99][105] Because the data is based on reached accounts, it’s useful for checking U.S. audience fit. You can also see when followers are most active, which helps with timing sponsored posts for better visibility.[100][101]
There’s one catch: demographic data only appears when the account has reached more than 100 accounts in the selected time range.[99] If the last 7 days look thin, switch to a longer window like 30 or 90 days.[99]
That makes the tool handy for a quick creator-fit check before reporting starts.
Cross-Platform Or Profile Access Scope
Instagram Insights is tied to a single profile and only covers Instagram performance.[99][100][102] If a brand wants the data, the creator usually needs to share screenshots or screen recordings showing reach, accounts engaged, and audience demographics.[104][106]
It helps to ask for the same items from everyone upfront, such as:
- Screenshots from the last 30 days
- Engagement breakdowns
- Top locations
That keeps side-by-side creator comparisons much cleaner.[104]
Benchmarking, Fraud Detection, And Reporting Depth
Instagram Insights doesn’t include fraud detection, fake follower scoring, bot flagging, or built-in industry benchmarks.[100][102][107] So if you’re hoping it will tell you whether an audience looks suspicious, it won’t.
What it does give you is direct post-level reporting: time filters like the last 7, 14, 30, or 90 days, post-by-post breakdowns, and top content by format across posts, Reels, Stories, and Lives.[100][101]
Use it as the native Instagram source for post-level reporting and quick audience snapshots.
10. TikTok Analytics
TikTok Analytics is TikTok’s free, built-in analytics suite for Creator and Business accounts. You can open it in TikTok Studio or Creator Tools. Since the data sits inside the account owner’s profile, brands usually have to ask creators for screenshots or exports to review results. So in practice, it works best for checking owned accounts and for creator-shared reporting.
Engagement Metrics Tracked
The main metrics here are video views, profile views, likes, comments, shares, saves, follower growth, average watch time, and video completion rate.[119][109][124]
For a simple post-level engagement rate, use this formula: (likes + comments + shares) ÷ views × 100.[109][110][116]
Median TikTok Business engagement is about 3.70%.[116][118] Smaller accounts tend to post higher engagement rates, while accounts with 1M+ followers usually trend lower.[116][118] That’s why it helps to compare a creator’s average engagement against the right category median, not just against a random account.
Audience Quality And Behavior Insights
Before you judge performance, check whether the audience is even the right fit. The audience tab shows follower breakdowns by top countries, gender, and active hours. It also shows per-video traffic sources, including For You feed, Following, Profile, and Sound.[111][113][115][117]
For U.S.-focused campaigns, look closely at whether the creator’s top audience country leans toward the United States. Then match posting times to the hours when U.S. followers are most active.[111][113][115] Traffic source data adds another useful layer because it shows whether discovery came from For You or from Profile.[111][113][115][117]
Native analytics won’t directly label fake followers. Still, some patterns can hint at trouble. High view counts with weak interaction, or an audience mix that doesn’t match the target market, can be warning signs.[109][110][112][114][117]
Cross-Platform Coverage And Access Limits
TikTok Analytics covers TikTok only. There’s no cross-platform view, and full data is only available for accounts you own.[113][115][117]
The date ranges are usually limited to 7, 28, or 60 days, so campaign reporting has to line up with those windows or depend on exported data.[111][113][115] If you need data from creators outside your own account, ask for screenshots or exports from the Overview, Content, and Followers/Audience tabs.[111][113][114][115][117]
That setup is a bit clunky, but it explains where TikTok Analytics fits best: owned-account checks and creator-shared reporting.
Benchmarking, Fraud Checks, And Reporting
Native TikTok Analytics doesn’t include fraud detection, fake follower scoring, or competitor benchmarking.[121][122][123][125] What it does give you is accurate, real-time post-level data straight from TikTok’s own systems, including views, watch time, engagement, and audience behavior.[119][115][120][124]
That makes it the main source for reviewing each creator’s TikTok results. Use those numbers as the baseline for owned-account reporting. That also makes TikTok Analytics the baseline for the comparison snapshot that follows.
Quick Comparison Snapshot
This snapshot gives you a fast way to compare the tools by the four factors that matter most: use case, audience data, fraud checks, and reporting depth. Those same four factors should guide your review of every option. The table below pulls the main differences into one place.
| Tool | Best For | Platforms Covered | Audience Insights | Fraud/Authenticity Checks | Reporting Depth |
|---|---|---|---|---|---|
| Growth-onomics | Agency-led analytics and custom reporting | Managed multi-platform analysis | Geographic, demographic, and post-click behavior | Yes – manual vetting | Custom client reporting |
| Meltwater | Cross-channel monitoring and reporting | Multi-platform | Audience data and benchmarking | Limited – manual review needed | Exportable reports |
| Traackr | Enterprise influencer program management | Multi-platform | Audience authenticity and historical performance | Yes – native authenticity checks | Program-level, custom reporting |
| HypeAuditor | Creator vetting and fraud detection | Instagram, YouTube, TikTok, Twitch, X | Demographics, authenticity, and engagement patterns | Yes – ML-based checks | Exportable reports |
| Upfluence | Influencer campaign management | Instagram, TikTok, YouTube, Facebook, X, Pinterest | Age, gender, location, interests | Limited – manual review needed | Exportable reports |
| Later | Owned-profile campaign tracking | Multi-platform | Audience behavior and engagement patterns | Limited – manual review needed | Basic native dashboards |
| Brandwatch Audiences | Audience research and segmentation | Multi-platform | Interests, behaviors, and audience segments | Limited – manual review needed | Exportable reports |
| IQFluence | Influencer discovery and audience analysis | Multi-platform | Audience composition and engagement data | Limited – manual review needed | Basic native dashboards |
| Instagram Insights | Instagram-owned profile reporting | Instagram only | Age, gender, location, active hours | No native fraud checks | Basic native dashboards |
| TikTok Analytics | TikTok-owned profile reporting | TikTok only | Age, gender, location, active hours | No native fraud checks | Basic native dashboards |
HypeAuditor and Traackr stand out most for authenticity checks. By contrast, native tools don’t include any fraud layer.
How To Match The Right Tool To Your Campaign Goals
Pick your tool based on the job it needs to do, not a long feature list. The point is simple: match the platform to the problem in front of you.
For Brands That Need Guidance And Custom Reporting
If you need help making sense of performance, start here.
Use Growth-onomics when you want custom reporting tied to revenue, traffic, and conversion outcomes.
For Creator Vetting And Audience Authenticity Checks
If trust is the main concern, start here.
Use HypeAuditor for authenticity checks and Brandwatch Audiences to validate audience fit.
For Ongoing Campaign And Program Tracking
If your campaign is already live, start here.
Use Upfluence for revenue-linked tracking, Later for owned-profile trend reporting, Meltwater for listening and measurement, and Traackr for benchmarked program management.
For Owned Profile Performance
If you only need data from accounts you own, start here.
Use Instagram Insights and TikTok Analytics for owned accounts. Move to third-party tools when you need cross-creator comparison or revenue attribution.
Conclusion
Once you’ve compared the metrics, audience data, and level of reporting, the final step is simple: match the tool to the decision in front of you. Pick based on the job to be done – creator vetting, audience insight, cross-platform reporting, or long-term performance tracking.
Follower count should stay in the background. What matters more is engagement quality, audience location, and fraud risk. That context matters because even the best engagement numbers don’t mean much if they can’t support business reporting.
For U.S. campaigns, report results in the numbers stakeholders already care about:
- cost per engagement
- cost per click
- cost per acquisition
- revenue or pipeline contribution
It also helps to choose tools that make it easy to split out U.S. audience data from global data and export results into CSVs, BI tools, or slide-ready charts.
When deeper attribution is the goal, raw engagement data won’t carry the whole load. Software can handle scale, but teams still have to read the signals, match creators with brand values, and make sound calls based on the data. Growth-onomics can help connect engagement to onsite behavior and conversions.
Think of engagement data as the link between content and business results. Don’t stop at likes, comments, or shares. Ask the next set of questions: how many engaged users visited your site, how many added to cart, and how many converted.
FAQs
Which metrics matter most beyond engagement rate?
Look past engagement rate and pay close attention to metrics that connect to business results, like click-through rate, form completions, and cost per acquisition.
It also helps to track audience sentiment, follower growth patterns, revenue, customer lifetime value, and cost per engagement. Taken together, these metrics give you a clearer view of brand perception, flag possible bot activity, and show which interactions lead to long-term growth.
When should I use native analytics instead of a third-party tool?
Use native platform analytics for your first pass, core tracking, and sanity-checking any all-in-one dashboard. They’re the main source for confirming numbers and spotting anything that looks off.
Third-party tools can lag because of API delays or sync issues. That’s why native reports are usually the best place to benchmark performance and investigate problems like attribution windows or device tracking. As campaigns get more complex, you can bring in third-party tools for automation and deeper analysis.
How can I tell if an influencer’s engagement is real?
Look past raw like counts and pay attention to quality interactions instead. That means meaningful comments, shares, and saves.
A fast burst of engagement right after a post goes live can point to an active audience. But a like-to-comment ratio above 100:1 can be a red flag. In many cases, it may hint at artificial activity.
It also helps to watch for odd follower-growth spikes. If the numbers jump in a way that doesn’t match the account’s normal pattern, that’s worth a closer look. You should also check whether followers are based in regions that make sense for the influencer’s niche.
Tools can help here. They can flag synthetic profiles, engagement pods, and repetitive bot comments.