

Monitoring publisher traffic quality is essential to avoid wasting ad budgets on invalid traffic (IVT), which accounts for over 20% of online traffic and puts $37 billion in U.S. ad spend at risk annually. Fraudulent traffic not only drains budgets but also distorts analytics, misguiding marketing strategies and risking compliance violations. Here’s what you need to know:
Key Takeaways:
- Invalid Traffic Types: Includes bot traffic, cookie stuffing, click injection, and lead fraud. Advanced AI-powered schemes are increasingly common.
- Impact on Business: Fraudulent traffic skews analytics, inflates costs, and undermines metrics like ROAS and customer lifetime value.
- Metrics to Watch: High bounce rates (>90%), short session durations (<5 seconds), and technical red flags like IP concentration and user-agent inconsistencies.
- Tools to Use: Combine analytics platforms like GA4 with fraud detection tools (e.g., DataDome, Spider AF) for real-time blocking and deeper insights.
- Publisher Compliance: Enforce onboarding checks, transparency in traffic sources, and ongoing monitoring to ensure adherence to your guidelines.
By focusing on engagement metrics, technical signals, and conversion data, you can identify and eliminate low-quality traffic while protecting your brand and budget.
Publisher Traffic Quality: Definition and Key Challenges
What Is Publisher Traffic Quality?
Publisher traffic quality gauges whether the visitors brought in by your partners are real individuals who engage meaningfully, align with your target audience, and follow your program’s guidelines. High-quality traffic is characterized by users who interact with your content, fit your demographic goals, and show clear intent to purchase. To evaluate this, you can examine three main factors:
- Authenticity: Are the visitors genuine humans?
- Engagement: Do they spend meaningful time on your site?
- Compliance: Are your program rules being followed by partners?
For instance, if the average time on site drops below five seconds or bounce rates exceed 90%, it’s often a sign that something’s off.
It’s also critical to differentiate between invalid traffic (IVT) and what’s considered "weak" traffic. IVT refers to outright fraudulent activity – like bots, proxies, or fake clicks from data centers. On the other hand, weak traffic involves real users who lack buying intent, often due to mismatched targeting, misleading ads, or outdated lead data.
"A lead that is validated as real, reachable, and consented can still be unprofitable to the buyer, and for that reason, low value." – Nick, Hyperone
Types of Invalid and Fraudulent Traffic
Fraudulent traffic comes in many forms, often using increasingly advanced tactics. Here’s a breakdown of some common types and how to spot them:
| Type of Fraud | How It Works | Key Red Flag |
|---|---|---|
| Bot Traffic | Automated scripts mimic human behavior, like scrolling and mouse movement | UA inconsistencies, missing mouse events, headless browser fingerprints |
| Cookie Stuffing | Affiliate cookies are secretly placed to claim credit for organic purchases | Last-touch dominance without a referrer chain; click-to-conversion under 1 second |
| Click Injection | Malicious apps send fake clicks just before app installs to steal attribution | Extremely short click-to-install windows |
| Brand Bidding | Partners bid on your trademarked terms to hijack high-intent traffic | Paid search ads targeting your brand keywords |
| Lead Fraud | Fake form submissions using bots or synthetic identities | Disposable emails, VOIP numbers, mismatched IPs/phones |
| Sub-ID Laundering | Affiliates hide bot traffic in unmonitored sub-IDs while routing clean traffic elsewhere | Sudden spikes in specific sub-IDs with no conversion lift |
Understanding these fraud types is essential for identifying and addressing them effectively. Fraudulent tactics are constantly evolving, with AI-powered schemes growing by 456% between 2024 and 2025. These bots now replicate human behavior more convincingly, using residential IPs and randomized profiles. Another rising issue is browser extension hijacking, where tools intercept the final click at checkout to claim unearned commissions.
How Traffic Quality Affects Business Performance
Poor traffic quality doesn’t just drain your budget – it also skews your analytics. When bots or low-intent users flood your funnel, your data may suggest certain channels are performing well, leading you to invest in sources that ultimately generate little revenue.
The financial impact is massive. Between 15% and 25% of affiliate spend in CPA programs is tied to fraudulent or invalid traffic. In 2022 alone, affiliate fraud cost businesses $3.4 billion – up from $1.4 billion in 2020. These losses directly affect key metrics such as ROAS (Return on Ad Spend), CPA (Cost Per Acquisition), and customer lifetime value (LTV). Customers acquired through affiliates often show significantly lower LTV compared to those acquired directly.
Compliance is another critical factor. Brands are legally responsible for their partners’ actions, and up to 43% of brands report affiliate violations like brand bidding, where partners compete against the brand’s own paid search campaigns. This makes poor traffic quality not just a financial burden but also a legal risk.
"Detection without enforcement is just reporting. The goal is to stop the payment, not document the loss after the invoice clears." – Sven Hezel, 24metrics
sbb-itb-2ec70df
How to Keep High Traffic Quality
Key Metrics for Measuring Traffic Quality
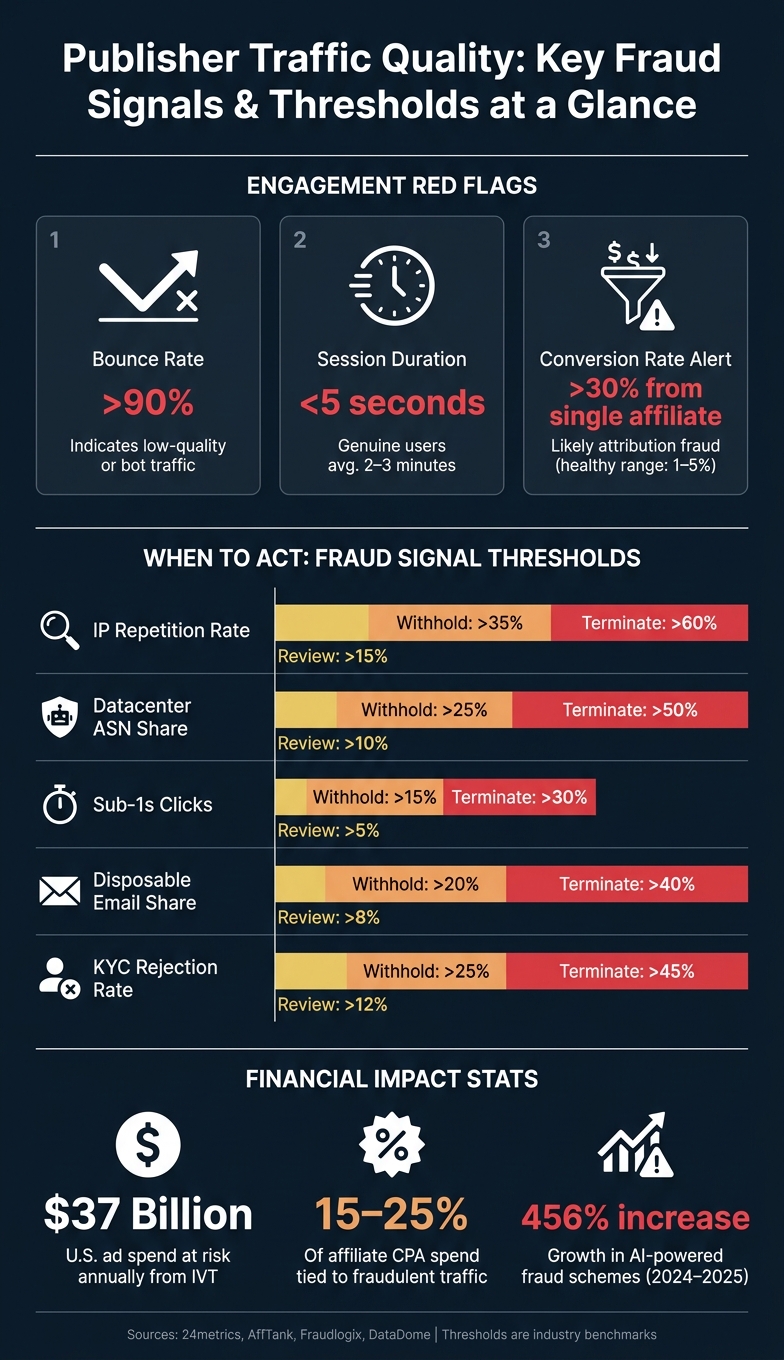
Publisher Traffic Quality: Key Fraud Signals & Thresholds at a Glance
Understanding what fraudulent traffic looks like is just the start. To truly tackle the issue, you need to focus on specific performance indicators that highlight whether your traffic is helping or hurting your goals.
Engagement and Behavioral Metrics
Engagement metrics are a critical first step. Bounce rate, session duration, and pages per session help you assess whether your visitors are real, engaged users or just bots.
For instance, a bounce rate exceeding 90% or session durations under five seconds usually indicate poor-quality traffic. Genuine users, on the other hand, typically spend 2 to 3 minutes on a site. Pages per session also tell a story – real visitors explore further, checking out product pages, FAQs, or related content. Sustained interaction is what separates valuable traffic from sources that won’t convert.
"If your traffic is high but is followed by a high bounce rate, high exit rate and low average time on the site, that is a good indicator of low-quality traffic." – Anayasia Johnson, Online Optimism
Tools like GA4’s "Engaged Sessions" metric can refine your analysis. This metric highlights sessions lasting over 10 seconds, those with conversion events, or those involving at least two pageviews. Another key factor is repeat visits. Returning users often have a higher likelihood of converting compared to first-time visitors. If a publisher shows zero return traffic, that’s a red flag worth investigating.
While user behavior offers valuable insights, technical data can uncover deeper issues with traffic quality.
Technical Signals of Fraudulent Traffic
Certain technical patterns are strong indicators of fraud. For example, IP concentration is a major warning sign. If over 2–3% of your traffic comes from a single IP or subnet, it could point to automated scripts or click farms. Similarly, if more than 25% of traffic from an affiliate originates from datacenter ASNs (like AWS or Digital Ocean), it’s worth pausing for further review.
User-agent inconsistencies are another clue. As Sven Hezel, founder of 24metrics, explains:
"A device that reports Safari on iOS at the click and Chrome on Windows at the postback is impossible."
Geography mismatches are equally telling. For example, high traffic from regions outside your target market – like Southeast Asia for a U.S.-focused campaign – often points to proxy usage or low-quality traffic. Combine this with sub-second click intervals or identical device fingerprints across multiple sessions, and you’ve likely uncovered fraudulent activity. A single device fingerprint generating 10+ conversions in 24 hours is a particularly strong bot signal.
Here’s a table outlining thresholds for fraud review:
| Signal | Review Threshold | Withhold Threshold | Terminate Threshold |
|---|---|---|---|
| IP Repetition Rate | >15% same IP | >35% same IP | >60% same IP |
| Datacenter ASN Share | >10% | >25% | >50% |
| Sub-1s Clicks | >5% | >15% | >30% |
| Disposable Email Share | >8% | >20% | >40% |
| KYC Rejection Rate | >12% | >25% | >45% |
While these technical signals help identify bots, conversion metrics reveal the true business impact of traffic quality.
Conversion and Funnel Metrics
To protect your ad spend and ensure compliance, pay close attention to click-to-conversion latency and downstream metrics.
Click-to-conversion latency is particularly revealing. Legitimate conversions often take at least 30 seconds, if not longer. When more than 10% of conversions occur within 5 seconds of a click, it’s a strong sign of click injection or automated bot activity. As Dustin Howes, Affiliate Marketing Consultant, explains:
"If something’s happened within five minutes from their first click all the way to checkout, that means that somebody’s doing something serious and misattributing the final conversion somehow."
Downstream metrics are just as important as initial engagement. Fraudulent traffic often disappears after the commission-triggering action – there are no repeat purchases, no deposits, and no further engagement. Monitoring LTV (lifetime value) and retention by publisher over 30–60 days can reveal traffic that initially seemed fine but provided no real value.
"Fraud converts once and disappears. Genuine users continue their journey through the funnel." – AffTank Editorial
As a benchmark, a solid overall conversion rate typically ranges between 1% and 5%. Paid traffic from legitimate sources rarely exceeds 12%. If a single affiliate consistently shows conversion rates above 30%, it’s not a success story – it’s likely evidence of attribution fraud.
Tools and Frameworks for Monitoring Traffic Quality
Tracking the right metrics is essential, but having the proper tools to identify issues in real time is just as critical. Let’s dive into the tools and strategies that can help you maintain high-quality traffic.
Analytics and Reporting Setup
For most businesses, GA4 is the go-to analytics platform. When you link GA4 with Google Ad Manager, you unlock the Publisher Ads report, which combines ad unit exposure, clicks, revenue, and engagement data into one view. This integration makes it easier to spot discrepancies between traffic health and user engagement.
To maximize your analytics setup, make sure your tags are sequenced correctly and extend your data retention period to 14 months. This longer retention window allows for year-over-year comparisons, helping you identify seasonal fraud patterns that shorter windows might miss.
One common issue is ghost spam – fake hits sent through the Measurement Protocol. You can counter this by setting up a Google Tag Manager (GTM) trigger that only fires tags when the hostname matches your domain. Adding secret keys through server-side GTM (sGTM) further strengthens this defense.
"You cannot see how much known bot traffic was excluded [by GA4]. The data is dropped before processing." – Google Analytics Documentation
While GA4 offers built-in bot filtering, it’s not foolproof. Studies show that 57% of bots bypass GA4’s "Exclude known bots" filter because it doesn’t check advanced signals like browser GPU fingerprinting or behavioral velocity. This makes it clear that GA4 alone isn’t enough for comprehensive traffic monitoring.
Once your reporting is in place, the next step is to deploy specialized tools for detecting ad fraud.
Ad Fraud Detection Tools
No single tool can address every type of fraud, which is why combining multiple tools is key. A solid setup includes real-time blocking and post-bid analytics to tackle both immediate threats and long-term patterns.
Here’s a comparison of some top ad fraud detection tools:
| Tool | Primary Function | Key Capability |
|---|---|---|
| DataDome Ad Protect | Real-time click fraud blocking | AI-driven behavioral analysis; ultra-low false positive rate (below 0.01%) |
| Spider AF | PPC & fake lead protection | Hourly updates to blocklists for Google Ads and Meta |
| Fraudlogix | Pre-bid & post-bid analytics | 30M+ IP blocklist and free post-bid quality reports |
| Branch | Mobile attribution fraud | Detects click injection and suspicious personas |
| Cloudflare | Bot management | Offers detection IDs for precise control over bot behavior |
| ClearTrust | Traffic quality scoring | Uses TQI Score™ with over 150 filters across multiple categories |
These tools work alongside your analytics to provide both real-time protection and deeper insights into traffic quality.
It’s important to avoid relying solely on IP exclusions. In March 2026, Faktica Analytics demonstrated how attackers could generate charged clicks from an already-blocked IP by using a "hidden IP" to fetch the ad URL and a blocked "exposed IP" to execute the click. Behavioral and server-side signals are much harder for attackers to spoof.
The benefits of layering these tools are clear. For example, after implementing Spider AF Fake Lead Protection and cleaning up Search Partner placements, one advertiser achieved a 152% increase in ROI and an 85% drop in CPC, all without losing valid leads.
"The data is clear: ad fraud isn’t a technology problem anymore – it’s an incentive problem. The tools to detect and prevent IVT exist. What’s missing is the industry-wide commitment to use them consistently." – Hagai Shechter, CEO, Fraudlogix
How Growth-onomics Supports Traffic Monitoring

Even with the right tools, the challenge often lies in connecting the dots between platforms like GA4, Google Ads, and your CRM. Disconnected data doesn’t give you a clear picture of which publishers are driving value and which are draining your budget.
Growth-onomics solves this by consolidating data across platforms and creating custom dashboards tailored to your business. These dashboards highlight key metrics like lead quality, revenue by source, and funnel drop-off.
Their approach includes setting up GA4 with proper goals, filters, and UTM parameters, along with centralized pixel management through Google Tag Manager. This ensures your tracking is consistent and reliable across campaigns. As they put it: "If you don’t base your marketing campaign decisions on data, you’re just guessing." And when it comes to combating fraudulent traffic, guesswork is exactly what you need to avoid.
Best Practices for Publisher Compliance
To ensure your campaigns remain secure and fraud-free, enforcing publisher compliance is critical. While tools and analytics can provide detailed insights into traffic quality, they must be paired with consistent oversight and well-defined standards for publishers. Below are some key strategies to create a compliance framework that works.
Publisher Onboarding and Verification
Stopping issues before they start is the first line of defense. A well-structured onboarding process – often referred to as Know Your Affiliate (KYA) – can prevent 60%–70% of brand-safety concerns before a publisher even receives a tracking link.
- Domain Verification: Use WHOIS data to assess domains. Reject any domain registered in the past 90 days, especially in high-risk areas, as these are often "burner" sites set up for fraudulent purposes.
- Content Review: Manually check 5 to 10 pieces of content on the publisher’s platforms for potential brand safety risks, using GARM (Global Alliance for Responsible Media) categories as a guide.
- S2S Postback Tracking: Require server-to-server (S2S) postback tracking for all commission events. This method ensures conversion data is captured outside the user’s browser, mitigating the risk of pixel manipulation.
- Trial Period: Start new publishers with a 30-day test period at 20%–30% of their requested volume cap. During this time, review 100% of their traffic before scaling up.
"The goal is not to build an impenetrable system… The goal is to make your network an unattractive target compared to networks with weaker controls. Fraud flows toward the path of least resistance." – ConvoQC
Traffic Source Transparency Requirements
Transparency should be a non-negotiable part of your agreements. Require publishers to provide a written breakdown of their traffic sources, including:
- The ratio of paid to organic traffic. If you suspect inefficiencies in your paid acquisition, a Google Ads audit can help identify wasted spend and improve ROI.
- Details on acquisition channels.
- A negative attestation confirming they avoid prohibited practices, like incentivized clicks or bot traffic.
To strengthen transparency, adopt IAB Tech Lab standards across your supply chain. Tools like ads.txt verify authorized sellers, sellers.json confirms publisher identities, and the SupplyChain Object creates an audit trail of intermediaries. Conduct quarterly audits of ads.txt entries to ensure they align with current SSP agreements and remove outdated ones.
If sub-affiliates are involved, insist on full disclosure of the sub-affiliate chain. Maintain a whitelist of approved sub-affiliate IDs to differentiate legitimate traffic from artificially inflated conversions.
"Brand safety in affiliate channels is the operator’s problem, not the affiliate’s. Regulators do not distinguish between content that an operator posts directly and content posted by a third-party affiliate." – Eyal Shlomo, COO, Track360
Once these transparency protocols are in place, continuous monitoring is essential to ensure publishers stick to the rules.
Ongoing Compliance Monitoring
Publisher compliance isn’t a one-time task – it requires ongoing vigilance since behaviors can shift over time. Regular monitoring ensures that standards are consistently upheld.
- Daily, Weekly, and Monthly Reviews: Perform daily checks for critical flags, weekly trend analyses (e.g., conversion rates and session durations), and monthly scorecards to track long-term traffic health.
- Risk-Based Monitoring: For new publishers in high-risk verticals, conduct weekly reviews for the first 90 days before transitioning to quarterly evaluations.
- Quality-Based Scaling: Only increase a publisher’s volume cap if their flag rate stays below 3%.
- Holdback Periods: Delay commission payments by 30–60 days to validate conversion quality before funds are released.
- Takedown SLAs: Embed service-level agreements (SLAs) into contracts to ensure swift action when violations occur. Use the following framework:
| Severity Tier | Example Violation | Notice-to-Remediation SLA |
|---|---|---|
| Critical | Terrorism, illegal acts | 4 hours (immediate suspension) |
| High | Adult adjacency, hate speech | 24 hours |
| Medium | Obscenity, brand drift | 72 hours |
| Low | Creative reuse issues | 7 days |
"Compliance is not something you verify once at onboarding. It is something you monitor continuously, because the partner who passes review today may change their methods tomorrow." – Track360 Team
Conclusion: Building a Data-Driven Approach to Traffic Quality
Improving publisher traffic quality isn’t something you do once and forget about – it’s an ongoing process. This guide has outlined how structured onboarding, layered fraud detection, real-time monitoring, and tiered compliance frameworks work together to prove that you can protect your campaigns while still driving growth. By cutting out wasted spend on bot traffic and fraudulent conversions, you free up resources to focus on partners who actually deliver results. This kind of continuous improvement paves the way for measurable success.
Take structured quality assurance frameworks, for example – they’ve been shown to cut fraud by as much as 90% and reduce CPA by 30%. That’s real evidence that keeping a close eye on traffic quality pays off in stronger returns.
And let’s be honest: vanity metrics like clicks and impressions don’t mean much if they don’t lead to conversions, retention, or revenue. As the ConvoQC Blog puts it:
"The brokers who consistently outperform their competitors aren’t smarter or luckier. They’re measuring." – ConvoQC Blog
The strategies we’ve discussed naturally lend themselves to a phased approach for long-term success. From pre-launch vetting to real-time campaign monitoring and automated rule enforcement, each step builds on the last, creating a system that becomes tougher for fraudsters to crack. This layered process ensures quality control at every stage.
Companies like Growth-onomics take these principles even further by leveraging data analytics to refine publisher quality continuously. Through performance marketing and customer journey mapping, Growth-onomics helps teams move from reactive fraud cleanups to proactive, data-driven strategies. This ensures every publisher relationship is rooted in transparency, and every advertising dollar is spent wisely.
FAQs
How do I tell invalid traffic from just low-intent traffic?
Invalid traffic includes fake or non-human activity, like bots, strange device behavior, or automated actions. This type of traffic can often be spotted through signs like poor IP reputation or unusual conversion patterns. On the flip side, low-intent traffic involves actual users, but they have little interest or connection to what you’re offering. To tackle invalid traffic, focus on technical solutions, while addressing low-intent traffic means refining your targeting and messaging to better connect with your audience.
What’s the fastest way to investigate a suspicious publisher spike?
To quickly investigate, break down the publisher’s traffic using your tracker by sub-ID, placement, or device. This helps pinpoint whether the spike is concentrated in a specific area or spread across multiple sources. Be wary of sudden traffic surges that aren’t tied to a particular campaign or event – these often signal potential issues.
Once you’ve isolated the source of the spike, dig deeper into the data. Examine metrics like referrer, geographic location, device type, and IP addresses. Look for irregularities, such as unusually high click volumes without corresponding conversions or conversion times that seem implausibly fast. These patterns can be strong indicators of fraudulent or suspicious activity.
When should I withhold payments vs. terminate a publisher?
When it comes to withholding payments, this should only happen in specific situations – like confirmed cases of fraud or when traffic quality consistently fails to meet agreed-upon standards. For instance, issues such as high void rates or a low customer lifetime value could signal a problem.
Reversing payments, on the other hand, should be reserved strictly for verified fraud. This approach helps maintain trust and fairness in the partnership.
If a publisher repeatedly violates compliance rules, fails to improve despite documented feedback, or demonstrates clear bad-faith behavior, termination may be necessary. However, before taking such a step, pause traffic immediately to investigate any quality concerns thoroughly. This ensures decisions are based on solid evidence and not rushed judgments.