
Want to know if your paid media campaigns are performing well? Start by benchmarking your conversion rates (CVR). A good CVR varies by industry, channel, and platform. For example, e-commerce averages 2.81%, while automotive repair hits 14.67%. Without benchmarks, you’re guessing whether your campaigns are effective.
Here’s a quick guide to benchmarking paid media CVRs:
- Define Conversions: Separate macro (e.g., purchases) and micro conversions (e.g., cart adds) to understand user behavior.
- Choose Metrics: Focus on CVR, CPA (cost per acquisition), ROAS (return on ad spend), and CTR (click-through rate).
- Standardize Data: Use the formula
(Conversions ÷ Clicks) × 100and align attribution windows across platforms. - Compare Benchmarks: Match your CVR against industry standards and your own historical data to spot gaps.
- Optimize: Address issues like poor targeting, weak landing pages, or mobile underperformance.
Key Insight: The top 10% of advertisers achieve an 11.45% CVR, while the median lags at 2.35%. Regular benchmarking and optimization can close this gap.
Next, learn how to set goals, collect reliable data, and turn insights into better campaign performance.
How to Benchmark Paid Media and Protect Your Brand
sbb-itb-2ec70df
Setting Clear Benchmarking Goals and Definitions
Defining your goals and metrics upfront is the backbone of accurate paid media benchmarking. Without clarity here, your efforts risk producing vague insights that can lead to wasted ad spend. So, before diving into data collection, it’s crucial to establish exactly what you’re measuring.
Define Conversion Events and Goals
Start by breaking conversions into two categories: macro conversions and micro conversions. Macro conversions represent the big wins – like purchases, demo bookings, or form submissions from qualified leads. These are the actions that directly impact your business outcomes. Micro conversions, on the other hand, are the smaller steps users take along the way, such as adding items to a cart, visiting a pricing page, or watching a video. While macro conversions show you the results, micro conversions help you understand where users might be getting stuck in their journey.
Think of this as a two-tier system:
- Primary conversions (macro) should feed into Smart Bidding strategies because they directly reflect your business goals.
- Secondary conversions (micro) act as diagnostic tools for mapping the user journey. They help identify drop-off points but shouldn’t guide automated bidding signals.
When setting up conversion tracking, tailor your counting method to your business model. For e-commerce, use the "Every" setting to track each transaction. For lead generation, select "One" per user to avoid inflating numbers through duplicate form submissions. Also, align your conversion window with your sales cycle – 30 days works for quick decisions like impulse buys, while B2B services might need 60–90 days.
Once your conversion events are defined, the next step is choosing the right metrics for benchmarking.
Choose Metrics for Comparison
To benchmark effectively, focus on these key metrics: CVR (conversion rate), CPA (cost per acquisition), ROAS (return on ad spend), and CTR (click-through rate). Each metric highlights a different aspect of your campaign performance:
- CTR: Indicates how relevant your ads are to your audience.
- CPA: Ties your spending to specific outcomes.
- ROAS: Shows whether your campaigns are profitable.
- CVR: Measures how well your post-click experience converts visitors.
As Sam Yielder, Senior Paid Media Manager at Squidgy, explains:
"Clients typically care most about ROAS, CPA, and conversion rates… Ultimately, clients want to see how ads impact revenue, lead quality, and overall ROI."
Consistency is key. Always compare the same metrics across the same time periods, geographic regions, and attribution models. For example, mixing a 7-day attribution window on one platform with a 30-day window on another will skew your results and make meaningful comparisons impossible.
With your metrics aligned, the next step is ensuring your conversion rate calculations are standardized.
Use a Standard Conversion Rate Formula
The formula for conversion rate is straightforward: (Conversions ÷ Clicks) × 100. However, the challenge lies in how different platforms define "clicks", which can complicate cross-platform comparisons.
| Platform | Default Denominator | Key Note |
|---|---|---|
| Google Ads | Clicks, video views, calls | Reports conversions back to the click date, not the conversion date |
| Meta (Facebook) | Link clicks | Includes 1-day view-through attribution by default |
| TikTok Ads | Clicks + 6-second views | Uses Engaged View-Through Attribution |
| GA4 (Website) | Sessions | Tracks individual browsing sessions |
To simplify things, use "clicks" as your standard denominator. For Meta, adjust to "7-day click only" attribution to align with Google Ads. As Randy Wattilete, Founder of Kirro, points out:
"When someone asks ‘what’s your CVR?’ the only honest answer is ‘on which platform?’ A 3% CVR in Google Ads and a 3% CVR on your website are measuring completely different things."
Collecting and Structuring Paid Media Data
Once you’ve nailed down your metrics and standardized your conversion formula, the next step is all about gathering the data and ensuring it’s reliable enough to base decisions on.
Pull Data from Advertising Platforms
Every major ad platform – like Google Ads, Meta, and LinkedIn – offers conversion data through its dashboard. But here’s the catch: they each handle attribution differently. For instance:
- Google Ads reports conversions based on the click date.
- Meta uses a 7-day click and 1-day view window by default.
- LinkedIn operates on a 30-day click window.
This inconsistency can lead to skewed comparisons. To get a clear, unbiased view of performance, centralize your data in a single warehouse using tools like Fivetran or Porter Metrics. These tools provide a neutral perspective that individual platform dashboards simply can’t.
"Every ad platform is grading its own homework. The numbers aren’t wrong – they’re incomplete. Each platform sees its own touchpoints and attributes accordingly. None of them can see the full journey." – Warehows
Keep in mind, platform-reported conversions often overestimate actual results by as much as 40–60%, thanks to overlapping attribution windows. To reconcile these discrepancies, connect your ad data to a CRM like HubSpot or a payment processor like Stripe. This way, you can match platform-reported conversions to real closed deals and actual revenue.
Once your data is centralized, the next step is ensuring its accuracy.
Validate and Segment Data with Analytics Tools
Before diving into analysis, confirm that your tracking is accurate. A small discrepancy – 10–15% – between GA4 and your ad platform’s conversion data is normal. Anything beyond that could signal a tracking issue. Use tools like Google Tag Manager (GTM) Preview Mode and GA4 DebugView to troubleshoot.
After validating your data, segment it by key factors like:
- Device (e.g., mobile vs. desktop)
- Campaign
- Audience
- Geography
For instance, while mobile devices are projected to drive 64.2% of Google Ads clicks in 2026, they account for only 49.6% of conversions. Pairing platform metrics with GA4 engagement signals (like scroll depth or session duration) and CRM insights (such as MQL-to-SQL rates) can help confirm whether your leads are genuinely qualified.
Once segmented, it’s time to organize your data for easier analysis.
Organize Data into a Standard Format
With validated and segmented data ready, structure it consistently to simplify cross-channel analysis. This could be as straightforward as a spreadsheet or as advanced as a BI tool. At a minimum, your data should include columns for:
- Platform
- Campaign
- Date
- Spend
- Clicks
- Conversions
- Revenue
Each row should represent a single campaign or channel.
To streamline analysis further, categorize your metrics into three layers:
- Input: Spend, impression share, creative count.
- Output: Clicks, CTR, CPC, leads.
- Outcome: Blended ROAS, CAC, pipeline, revenue.
Also, adopt a standardized naming convention for campaigns, like Channel_Audience_FunnelStage_CampaignType. This makes filtering and grouping data a breeze, eliminating manual cleanup during reporting cycles. Don’t forget to audit your UTM parameters for consistency – messy or inconsistent naming can split your traffic data and complicate analysis.
"If your tracking is broken or inconsistent, every analysis you run will produce misleading conclusions that lead to wrong budget decisions." – Cometly
Calculating and Normalizing Conversion Rates
Getting your conversion rates right is a critical part of evaluating how well your paid media campaigns are performing. But even with well-organized data, this is where many teams slip up by making simple, avoidable errors.
How to Calculate Conversion Rates Step by Step
The formula for calculating a conversion rate is simple: (Total Conversions ÷ Total Clicks) × 100. However, accuracy depends on ensuring that each event is counted only once. Duplicate conversions can inflate your numbers and lead to unreliable insights.
In addition to the basic conversion rate, you should also track these key metrics:
| Metric | Formula | What It Tells You |
|---|---|---|
| Conversion Rate (CVR) | (Conversions / Clicks) × 100 | Measures campaign performance |
| CPA (Cost Per Acquisition) | Total Spend / Total Conversions | Shows cost efficiency per conversion |
| ROAS (Return on Ad Spend) | Total Revenue / Total Spend | Revenue generated per dollar spent |
| nCPA (New Customer CPA) | Total Spend / New Customer Conversions | Cost to acquire first-time customers |
It’s important to note the difference between CPA and CAC. CPA is based on platform-attributed data (spend divided by attributed conversions), while CAC considers the overall spend to acquire new customers. Mixing these two metrics can lead to incorrect conclusions about how efficiently you’re acquiring customers.
"A KPI without its stage label is a number with no unit." – QRY Customer Stage Framework
Avoid relying on just an aggregate conversion rate. Break your data down by channel, device, audience, and keyword intent. A blended CVR can hide underperforming areas where there may be opportunities for improvement.
The next step is standardizing your data so it can be compared accurately across platforms.
Normalize Data for Consistent Comparisons
Raw conversion data from different platforms often can’t be directly compared. Each platform calculates CVR differently. For example:
- Google Ads might include video views and calls in its denominator.
- Meta typically uses link clicks.
- TikTok combines clicks with 6-second video views.
To create a consistent benchmark, use sessions from GA4 as your universal denominator across all platforms. Also, align your attribution windows – for example, switch Meta reporting to 7-day click only to reduce inflation from view-through conversions and better match Google Ads. For global campaigns, convert all costs to USD using a fixed exchange rate for the entire reporting period. This keeps your CPA and ROAS metrics comparable across regions.
Another critical adjustment is separating brand campaigns from non-brand campaigns. Brand campaigns often capture existing demand rather than generating new interest. Combining these with prospecting data can make your acquisition efforts seem more effective than they really are.
Once your data is standardized, it’s time to confirm its reliability.
Ensure Statistical Reliability
Even when your calculations are accurate, small sample sizes can make your results unreliable. For instance, a 4% conversion rate from just 50 visitors has a 95% confidence interval ranging from 0.5% to 13.7%. That’s too much variability to use as a dependable benchmark.
As a general rule, aim for a minimum of 1,000 visitors per variation to detect a 20% relative improvement with 95% confidence. For campaigns with fewer than 200 visitors per month, consider switching to quarterly reporting to smooth out fluctuations. If individual campaign data is still too sparse, aggregate your data at the channel or even industry level to establish a stable baseline.
The ultimate goal is to generate metrics you can trust – data that provides actionable insights rather than fluctuating numbers that lead to confusion.
Comparing Against Benchmarks and Improving Performance
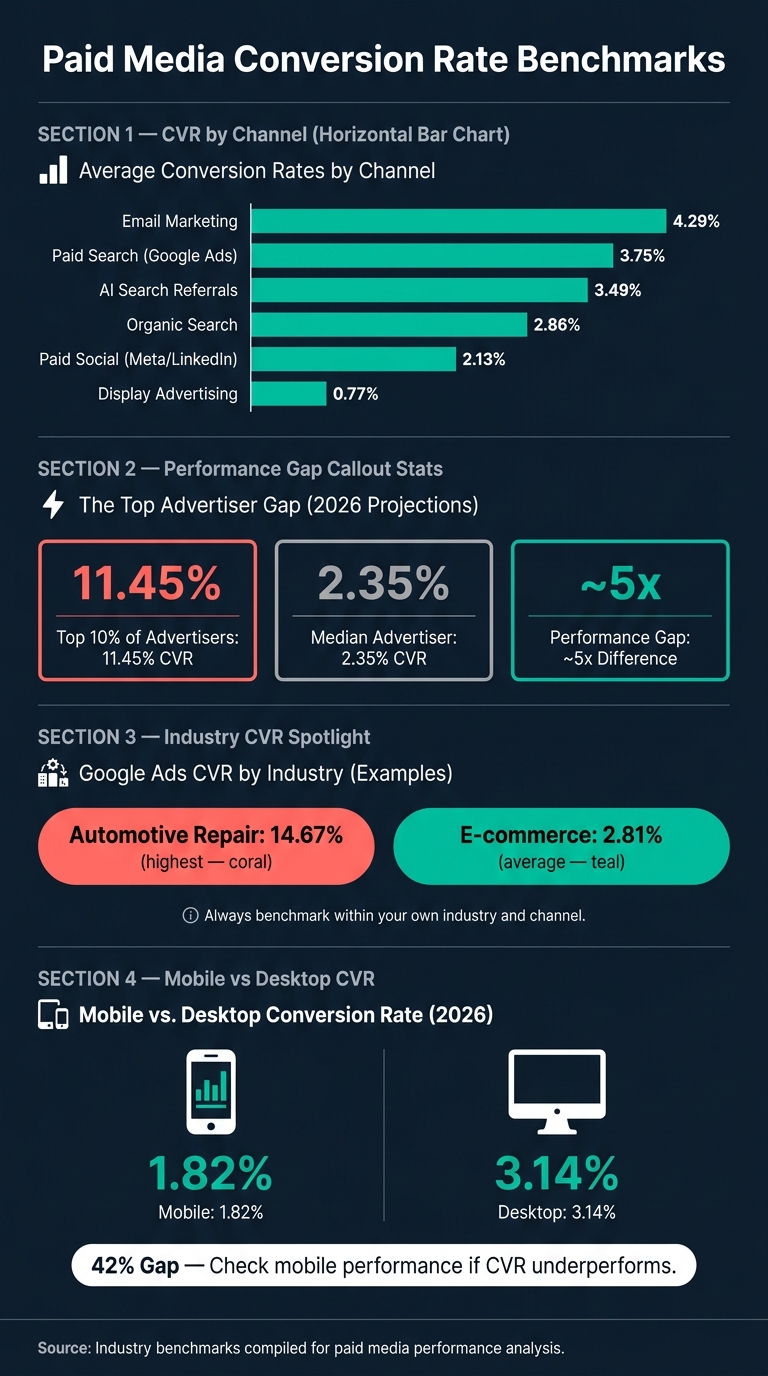
Paid Media Conversion Rate Benchmarks by Channel & Industry
Once you’ve normalized your conversion rates, the next step is to measure your performance against benchmarks and determine where adjustments are needed.
Internal vs. External Benchmarks
Your own historical data is the most relevant benchmark you can use. However, external benchmarks also provide helpful context. They reveal what’s possible in the broader market and can alert you when your performance veers off track.
| Channel | Average CVR |
|---|---|
| Email Marketing | 4.29% |
| Paid Search (Google Ads) | 3.75% |
| AI Search Referrals | 3.49% |
| Organic Search | 2.86% |
| Paid Social (Meta/LinkedIn) | 2.13% |
| Display Advertising | 0.77% |
For example, Google Ads benchmarks vary widely by industry. Automotive Repair averages a 14.67% CVR, while E-commerce averages just 2.81%. Comparing an e-commerce campaign to an automotive benchmark would lead to a flawed conclusion. Always ensure your external benchmarks align with the same channel, industry, and conversion type you’re analyzing.
"Benchmarks are useful when they sharpen judgment. They are dangerous when they replace it." – Kiril Ivanov, Managing Director, TwoSquares
Benchmarks work best when treated as ranges rather than fixed numbers. A campaign falling 5% below the benchmark is vastly different from one that’s 50% below. Additionally, year-over-year (YoY) comparisons often provide better insights than month-over-month, as seasonal trends can distort short-term data.
These benchmarks help you identify potential issues and guide your next steps for improvement.
Identify the Root Causes of Poor Performance
A low conversion rate signals a problem but doesn’t reveal the underlying cause.
To diagnose the issue, start by ensuring your comparisons are valid – match channel, location, and audience. Then, zero in on which specific metric might be off. For instance:
- High CTR but low CVR: This often points to landing page issues, a mismatch between the offer and audience expectations, or friction in the post-click experience.
- Low CTR but high CVR: Your targeting may be on point, but your ad creative might not be engaging enough to drive clicks.
- High CVR but high CPA: This could indicate inflated CPCs or inefficient budget allocation rather than problems with the ad or landing page.
"A benchmark can tell you a symptom. It cannot tell you whether the issue is page speed, trust signals, or poor mobile UX." – TwoSquares
Mobile performance is another crucial factor. In 2026, mobile conversion rates average 1.82%, compared to 3.14% on desktop – a significant 42% gap. If your overall CVR is underperforming, check whether mobile traffic is dragging it down. Address these findings directly with targeted optimizations before making broader campaign changes.
Once you’ve identified how your metrics compare, focus on diagnosing the root causes behind any deviations.
Optimization Steps Based on Benchmarking Findings
After identifying performance gaps, it’s time to act. Focus on high-impact changes first. For example:
- Strengthen your offer.
- Ensure a clear message match between your ad and landing page.
- Minimize form friction.
If a landing page converts at just 1%, doubling your ad spend will only double your cost per lead. Instead, prioritize improving the conversion rate before scaling traffic.
Landing pages with a single call-to-action convert 1.6× higher than those with multiple competing options. Simplify forms by reducing fields to the bare minimum or using multi-step forms, which can significantly improve conversion rates without altering your ad creative.
For Google Ads campaigns, enhancing your Quality Score is one of the most effective ways to improve ROI. Accounts with a Quality Score of 1–3 pay a 96% premium on CPC, while those with scores of 8–10 enjoy a 36% discount. This cost difference might not be apparent from benchmarks alone unless you evaluate CPC alongside CVR.
If managing multiple channels and segments feels overwhelming, consider partnering with a performance marketing expert like Growth-onomics. They can help you turn benchmarking insights into actionable, data-driven strategies that directly improve campaign performance and business outcomes.
Building a Recurring Benchmarking Process
Benchmarking works best when it becomes part of your routine rather than a one-off task. The key is to create a system that consistently delivers insights to refine your campaigns and guide business decisions.
Set a Regular Benchmarking Schedule
Metrics don’t all move at the same pace, so it’s important to review them on different schedules. A multi-tiered cadence works well: check fast-changing channels like Paid Search and Paid Social weekly to catch sudden changes, review campaign-level metrics like click-through rate (CTR) and conversion rate (CVR) monthly, and evaluate strategic metrics such as customer acquisition cost (CAC) and return on ad spend (ROAS) quarterly.
| Metric | Review Cadence | Primary Source |
|---|---|---|
| Click-through rate (CTR) | Weekly / Monthly | Google Ads, Meta, LinkedIn |
| Conversion rate (CVR) | Monthly | Google Ads, GA4, HubSpot |
| Cost per lead (CPL) | Monthly | Google Ads, Meta, CRM |
| Return on ad spend (ROAS) | Quarterly | Google Ads, Meta, Attribution tools |
| Customer acquisition cost (CAC) | Quarterly | CRM, Finance, Analytics |
To make this process efficient, set clear thresholds for anomalies. For example, flag CTR for review if it drops more than 20% week-over-week, or investigate CPL if it rises above 1.5× the industry benchmark for two consecutive weeks.
Build a Benchmarking Dashboard
A great dashboard doesn’t try to show everything – it focuses on the essentials. Keep it actionable by limiting each view to 8–12 metrics. Place your most critical KPIs, like ROAS and cost per acquisition (CPA), at the top, with supporting metrics such as CTR and cost per click (CPC) in smaller sections below.
Make the dashboard easy to interpret with simple visuals. Use color-coding: green for metrics above the benchmark, red for those below, and arrows to show trends. Every metric should include at least two forms of context – a comparison to a prior period and an industry benchmark. As DataAlly puts it:
"A number without context or action is just noise."
Organize the dashboard by channel, device, and campaign type instead of relying on blended averages. For instance, mobile conversion rates are often much lower than desktop (1.82% vs. 3.14% in 2026), so blending them could hide underperformance on mobile. If you’re managing high-spend accounts with budgets exceeding $5,000 per day, real-time dashboards are worth the investment. For smaller, more stable campaigns, daily updates should suffice.
Connect Benchmarking to Business Planning
Benchmarking becomes most impactful when it directly informs budgeting and strategy. Quarterly reviews are ideal for reallocating resources – shifting funds from underperforming channels to those surpassing industry standards.
"If your report doesn’t show where to increase or reduce spend, it’s not useful." – José María Rosales, Customer Success, Reporting Ninja
At the executive level, benchmarking helps translate marketing performance into business terms like CAC payback periods, lifetime value (LTV) ratios, and profitability. This is crucial, as 58% of marketing teams have previously cut campaigns that were actually performing well due to incorrect benchmarks or mismatched attribution windows. A structured, documented process ensures decisions are based on accurate data, helping leadership make more confident and timely investment choices.
Conclusion
Tracking and benchmarking paid media conversion rates isn’t a one-time task – it’s an ongoing process that fuels sustainable growth. To stay ahead, focus on getting your tracking right, setting KPIs tied to revenue, breaking down data into segments, identifying bottlenecks in your funnel, and regularly reviewing performance with business goals in mind.
Here’s a reality check: the gap between top advertisers and the rest keeps growing. By 2026, the top 10% of advertisers are expected to hit conversion rates of 11.45%, while the median will hover at just 2.35%. Why the stark difference? It comes down to consistent refinement. As DigitalApplied notes:
"The common thread among top performers is not a single tactic but a system: regular testing, AI-assisted optimization, and channel-specific landing page strategies working together." – DigitalApplied
This highlights the importance of a structured approach to optimization.
Benchmarks are most useful when they inspire action, not just reporting. A low conversion rate isn’t the end of the story – it’s a signal. Whether the issue lies in your landing page, your offer, your audience targeting, or even your attribution setup, the key is to dig into the why before deciding on the what.
When done right, disciplined benchmarking turns raw data into actionable strategies for growth. If you’re looking for expert support, Growth-onomics offers tailored solutions to help you build a data-first approach. From advanced conversion tracking and GA4 setup to media mix modeling and custom dashboards, their team specializes in turning insights into measurable success.
"If you don’t base your marketing campaign decisions on data, you’re just guessing." – Growth-onomics
FAQs
What conversion actions should I track for benchmarking?
To evaluate conversion rates effectively, monitor actions that match your campaign objectives. Break these down into primary and secondary conversions for better organization.
Primary conversions are the ones that directly contribute to revenue – think purchases, trial signups, or generating qualified leads. On the other hand, secondary conversions (like button clicks or page views) provide helpful diagnostic data but don’t directly drive revenue. Prioritize actions that make sense for your business. For example, an e-commerce site should focus on purchases, while a local service provider might emphasize booked appointments.
How do I compare conversion rates across Google Ads, Meta, and GA4 fairly?
To make a fair comparison of conversion rates between Google Ads, Meta, and GA4, it’s crucial to standardize your conversion event definitions – whether that’s purchases, form submissions, or another action. Keep in mind, though, that these platforms use different attribution models, counting rules, and lookback windows, so they’ll never align perfectly. Instead of trying to force a match, treat the data as complementary insights.
A practical approach is to use a centralized reporting dashboard. This allows you to aggregate data across platforms and focus your comparisons on campaigns with similar objectives and timeframes for more meaningful analysis.
How much data do I need before trusting a conversion rate benchmark?
To get dependable benchmarks, gather 4–6 weeks of steady, clean data. During this period, avoid altering targeting, creative elements, or budget, as these changes can distort the results. Make sure to document the conditions under which the data was collected. This context helps ensure the data is interpreted correctly. Growth-onomics provides strategies rooted in data to help businesses set accurate benchmarks and achieve growth driven by performance.