

To measure LinkedIn engagement against competitors effectively, you need to compare metrics like engagement rates, follower growth, and content performance. Here’s how to get started:
- Choose Competitors: Focus on 3–5 direct competitors of similar size and audience. Add indirect competitors and an aspirational brand for broader insights.
- Track Metrics: Monitor engagement rate (reactions + comments + shares ÷ impressions × 100), follower growth, and content-specific stats (e.g., video views, poll votes).
- Collect Data: Use LinkedIn’s Competitor Analytics or manually track competitor posts’ performance, including likes, comments, and shares.
- Compare Results: Calculate engagement rates for your profile and competitors. Use industry benchmarks to gauge performance.
- Identify Content Patterns: Study top-performing formats (e.g., videos, carousels) and recurring themes to find gaps your competitors miss.
Benchmarking helps you understand where you stand, refine your strategy, and justify resources. Focus on consistent tracking, analyzing at least 30 posts per profile, and adjusting strategies based on trends and gaps.
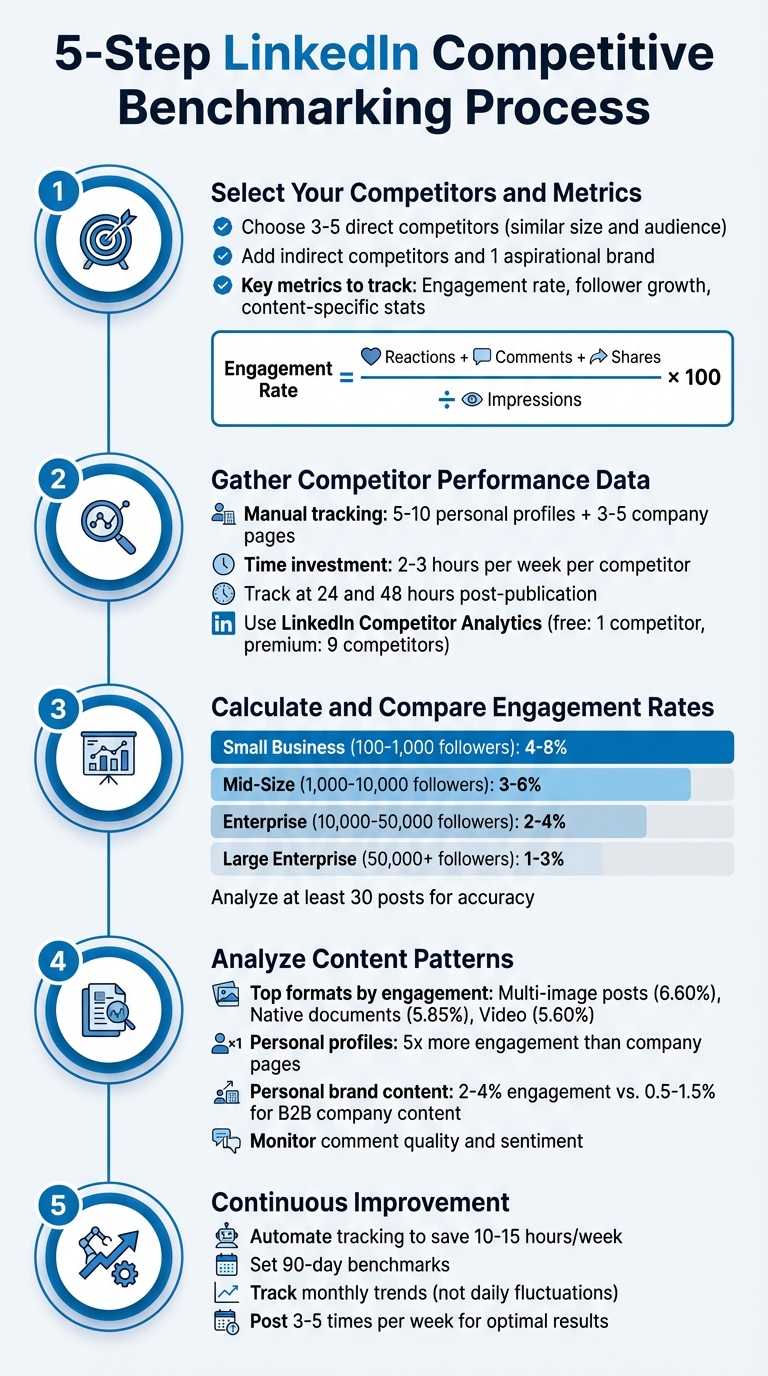
5-Step LinkedIn Competitive Benchmarking Process
Step 1: Select Your Competitors and Metrics
Selecting Competitors for Benchmarking
To start, focus on identifying 3–5 direct competitors that target the same audience and operate on a similar scale. This ensures your analysis remains relevant and accurate. Direct competitors are businesses offering comparable products or services to the same market. For example, if a mid-sized SaaS company with 5,000 followers compares itself to a giant enterprise with 100,000 followers, the results will be misleading.
In addition to direct competitors, look at indirect competitors – those who may not sell the same product but discuss related topics that attract overlapping audiences. Don’t forget voice competitors, which include personal profiles of influential executives in your industry. As Thomas Connors from SocialHP explains, "Personal profiles generate 561% more reach than company pages on LinkedIn, making them the primary battleground for thought leadership and audience attention". Lastly, include one aspirational brand – a standout player in your industry at the next level of growth. This helps you identify areas for long-term improvement.
To find competitors, use tools like LinkedIn’s "People Also Viewed" feature on competitor profiles and monitor industry hashtags. LinkedIn’s Competitor Analytics dashboard can also track up to nine competitors at once, making it a useful resource.
Once you’ve selected your competitors, the next step is to determine the key engagement metrics that will shape your analysis.
Key Engagement Metrics to Track
Focus on metrics that reveal how well your audience interacts with your content. Start with engagement rate, which is calculated as:
(Reactions + Comments + Shares) ÷ Impressions × 100.
On LinkedIn, an engagement rate above 2% is considered strong, while anything over 5% indicates your content is resonating exceptionally well.
Monitor follower growth on a monthly basis, but also ensure that 70–85% of your followers align with your target audience in terms of job roles and seniority levels.
For content-specific insights, track metrics based on format. For example:
- Videos: Completion rates and total views.
- Polls: Number of votes.
- Documents and PDFs: Saves and swipes.
Other critical metrics include the comment-to-like ratio (comments divided by likes), which reflects the depth of conversations and the quality of your community. Additionally, share velocity – the number of shares within the first 24 hours – indicates how quickly your content spreads and its potential for amplification.
Step 2: Gather Competitor Performance Data
Manual Data Collection from Competitor Profiles
Start by focusing on 5–10 key personal profiles (such as executives and industry leaders) and 3–5 major company pages. This range provides a manageable workload while still delivering useful insights. Be prepared to spend around 2–3 hours per week on each competitor to manually track their activity.
To stay organized, set up a spreadsheet to log essential details for each post. Include fields like publication date, content type (e.g., video, text, carousel, poll), topic category, likes, comments, and shares. Monitor posts at two intervals – 24 and 48 hours after publication – to capture how engagement evolves over time. Additionally, track the weekly and monthly posting frequency of competitors, and screenshot high-performing posts to study their messaging, tone, and visual design. If you’re analyzing executive profiles, use Private Mode on LinkedIn to browse anonymously.
For engagement rate calculations, divide the total interactions (likes + comments + shares) by the follower count, then multiply by 100. To dig deeper, calculate the comment-to-like ratio by dividing the number of comments by likes. These metrics provide a reliable way to compare competitor performance against industry standards.
Once you’ve gathered competitor data, you can shift your attention to analyzing your own LinkedIn performance.
Using LinkedIn Analytics for Your Own Profile
To evaluate your own data, use the Competitor Analytics tab available on your LinkedIn Company Page. The free version allows you to monitor one competitor, while the Premium version expands this to nine competitors and highlights trending posts from up to three. This dashboard updates daily, showing aggregated metrics like new followers, comments, and reactions.
Make it a habit to export your LinkedIn analytics data in CSV or XLSX formats regularly. Schedule monthly or quarterly exports to maintain a historical record, ensuring your data remains intact even if LinkedIn updates its platform. For smoother exports, download data in 90-day increments to avoid timeout issues and ensure completeness. Keep in mind that LinkedIn records all analytics in Coordinated Universal Time (UTC), so adjust the timestamps to align with your local time when analyzing campaign performance.
Step 3: Calculate and Compare Engagement Rates
How to Calculate Engagement Rates
To make sense of competitor data, turn it into percentages you can act on. LinkedIn engagement rates are calculated differently depending on whether you’re analyzing your own profile or someone else’s. If it’s your profile, find your engagement rate by dividing total engagements (likes, comments, shares, clicks) by impressions, then multiply by 100. This shows how well your content resonates with your audience.
For competitor profiles, where impressions aren’t visible, use the Engagement Rate by Followers formula: combine all reactions, comments, and shares on a post, divide by their total followers, and multiply by 100. Some analysts go a step further and halve the comment count to remove the impact of author replies, offering a clearer picture. To get a reliable average, calculate this rate across 10–20 recent posts.
"A creator with 50,000 followers but 200 likes per post has a very different story than a creator with 5,000 followers and 800 likes per post. One has reach. The other has influence." – InfluenceFlow
Once you’ve calculated these rates, compare them to industry benchmarks to see where you stand.
Comparing Against Industry Standards
Engagement rates can vary widely depending on the industry and the size of the company. For example, organic B2B content tends to have engagement rates between 0.5% and 1.5%, while personal profiles often perform better, landing in the 2%–4% range. Marketing and advertising companies typically hit 4%–6%, whereas manufacturing businesses generally fall between 1.5% and 3%.
Company size also plays a role. Smaller businesses with 100–1,000 followers often see engagement rates of 4%–8%, while larger enterprises with 50,000+ followers usually hover around 1%–3%. This drop happens because early followers are often more engaged, while newer ones tend to be less invested. So, if your engagement rate dips as your audience grows, it’s a normal LinkedIn trend.
Creating a Comparison Table for Key Metrics
A comparison table can help you clearly see performance differences. Include columns for each competitor and rows for metrics like total followers, average impressions per post, engagement rates, top-performing content formats, posting frequency, and primary audience industry. Update this table regularly to track changes and refine your strategy.
To ensure accurate comparisons, stick to consistent metrics. Use the same 30-day period for all profiles and compare companies of similar size and industry. For instance, a 500-follower tech startup with an 8% engagement rate might be outperforming an enterprise brand, even if its overall numbers seem smaller. Analyze data from at least 30 posts before making big decisions, as viral posts can skew results.
| Company Size | Follower Range | Expected Engagement Rate | Monthly Growth Rate |
|---|---|---|---|
| Small Business | 100–1,000 | 4–8% | 10–15% |
| Mid-Size Company | 1,000–10,000 | 3–6% | 5–10% |
| Enterprise | 10,000–50,000 | 2–4% | 2–5% |
| Large Enterprise | 50,000+ | 1–3% | 1–3% |
Source: ContentIn 2025-2026 Data
Step 4: Analyze Content Patterns and Insights
Finding High-Performing Content Themes
Once you’ve calculated engagement rates, shift your focus to what your competitors are posting and how they structure their content. Among the top-performing formats, multi-image posts lead with an average engagement rate of 6.60%, followed by native documents (carousels) at 5.85%, and video posts at 5.60%. Video is particularly hard to ignore – LinkedIn video impressions have surged by 73%, with views climbing 52%.
But format alone isn’t the full story. Pay attention to recurring topics your competitors cover and cross-check these with common questions left in their comments. Those unanswered questions highlight content gaps you can fill. Before making major changes to your strategy, track the performance of at least 30 posts to distinguish real trends from one-off anomalies.
Also, take note of the reactions your posts receive. For example, "Insightful" reactions often indicate stronger thought leadership than a basic "Like". Be sure to filter out engagement from a competitor’s own employees – this "insider" activity can skew the perception of how well their content resonates with an external audience. Once you identify trending formats, dig deeper into the quality of interactions to better understand true engagement.
Assessing Sentiment and Comment Quality
A post with 50 likes but no comments doesn’t carry the same weight as one with 20 likes and 10 thoughtful comments. Look for comments that include follow-up questions, personal experiences, or even buying signals like "Where can I get this?".
Engagement can also grow significantly when you respond to comments. In fact, replying can boost engagement by roughly 30%, and 83% of LinkedIn profiles see improved performance when creators actively respond. LinkedIn’s algorithm now favors posts that spark meaningful conversations over those that only collect passive likes. Keep an eye on how often competitors reply to comments and the quality of those interactions to see how they’re building trust and fostering dialogue with their audience.
Employee Advocacy and Executive Profiles
Personal profiles play a unique role in driving engagement. These profiles typically generate up to 5x the engagement of company pages. This underscores the importance of executive profiles in creating deeper connections with audiences.
Start by benchmarking 5–10 key personal profiles, including competitor executives, industry leaders, and high performers. Pay attention to their Comment-to-Like ratio – a higher ratio often signals stronger thought leadership and richer conversations. On average, personal brand content achieves engagement rates of 2–4%, compared to just 0.5–1.5% for organic B2B company content.
"A CEO’s perspective on market trends carries more influence than branded content, making personal profiles the primary vehicle for competitive thought leadership and audience trust-building." – Thomas Connors
When it comes to employee advocacy, authenticity is key. Avoid giving employees pre-written corporate language to share. Instead, provide them with ideas and training so they can share their own insights in a natural way. Posts with original commentary earn 5x the reach of simple reshares. Encourage employees to add their own perspective rather than just reposting company updates. These strategies, when integrated into your benchmarking efforts, can help you achieve meaningful and sustained growth.
sbb-itb-2ec70df
Step 5: Use Data Analytics for Continuous Improvement
Automating Engagement Tracking
Manually tracking engagement metrics can eat up 10–15 hours each week, pulling time and energy away from creating content. Automated tools, on the other hand, offer a more efficient solution by continuously collecting data with minimal errors.
Start by identifying 5–10 key competitors to monitor. This group should include both direct rivals and influential figures in your industry, keeping your data set manageable yet insightful. Automate the tracking of essential metrics like posting frequency, engagement rates, follower growth, and peak activity times. Instead of reacting to daily changes, focus on weekly or monthly reports to uncover long-term trends.
One major perk of automation is its ability to pinpoint timing gaps. Analytics can reveal when competitors are less active, giving you a golden opportunity to post during quieter periods for better reach. To compare companies of varying sizes, normalize the data by looking at engagement per follower. This metric highlights who is genuinely connecting with their audience.
Research shows that top-performing companies are 2.5 times more likely to monitor competitors’ social strategies, giving them a clear advantage. Automated tracking not only uncovers opportunities but also helps refine your approach, giving you a sharper edge in the competitive landscape.
Partnering with Growth-onomics for Data-Driven Insights
While automated tracking provides the groundwork, the real value lies in turning that raw data into actionable strategies. Data by itself isn’t enough – it needs to be interpreted and applied effectively. This is where a performance marketing agency like Growth-onomics can make a difference, helping you shift from trial-and-error tactics to confident, data-backed decisions.
Growth-onomics specializes in converting LinkedIn metrics into strategic insights. They focus on what actually matters – like which content types to prioritize, the best times to post, and the key industry discussions to engage in. Their expertise moves beyond vanity metrics (e.g., follower counts) to focus on indicators that drive meaningful outcomes, such as authority-building and conversions. Additionally, they provide data-backed performance stories that can help you secure leadership buy-in for budgets and resources.
Benchmarking isn’t a one-and-done task – it’s an ongoing process. With LinkedIn engagement dropping by 8.3% in the first half of 2025, it’s more important than ever to keep monitoring and adjusting your strategy. Growth-onomics ensures that your tactics stay aligned with shifting trends and competitor movements, so your team can focus on content creation without getting bogged down in data management.
"The real win isn’t just knowing your competitor’s engagement rate or spotting their content gaps. It’s using those insights to build search authority with social benchmarking that actually moves your brand forward." – Dax Hamman, CEO, FOMO.ai
#howto Find LinkedIn Competitor Insights | studio movellan
Conclusion
Benchmarking LinkedIn engagement is all about understanding your industry landscape to make smarter, data-driven decisions that help your brand grow. For instance, a 2% engagement rate might be seen as a win – or a missed opportunity – depending on your company’s size and sector.
Conducting a gap analysis helps identify where your performance falls short and lays the groundwork for actionable strategies. Instead of chasing vanity metrics, focus on share of voice, sentiment analysis, and the overall quality of engagement. Spot content gaps your competitors are missing, and use those opportunities to position your brand as a leader in your space.
By following these steps, benchmarking turns social media from a cost into a growth opportunity. It provides leadership with the proof they need to back your strategy. Staying ahead means consistently tracking performance across at least 30 posts, fine-tuning your posting schedule to 3–5 times per week, and tapping into employee advocacy to boost engagement. These tactics lay the foundation for a LinkedIn strategy that evolves over time.
"The brands that win on social aren’t lucky. They’re strategic." – Dax Hamman, CEO, FOMO.ai
Set 90-day benchmarks, track monthly trends instead of chasing viral moments, and adjust your approach based on the data. With the competitive landscape always shifting, ongoing monitoring keeps your strategy sharp and effective.
FAQs
How do I choose the right competitors to benchmark my LinkedIn engagement?
To pick the right competitors for LinkedIn benchmarking, start by identifying companies or profiles in your industry with a comparable audience size or market presence. Pay attention to those actively engaging on LinkedIn – this ensures the data you gather will be meaningful and useful.
Include both direct competitors (those offering similar products or services) and indirect competitors (those targeting the same audience or industry, even if their offerings differ). This mix helps you uncover insights and opportunities that might go unnoticed if you focus only on direct rivals. Dive into their follower growth, engagement metrics, and content strategies to pinpoint benchmarks that can guide improvements in your own LinkedIn efforts.
What key metrics should I track to measure LinkedIn engagement effectively?
To get a clear picture of LinkedIn engagement, start with your engagement rate – this shows how much interaction your content gets compared to your audience size. Also, keep an eye on reactions, comments, shares, and saves to gauge how well your posts connect with your audience.
Beyond these, metrics like click-through rate (CTR) and profile views per post reveal how effectively your content sparks interest and drives traffic. If you’re a business, tracking lead signals can show how your LinkedIn efforts align with your broader goals.
By analyzing these metrics, you can compare your performance to competitors and fine-tune your LinkedIn strategy for stronger engagement.
How can I find content opportunities my competitors are missing on LinkedIn?
To find content opportunities your competitors might be missing on LinkedIn, start by diving into their posts, engagement stats, and how their audience interacts with them. This means paying close attention to the themes they focus on, the formats they use, and how often they post. These patterns can reveal areas where they might be falling short or overlooking opportunities.
Look closely at engagement metrics like likes, comments, and shares to understand what their audience connects with most. Then, search for gaps – topics they’re not covering, styles they’re not using, or approaches they’re not taking. These gaps are your chance to step in with content that’s fresh and adds value. By doing this, you can craft a LinkedIn strategy that not only stands out but also meets the needs of your audience in a way others aren’t.