

Your funnel’s conversion rates can make or break your business. But how do you know if your numbers are good? Benchmarking against industry standards is the key. Here’s what you need to know:
- Conversion rates track how people move through your sales funnel, from visitors to paying customers.
- Industry benchmarks reveal whether your performance is above or below average. For example, e-commerce conversion rates range from 4.9% to 7.06%, while luxury goods often fall below 1.5%.
- Weak spots in your funnel – like low visitor-to-lead rates or abandoned carts – can be identified and improved for better results.
Ep 45: 7 Post-Click Metrics to Benchmark Your Funnel: Journey Metrics Crash Course | TWBERP
Mapping and Measuring Your Funnel
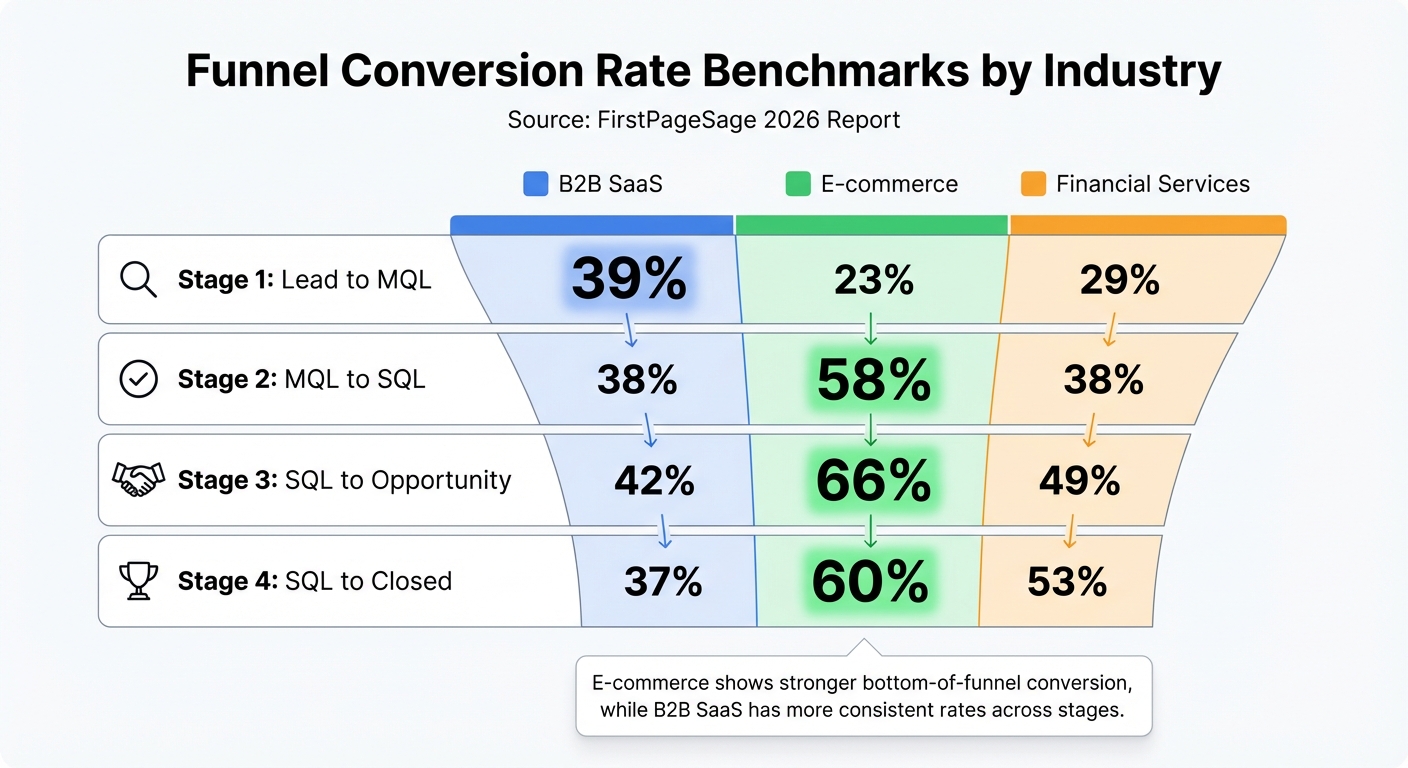
Funnel Conversion Rate Benchmarks by Industry and Stage
To start benchmarking effectively, you need a clear understanding of your funnel stages. This means defining each step of the customer journey, tracking relevant data, and calculating conversion rates with precision. The exact stages you monitor will depend on your business model – a B2B SaaS company, for instance, will have a very different funnel compared to an e-commerce store or a professional services firm.
How to Define Your Funnel Stages
Your funnel stages should mirror the actual steps customers take as they move through your sales process. For B2B SaaS companies, the funnel often looks like this: Visitor → Lead → Marketing Qualified Lead (MQL) → Sales Qualified Lead (SQL) → Opportunity → Closed Won. This setup reflects the longer sales cycles and multiple touchpoints common in the software industry, where the median sales cycle typically spans 84 days.
In contrast, e-commerce businesses often use a version of the AIDA model: Awareness → Interest → Consideration → Intent → Evaluation → Purchase. This structure accounts for the fast-paced nature of online retail, where 96% of visitors aren’t ready to make a purchase on their first visit. Meanwhile, professional services firms often prefer a simpler approach: Visitor → Inquiry → Proposal → Close.
To make your funnel actionable, tie each stage to a specific user action, like reaching a product catalog, submitting an inquiry, or landing on a "thank-you" page after completing a purchase.
Tracking Data at Each Stage
Once your funnel stages are defined, the next step is to track data effectively. Google Analytics 4 (GA4) is a popular tool for monitoring web traffic and user behavior. Its event-based tracking system provides real-time insights into where visitors drop off in your funnel. For multi-step forms or single-page apps, you can use virtual pageviews to track each step separately.
For more detailed lead tracking, CRM platforms like Salesforce are invaluable. These tools can follow leads from their initial interaction all the way to "Closed Won" status, helping you manage follow-ups and maintain sales momentum. Pairing your CRM with marketing automation tools adds another layer of efficiency by automating lead scoring. This helps identify which MQLs are ready to transition into SQLs based on their behavior and engagement. Notably, inbound leads convert from MQL to SQL at a rate of 31.3%, which is more than three times higher than outbound channels like email lists.
For additional insights, use qualitative tools like heatmaps and session recordings to uncover friction points that quantitative data might miss. When setting up funnel reports in Google Analytics, make the first step "required" to ensure cleaner data by only counting users who began at the intended starting point. Together, these tools provide a solid foundation for accurate tracking and analysis.
Calculating Conversion Rates
To calculate your conversion rates, divide the number of users who move to the next stage by the number who entered the current stage, then multiply by 100. For example, if 1,000 visitors result in 150 leads, your visitor-to-lead conversion rate is (150 ÷ 1,000) × 100 = 15%. Repeat this process for every transition in your funnel – Lead to MQL, MQL to SQL, SQL to Opportunity, and so on.
Your overall funnel conversion rate is calculated by dividing the total number of conversions by the total number of visitors, then multiplying by 100. For instance, if 1,000 visitors ultimately lead to 29 customers, your overall conversion rate is 2.9%, which aligns with the industry average. Tracking these metrics weekly is crucial; companies that monitor pipeline velocity weekly experience 34% revenue growth, compared to just 11% for those that track less frequently.
Here’s a breakdown of typical conversion rates across different industries:
| Funnel Stage | B2B SaaS | E-commerce | Financial Services |
|---|---|---|---|
| Lead to MQL | 39% | 23% | 29% |
| MQL to SQL | 38% | 58% | 38% |
| SQL to Opportunity | 42% | 66% | 49% |
| SQL to Closed | 37% | 60% | 53% |
Source: FirstPageSage 2026 Report
Finding Reliable Industry Benchmarks
Where to Find Industry Benchmarks
To access trustworthy benchmark data, turn to specialized sources that provide detailed insights. For example, Unbounce evaluates over 57 million conversions annually to deliver landing page benchmarks. WordStream zeroes in on performance metrics for Google and Facebook Ads. Meanwhile, FirstPageSage compiles annual reports covering more than 30 B2B and B2C industries, offering insights into various stages of the sales funnel. If you’re in the SaaS space, OpenView Partners is a go-to for metrics specific to software businesses.
Marketing software providers like HubSpot and Salesforce also release comprehensive reports, such as the "State of Marketing" and "Einstein" studies, which provide a broad view of performance across multiple industries. For e-commerce, the Baymard Institute specializes in checkout processes and cart abandonment benchmarks. Businesses operating in specific regions can benefit from RockingWeb, which provides geographic benchmarks for areas like Australia, EMEA, and APAC. For instance, the average conversion rate in EMEA is 4.11%, while APAC averages 2.76%. Once you identify the right sources, the next step is understanding how to use these benchmarks effectively.
Understanding Benchmark Metrics
Benchmark metrics often include key measures like the median, which represents the middle value in a dataset and is less skewed by outliers. This makes it particularly useful for most businesses. For instance, the median conversion rate across industries is 6.6%. However, the top-performing 10% of websites often achieve conversion rates of 11% or higher.
Knowing where your performance stands within these tiers can help you set realistic goals. For example, "good" conversion rates typically fall between 3.5% and 5%, while average rates hover between 2% and 3.5%. In the B2B SaaS space, achieving a 70% Lead-to-MQL rate and an 80% MQL-to-SQL rate is considered excellent. It’s also worth noting that if your conversion event has high value, even rates below the median can still be highly profitable. Once you understand these metrics, you can align them with your specific business needs.
Adjusting Benchmarks for Your Business
Benchmarks are not one-size-fits-all, so tailoring them to your business is essential. Your sales approach plays a big role: self-serve SaaS companies should aim for visitor-to-trial rates between 4% and 8%, while enterprise models with high-touch sales often see visitor-to-demo rates of 1% to 3%. For businesses with average contract values (ACVs) exceeding $5,000, lower top-of-funnel conversion rates are expected due to longer decision-making cycles.
Traffic sources also influence benchmarks. For example, email marketing boasts an average conversion rate of 19.3%, while social media lags at around 1.5%. Paid search performs better, with Google Ads converting at 11.3%, compared to Bing’s 7.1% and Yahoo’s 5.8%.
Device usage is another critical factor. Desktop conversion rates (3.2%–4.3%) are roughly double those of mobile (1.82%–2.8%), even though mobile accounts for 73% of total traffic. Interestingly, in financial services, mobile conversions outperform desktop by 22%. If your mobile conversion rate is significantly lower – say 8% or more below your desktop rate – it might be time to focus on improving your mobile user experience.
sbb-itb-2ec70df
Comparing Your Funnel to Industry Standards
Once you’ve outlined your funnel and calculated your conversion rates, the next step is to see how you’re stacking up against industry benchmarks.
Aligning Your Funnel Definitions
Before diving into comparisons, make sure your funnel definitions match those used in industry reports. A common framework is the "Golden Funnel", which follows these stages: Visitor → Lead → MQL → SQL → Opportunity → Closed Won. Each stage needs to be clearly defined:
- A Lead should include only legitimate contacts, excluding bots or irrelevant submissions.
- Marketing Qualified Leads (MQLs) are prospects who fit your Ideal Customer Profile and show genuine buying interest.
- Sales Qualified Leads (SQLs) are vetted by your sales team, often after receiving pricing or service details.
- An Opportunity is a lead actively considering a purchase, such as one reviewing a proposal or contract.
Stick to your previously defined funnel stages to maintain consistency. If your MQL-to-SQL conversion rate is under 30%, it could mean you’re mislabeling low-intent actions as high-intent leads.
"If your MQL-to-SQL is low (<30%), your marketing offer doesn’t match sales intent. Fix: Stop calling ebook downloads ‘leads.’" – Convertify
Building a Benchmark Comparison Worksheet
To get a clearer picture of your performance, create a worksheet that compares your metrics to industry standards. For instance, in the B2B SaaS space, the average Visitor-to-Lead conversion rate is 1.5%, with top performers reaching around 5%. Your MQL-to-SQL rate might be 39%, close to the benchmark of 38%.
Use your tracked data to populate the worksheet and analyze trends over 30- and 90-day periods. Break down the data further by device (mobile vs. desktop) and traffic source (paid vs. organic). For example, Google Ads campaigns average a 7.52% conversion rate, while Facebook Ads lead campaigns average 7.72%. Even small improvements at each stage – say, a 10% increase – can result in a 32% boost in total revenue.
Identifying Weak Spots
Pinpoint the stages where your performance lags the most. For example:
- If your Visitor-to-Lead rate is below 1%, you might be attracting irrelevant traffic. Review your Google Ads search terms and refine your targeting.
- If your MQL-to-SQL conversion is under 30%, it could signal a disconnect between your marketing offers and buyer intent.
- If your Opportunity-to-Closed Won rate is below 15%, the issue might lie in sales execution, such as weak demos or inconsistent follow-ups.
Focus your efforts based on traffic volume, revenue potential, and the size of the gap. For instance, addressing a 20% gap in a high-volume stage will likely have a bigger impact than fixing a 50% gap in a lower-volume stage. With mobile devices now driving 60% of e-commerce conversions, underperforming mobile metrics should also get immediate attention.
Lastly, collaborate with your sales team to identify common objections – whether it’s pricing, competition, or reputation. Their qualitative insights can complement your quantitative data and help you prioritize improvements.
This process sets the stage for refining your funnel and driving better results.
Improving Your Funnel Based on Benchmarks
Fixing Funnel Weaknesses
To strengthen your funnel, focus on identifying and addressing weaknesses at each stage. Even small improvements can make a big difference. Convertify highlights that boosting each stage by just 10% can increase total revenue by roughly 32%.
Start at the top of the funnel. If your visitor-to-lead rate is below 1%, it’s time to review your traffic sources. For example, tighten your Google Ads by eliminating overly broad keywords, or refine LinkedIn targeting to attract more qualified prospects. Don’t overlook page speed – it matters more than you might think. Pages loading in 2.4 seconds convert at 1.9%, but if loading drags to 5.7 seconds or more, conversion rates plummet to 0.6%.
In the middle of the funnel, if your MQL-to-SQL rate is under 30%, it’s a sign your marketing offers might not align with true buyer intent. Avoid counting passive actions, like ebook downloads, as MQLs. Instead, focus on leads who actively show interest, such as requesting demos or pricing details. If your SQL-to-Opportunity stage is slow, tools like pre-recorded demos or pricing calculators can speed things up, cutting sales cycles by around 17%.
At the bottom of the funnel, sales execution becomes critical. If your win rate is below 15%, revisit your sales demos – ditch the endless feature lists and focus on value. Also, speed up SDR follow-ups to keep prospects engaged. For e-commerce businesses battling high cart abandonment rates (around 70% on average), consider adding one-click payment options like Apple Pay, which can lower abandonment by 20%. Automated recovery emails can also help reclaim 10–15% of abandoned carts. Tools like heatmaps and site-usage tracking can reveal friction points, such as overly complex forms, missing trust indicators, or poor mobile usability. With mobile devices driving about 60% of e-commerce conversions, a mobile-first design is essential. Add customer reviews and security badges to product and checkout pages to build trust.
By addressing these gaps, you can model clear revenue growth and set the stage for measurable improvements.
Forecasting Potential Improvements
Quantifying the revenue impact of closing performance gaps helps prioritize where to focus your resources. For instance, if your visitor-to-lead rate is at 1.5% with 10,000 monthly visitors, you’re generating 150 leads. Doubling that rate to 3% would double your lead volume.
Use a benchmark comparison worksheet to explore different scenarios and estimate the revenue boost from moving a specific stage from "Average" to "Good." For example, if your MQL-to-SQL rate is 25%, but the industry average is 38%, closing that 13-point gap could significantly expand your pipeline. Regular tracking is critical – companies that monitor pipeline velocity weekly see 34% revenue growth compared to just 11% for those with inconsistent tracking.
Once you’ve modeled potential improvements, keep refining your approach to maintain momentum.
Working with Growth-onomics for Continuous Improvement
Growth-onomics (https://growth-onomics.com) offers tailored solutions to help you close performance gaps and continuously improve your funnel. By combining data analytics with performance marketing and user experience strategies, they address specific weaknesses in your funnel.
Their Data Analytics services provide a centralized view of your funnel metrics, eliminating the need for fragmented spreadsheets. This unified approach helps you track stage-specific drop-offs, conversion speeds, and trends over time. Whether it’s refining Google Ads targeting, reducing form friction, or enhancing mobile-first design, Growth-onomics ensures both traffic quality and user experience are optimized.
For middle-of-funnel challenges, their Customer Journey Mapping service is particularly helpful. By aligning marketing offers with buyer intent and ensuring sales and marketing teams agree on what qualifies as a lead, they reduce the friction that often slows MQL-to-SQL conversions. This alignment is crucial – 79% of leads fail to convert into sales due to poor nurturing.
"CRO benchmarks aren’t just nice-to-know – they’re critical tools to help you understand where you stand, advocate for optimization, and drive sustainable growth." – Talas Marketing
Growth-onomics supports your journey to surpass industry benchmarks through continuous experimentation, A/B testing, and step-by-step improvements. By combining industry data with your historical performance, you can set realistic goals, track meaningful progress, and create a funnel that consistently delivers results.
Conclusion
Benchmarking your funnel conversion rates is a key step toward achieving consistent growth. Numbers alone, like a 2% conversion rate, don’t tell the full story unless they’re compared against industry standards. For example, a 3% rate might look decent – until you learn that your industry averages 6.8%.
The true value of benchmarking lies in identifying where your funnel is falling short. Whether the issue stems from low-quality traffic at the top, poorly aligned offers in the middle, or weak sales execution at the bottom, benchmarks help you focus your resources where they’ll make the most impact. In fact, businesses that integrate benchmarking into their strategy see 20% better budget efficiency.
"Benchmarking is not just about measuring success; it’s about setting a roadmap for continuous improvement and staying relevant in a competitive landscape." – FasterCapital
As customer behavior evolves with advancements like AI-driven personalization (which can boost conversions by 20%) and mobile-first design, keeping your benchmarks up to date is critical. Reviewing them every 30 to 90 days allows you to respond to seasonal trends, economic shifts, and emerging technologies.
If you’re aiming for the top quartile, consider this: in Financial Services, top performers achieve conversion rates of 10.2%, compared to the average of 5.01%. By blending industry benchmarks with your historical data, you can set achievable goals, monitor progress, and refine your funnel to stay ahead of the competition. Regular analysis and alignment with these insights will ensure your funnel remains competitive and effective.
FAQs
How can I identify the most critical funnel stages for my industry?
To pinpoint the most crucial stages in your funnel, start by evaluating your conversion rates at key points – such as visitor-to-lead, lead-to-MQL, MQL-to-SQL, SQL-to-opportunity, and opportunity-to-closed. Compare these rates to industry benchmarks. For instance, B2B companies with an average deal size exceeding $5,000 often aim for metrics like a 3% visitor-to-lead conversion rate, a 50% lead-to-MQL rate, and a 28% win rate.
Once you’ve gathered your data, calculate the percentage difference between your conversion rates and the benchmarks. Use this formula: (your rate ÷ industry average) × 100. The stage with the largest negative gap is likely the area where you’re losing the most potential revenue, making it a prime target for improvement.
After identifying the weak spots, evaluate the potential revenue impact of optimizing each stage. Multiply the conversion rate at each stage by your average deal size to determine where improvements would yield the highest dollar value. Tools like Growth-onomics can assist by analyzing your data, highlighting high-impact areas, and providing customized strategies to enhance your funnel’s performance.
What are the best ways to track and improve funnel conversion rates?
To keep tabs on your funnel conversion rates and make meaningful improvements, start by leveraging tools that break down each stage of your funnel – from turning visitors into leads to closing sales. Many platforms offer dashboards that pull data from your website, ad campaigns, and CRM, giving you a clear picture of what’s working and where you’re losing potential customers.
For refining your funnel, try using A/B testing tools to tweak landing page designs or calls-to-action, and heat-mapping software to track how users interact with your site. These tools can pinpoint where visitors tend to drop off, allowing you to make precise adjustments. When you connect these insights with your CRM or marketing automation software, you’ll create smoother transitions between stages and gain real-time updates on your funnel’s performance.
Need expert help? Growth-onomics offers data-driven strategies like SEO, UX optimization, and performance marketing to help businesses streamline their funnels and drive measurable growth.
How often should I review and update my funnel conversion benchmarks?
It’s important to revisit and adjust your funnel conversion benchmarks at least annually. This practice helps ensure your business stays in step with evolving industry standards and market trends.
For even better outcomes, consider updating your benchmarks whenever fresh industry reports are published. These reports can offer key insights into changing customer behaviors and performance trends, giving you the opportunity to spot improvement areas and stay ahead of the competition.