

Behavioral data shows what users actually do on your website – clicks, scrolls, or abandoned carts – not just what they say in surveys. This data helps identify why users drop off, leading to smarter fixes that boost conversions. For example, businesses using behavioral analytics often see 10–15% revenue growth in the first year and conversion rates improve by up to 400%.
Key takeaways:
- Pinpoint friction points: Tools like heatmaps and session replays reveal issues like broken buttons or confusing layouts.
- Boost personalization: Tailored offers based on behavior can increase conversions by 10–30%.
- Quick wins: Fixing small issues, like a misplaced CTA, can lead to immediate improvements.
How to Optimize YOUR Website to Increase CVR!
How to Collect Behavioral Data
You don’t need a massive budget or a team of data scientists to gather behavioral data effectively. With the right tools, you can uncover how users interact with your site, pinpoint their frustrations, and understand what motivates them to convert – or leave. Below, we’ll explore tools that turn user behavior into actionable insights.
Tools for Data Collection
Heatmaps and clickmaps are great for visualizing where users click, how far they scroll, and which areas of your site grab the most attention. These tools highlight "hot" zones of high engagement and "cold" zones that users ignore. For example, in 2025, Paltalk, a B2C chat service, used heatmaps to find that users were struggling to browse virtual gift categories. After redesigning their menu, they saw an 11.32% increase in conversion rates.
Session recordings (or replays) offer a front-row seat to real user journeys, exposing behaviors like "rage clicks" or navigation hiccups. Back in 2019 and 2020, the ecommerce brand Orvis used session replays to identify a bug that redirected customers to a blank screen when they clicked the cart icon. Fixing this issue resulted in a 5% increase in overall cart conversions, with desktop conversions jumping 16% and mobile conversions improving by 2%.
Event tracking tools, such as Google Tag Manager (GTM), allow you to monitor specific user actions – like button clicks, form submissions, or video plays – without constant developer assistance. Meanwhile, form analytics can show which fields in your forms or checkouts are causing users to drop off, and scrollmaps reveal how far users scroll, helping you optimize where to place calls-to-action.
If you’re just starting out, tools like Microsoft Clarity, Hotjar, Google Analytics 4, and Google Tag Manager are excellent options. Mid-range ecommerce tools range from $29 to $299 per month, while enterprise solutions like ContentSquare can cost over $1,000 a month.
Best Practices for Data Collection
Start with privacy compliance. Use tools that anonymize data and include consent management features to meet GDPR and CCPA standards. Many platforms automatically mask sensitive information – like credit card numbers or passwords – in session recordings. Always deploy tracking scripts only after obtaining cookie consent.
Combine multiple data sources to get a clearer picture. Blend quantitative data (like metrics from Google Analytics) with qualitative insights from tools like heatmaps and session replays. This approach helps you understand not just what users are doing but also why. As Amplitude emphasizes, "Avoid data mistrust with clean, consistent, and relevant data". Create a tracking plan with clear event names, parameters, and metrics to maintain consistency.
Focus on tracking key actions and funnel steps rather than every single click. For example, events like "Product Added" or "Search Submitted" provide meaningful insights while keeping your data manageable, even if your site’s design evolves. Frameworks like ICE (Impact, Confidence, Ease) can also help prioritize which insights to act on first.
Lastly, test new tools before committing. Try two or three options for a week to see how they affect your site’s load speed and the clarity of the data they provide. This trial period can save you from investing in a tool that doesn’t meet your needs.
How to Analyze Behavioral Data for CRO
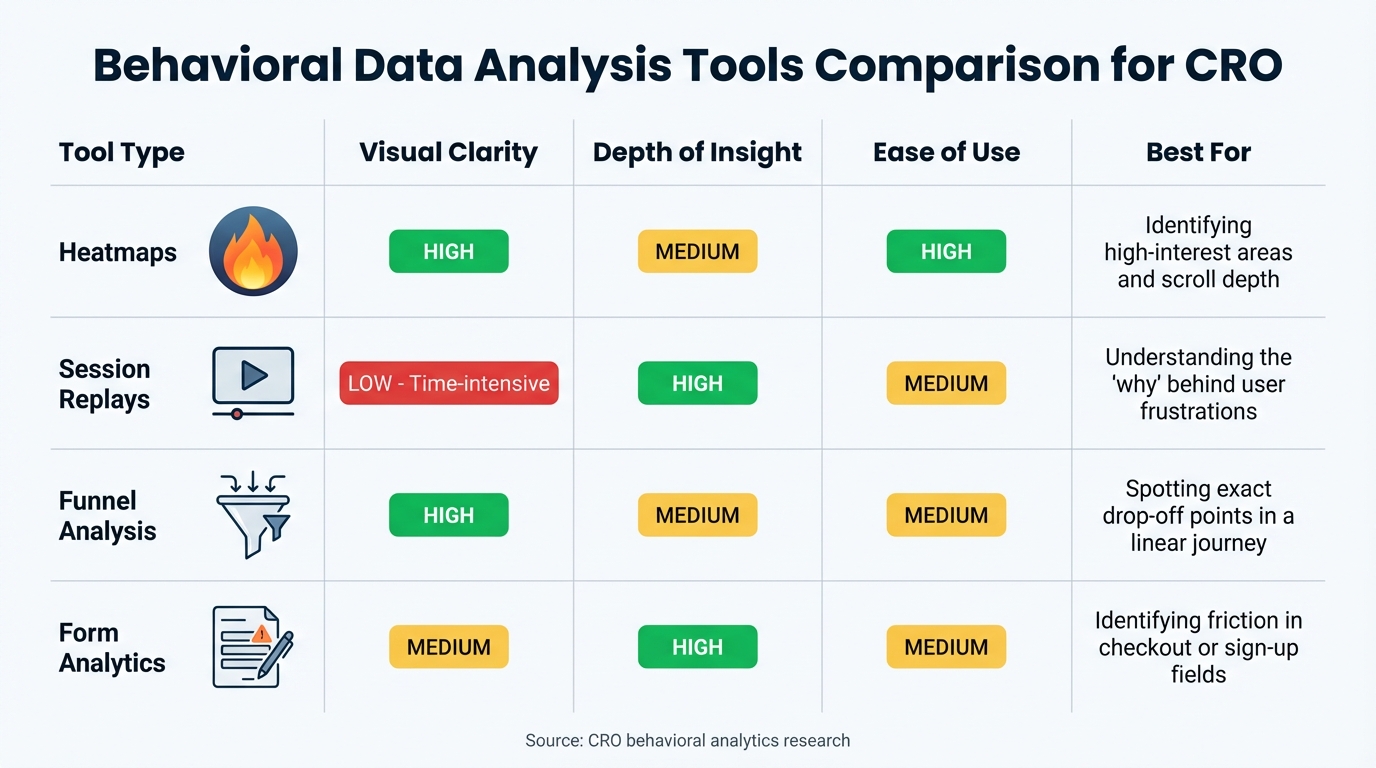
Behavioral Data Analysis Tools Comparison for CRO
Once you’ve gathered your data, the next step is turning it into practical insights that can improve your conversion rates. The goal here isn’t to get lost in the numbers but to pinpoint the obstacles preventing users from converting and uncover the reasons behind those challenges. Using the data you’ve collected, these strategies can help you identify specific areas where conversion rates can improve.
Spotting Patterns and Trends
Funnel analysis, sometimes called conversion waterfalls, is a great place to start. This method outlines each step users take toward completing a conversion and highlights where they drop off. By comparing the ideal user journey to the actual navigation paths, you can uncover unexpected behaviors like loops, backtracking, or sudden exits – clear signs of friction.
Case studies have shown that combining funnel analysis with session recordings can quickly expose issues like pricing mismatches, misleading offers, or technical glitches that hurt conversions.
Event tracking zeroes in on specific user interactions, such as rage clicks. These moments of frustration often point to broken links, sluggish buttons, or elements that appear clickable but aren’t.
Segmentation is another critical step because averages can mask important details. Break down your data by device type (mobile vs. desktop), traffic source, and user type (new vs. returning). For instance, while mobile accounts for 59% of web traffic, its conversion rate is just 2.2%, compared to 4.3% on desktop. By segmenting, you might find mobile-specific issues, such as a floating banner blocking the "Pay Now" button – something desktop users wouldn’t encounter.
To get a complete picture, combine quantitative data (like bounce rates from Google Analytics) with qualitative insights (like session replays and heatmaps). This dual approach helps turn vague metrics into actionable fixes. For example, a high bounce rate on a checkout page might be explained by session replays showing that, on mobile, a coupon field overlaps the "Pay Now" button, making it impossible for users to complete their purchase. As CUX explains, "Traditional analytics says: ‘My checkout page has a 70% bounce rate.’ Behavioral analytics shows: ‘On mobile, the coupon field overlaps the Pay Now button, so users can’t finish payment.’".
Recognizing these patterns can help you decide which tools and methods are best suited for your analysis.
Comparing Behavioral Data Tools
Different tools offer unique insights into user behavior. Heatmaps are particularly effective for visualizing user focus. Red zones highlight areas of high engagement, while blue zones show what users tend to ignore. They’re also useful for understanding scroll depth across the page. On the other hand, session replays take more time to analyze but provide detailed insights into individual user frustrations and the reasons behind them.
Funnel analysis is excellent for identifying exact drop-off points in linear processes like checkout flows, offering clear visuals and moderate depth of insight. Meanwhile, form analytics focuses on pinpointing specific form fields – such as "Phone Number" – that lead users to abandon forms. This tool delivers moderate visual clarity but a deeper understanding of form-related friction.
| Tool Type | Visual Clarity | Depth of Insight | Ease of Use | Best For |
|---|---|---|---|---|
| Heatmaps | High | Medium | High | Identifying high-interest areas and scroll depth |
| Session Replays | Low (Time-intensive) | High | Medium | Understanding the "why" behind user frustrations |
| Funnel Analysis | High | Medium | Medium | Spotting exact drop-off points in a linear journey |
| Form Analytics | Medium | High | Medium | Identifying friction in checkout or sign-up fields |
To prioritize your efforts, use the ICE framework (Impact, Confidence, Ease). Focus on changes that promise the biggest impact with minimal effort. For example, if scroll maps reveal that only 20% of users reach a call-to-action (CTA) button, moving it higher on the page could be a quick and effective fix.
sbb-itb-2ec70df
Applying Behavioral Insights to CRO
Creating Hypotheses for Optimization
To turn behavioral insights into actionable experiments, use this simple hypothesis structure: "Because we see [data], changing [element] will yield [desired effect] measured by [metric]". This format ensures your experiments remain clear, focused, and measurable.
Group your hypotheses into categories that address different parts of the user experience. This prevents tunnel vision on a single issue and ensures a well-rounded approach. For instance, if session replays reveal users rage-clicking on a non-clickable element, you could hypothesize that making the element interactive might reduce frustration and increase engagement. The success of this change could then be measured using a relevant performance metric.
When prioritizing hypotheses, the ICE framework can be a lifesaver. It evaluates Impact, Confidence, and Ease. Avoid spending time on changes that affect only a small number of users, require excessive resources, or lack strong supporting data.
Take real-world examples: Paul Frederick tackled last-minute purchase anxiety by adding a guarantee statement near the "Add to Bag" button, leading to an 11% increase in conversions. Similarly, Original Grain reorganized product placements based on user engagement data, boosting revenue per session by 17% and scaling site traffic by 43%.
For the best results, back every hypothesis with at least two types of data: one quantitative (like a high bounce rate in Google Analytics) and one qualitative (such as session recordings showing user confusion). As Brian Massey, Founder of Conversion Sciences, explains:
"Our brains are always looking for the shortest route possible when making decisions. As marketers, that means we tend to put things on our sites that worked for us in the past… regardless of what our customers need and want".
This data-driven approach ensures your hypotheses are grounded in user behavior, leading to more effective and engaging experiences.
Personalization and Targeted Experiences
Behavioral data lets you go beyond generic, one-size-fits-all strategies to deliver content that resonates with specific user groups. In fact, 87% of consumers value brands that "understand the real me", and 76% are more likely to buy from companies that personalize their marketing efforts.
To achieve this, segment users based on their behavior – like pages visited, session length, past purchases, or visit frequency. Then, categorize them by intent. Are they casual browsers, returning visitors comparing options, or ready-to-buy customers? Tailor your messaging accordingly. Browsers may benefit from educational content like "Learn More" prompts, while ready-to-buy users need a clear "Buy Now" button and a frictionless checkout process.
Dynamic content delivery takes personalization to the next level by adjusting elements in real time based on browsing history and engagement. For example, users who spend over 90 seconds on product pages and explore multiple options often show high purchase intent – with conversion rates up to 300% higher than average. For these users, consider displaying testimonials, highlighting limited-time offers, or offering persistent cart reminders.
You can also tailor messaging to fit four decision-making styles:
- Competitive buyers want quick, logical information.
- Methodical buyers appreciate detailed specs and processes.
- Humanist buyers respond to trust signals and social proof.
- Spontaneous buyers are drawn to emotional appeals and urgent calls-to-action.
Use data like time spent on a page or click patterns to identify which style aligns with each user, then tweak your copy and design to match.
"Try to target everyone, and you will sell to no one." – Ivan Kreimer, Freelance Content Marketer
Behavior-triggered messaging is another powerful tool. For instance, if a user abandons their cart or repeatedly views a specific product category, send an automated email highlighting those products. Retargeting ads featuring the items they browsed can also keep your brand top-of-mind. Transparency is key here – 73% of consumers are willing to share personal data if brands are clear about how it will be used.
Testing and Measuring Changes
Running A/B Tests
A/B testing is a powerful way to confirm your behavioral insights. As Splitbase explains:
"A/B testing isn’t a way to directly increase your conversions… It’s a way to validate your conversion optimization hypotheses".
The concept is simple: show different versions of a page to visitors and measure which one performs better in terms of conversions.
Start with an A/A test to ensure your tracking system works correctly. Once you’re confident in your setup, test one element at a time. For example, avoid changing both the headline and the CTA button simultaneously, as it can make it harder to pinpoint which change caused a shift in performance.
Real-world examples show the impact of this approach. Haute Hijab ran four rounds of A/B tests on their product detail pages, relying on behavioral insights rather than assumptions. The result? A 26.8% increase in site conversions. Similarly, UKToolCenter discovered that a filter menu in their Cuprinol woodcare category was causing friction. After removing it, they observed a 27% increase in user engagement.
To get reliable results, run your tests for at least three weeks. This timeframe helps account for traffic fluctuations and the novelty effect, where users may initially respond differently to changes. Wait until your test achieves 95% statistical significance and gathers at least 100 conversions per variation before drawing any conclusions.
If your test involves different URLs, protect your search rankings by using rel="canonical" tags to signal the original page and opting for 302 (temporary) redirects instead of 301 (permanent) ones.
Once your tests are running, the next step is to track their performance using key metrics.
Tracking Success with Key Metrics
After completing your tests, it’s critical to measure their impact. Focus on both primary metrics (like conversion rate or revenue per visitor) and secondary metrics (such as bounce rate or session duration). Tracking multiple metrics gives a clearer picture of how changes affect user behavior. As Paul Bernier, VP of Product Management at SiteSpect, notes:
"Tracking multiple metrics provides deeper insights and can help you develop more effective tests in the future. For example, your team might be surprised to discover that a test intended to increase conversions could unintentionally impact bounce rate or session duration".
Revenue-focused metrics like Revenue Per Visitor (RPV) and Average Order Value (AOV) are particularly useful for assessing profitability. For example, in 2025, Obvi used revenue-based behavioral insights to refine landing page elements. This led to a 7.81% increase in Revenue Per Session and added $2.5 million in revenue within just one month.
Segmenting results by device type, traffic source, and user type (new vs. returning) can reveal valuable patterns. For instance, while mobile devices account for 83% of landing page visits, desktop users typically convert 8% better on average.
Here’s an example of how metrics can change after optimization:
| Metric | Before (Control) | After (Variation) | Impact |
|---|---|---|---|
| Conversion Rate | 1.83% | 2.35% | +28.4% |
| Bounce Rate | 45.0% | 38.0% | -15.5% |
| Session Duration | 2:15 | 2:45 | +22.2% |
| Cart Abandonment | 70.19% | 62.50% | -10.9% |
| Revenue Per Visitor | $2.10 | $2.45 | +16.7% |
In addition to primary metrics, monitor micro-conversions like add-to-cart actions, newsletter sign-ups, or scroll depth. These early indicators of engagement can guide future tests. Behavioral signals, such as rage clicks (repeated clicking out of frustration), can also highlight areas where users face challenges. Even small changes can have a big impact – improving the checkout process alone can boost conversion rates by up to 35%.
Conclusion
Key Takeaways
Behavioral data transforms CRO from a guessing game into a strategy backed by evidence. By tracking user actions – like clicks, scrolls, hesitations, and engagement – you gain insights into intent that go far beyond basic demographics. The numbers speak for themselves: companies using behavioral analytics report average revenue growth of 10–15% within the first year, while campaigns using behavioral segmentation see 10–30% higher conversion rates compared to generic approaches.
The real advantage comes from understanding why users behave the way they do. Spotting friction points, like rage clicks or pauses during form fills, allows you to address issues that may be costing you revenue. Similarly, recognizing patterns such as prolonged engagement with a product or browsing across categories gives you the chance to create personalized, seamless experiences. This ongoing process – rather than one-off tests – is what sets thriving businesses apart from those that stagnate. Armed with these insights, you’re ready to take actionable steps to refine your CRO strategy.
Next Steps
Here’s how to put these insights into action. Start by auditing your touchpoints to identify gaps in your tracking. Strengthen your analytics setup to capture data across all user interactions. Focus on quick, impactful changes – like fixing broken links or streamlining forms – to see immediate results.
If you’re looking to fully embrace a data-driven CRO approach, consider working with experts who can turn behavioral insights into tangible growth. Growth-onomics specializes in Data Analytics, UX optimization, and Customer Journey Mapping to help businesses make the most of their behavioral data. The key is to move beyond analysis and take action – because every delay means missed opportunities to convert more users.
FAQs
How can I start using behavioral data for CRO without spending much?
You don’t need a massive budget to start gathering behavioral data for conversion rate optimization (CRO). Begin by defining your goals clearly – whether it’s cutting down cart abandonment or boosting sign-ups – and pinpoint measurable KPIs, like conversion rates or average order value.
Take advantage of free or trial-based tools like Google Analytics (GA4) for event tracking or Hotjar for heatmaps and session recordings. These tools let you track essential actions, such as button clicks or form submissions, without requiring any upfront investment. You can also gather qualitative insights by using free on-page surveys or polls to discover why users might be dropping off.
Keep your data organized in a straightforward spreadsheet and look for trends, such as pages with high exit rates or actions with low conversion rates. Start with small, manageable changes – like tweaking button text or simplifying form layouts. By leveraging free tools and focusing on the basics, you can uncover actionable insights and refine your CRO strategy without breaking the bank.
What are the best tools to analyze user behavior on my website for better conversions?
To improve your conversion rates by understanding user behavior, you can use three main types of tools: heatmaps, session recordings, and behavioral analytics.
Heatmaps give you a visual representation of where users click, scroll, or linger on your site. They help pinpoint areas of high engagement or spots where users might encounter obstacles. Tools like Hotjar and Crazy Egg are popular choices, offering intuitive interfaces and advanced filtering to make analysis easier.
Session recording tools allow you to watch real user interactions in action. These recordings can reveal moments of hesitation, confusion, or where users abandon your site. Platforms such as Mouseflow and FullStory provide detailed replays and insights to help you identify and resolve key issues.
Behavioral analytics tools track how users navigate your site, showing patterns like frequently used paths or where drop-offs happen during checkout. With tools like Microsoft Clarity and FullStory, you can map out these behaviors and uncover opportunities to streamline the user experience.
By combining these tools, you gain a well-rounded understanding of user behavior, enabling you to make data-backed decisions to boost your site’s performance. Companies like Growth-onomics specialize in integrating these tools to help businesses achieve measurable results.
How can I ensure my behavioral data collection complies with privacy laws?
To align with privacy regulations while gathering behavioral data, the first step is to outline exactly what data you’re collecting. This might include metrics like clicks, session length, or scroll depth. Then, determine if any of this data qualifies as personally identifiable information (PII), such as IP addresses or login credentials. For any personal data, ensure you have a valid legal reason for collecting it – explicit consent is a must. For non-personal data, legitimate interest might be sufficient, but you’ll need to document it carefully.
Draft a clear, straightforward privacy notice that details what data is collected, why it’s being used, and how it adds value for users. Make sure this notice is easily accessible and displayed before any tracking begins. Offer simple opt-in and opt-out options, and allow users to withdraw their consent whenever they choose. To protect the data, use encryption and restrict access to only those team members who need it. Finally, review your practices regularly to keep up with U.S. privacy laws, like the CCPA, and ensure ongoing compliance.