

AutoML makes predicting customer churn faster and easier, even for teams without data science expertise. By automating tasks like feature selection, algorithm testing, and hyperparameter tuning, AutoML allows businesses to quickly identify customers likely to leave. This enables proactive retention strategies that save money and improve customer loyalty.
Key Points:
- What is AutoML? AutoML automates machine learning tasks, such as algorithm selection and data preparation, to streamline model building.
- Why Predict Churn? Retaining customers is cheaper than acquiring new ones. Predicting churn helps businesses act before customers leave.
- How Does It Work? AutoML uses structured customer data (e.g., billing history, usage patterns) to train models that predict churn with high accuracy.
- Data Preparation Is Key: Clean, well-structured data – like CRM records, transaction logs, and customer interactions – is essential for effective churn prediction.
- Model Insights: AutoML generates churn risk scores, helping businesses prioritize high-risk customers and allocate resources effectively.
With tools like Amazon SageMaker and Google AutoML, companies can achieve churn prediction accuracy rates exceeding 93%. These insights can then be used to create targeted retention campaigns, such as personalized offers or loyalty perks, to minimize customer loss.
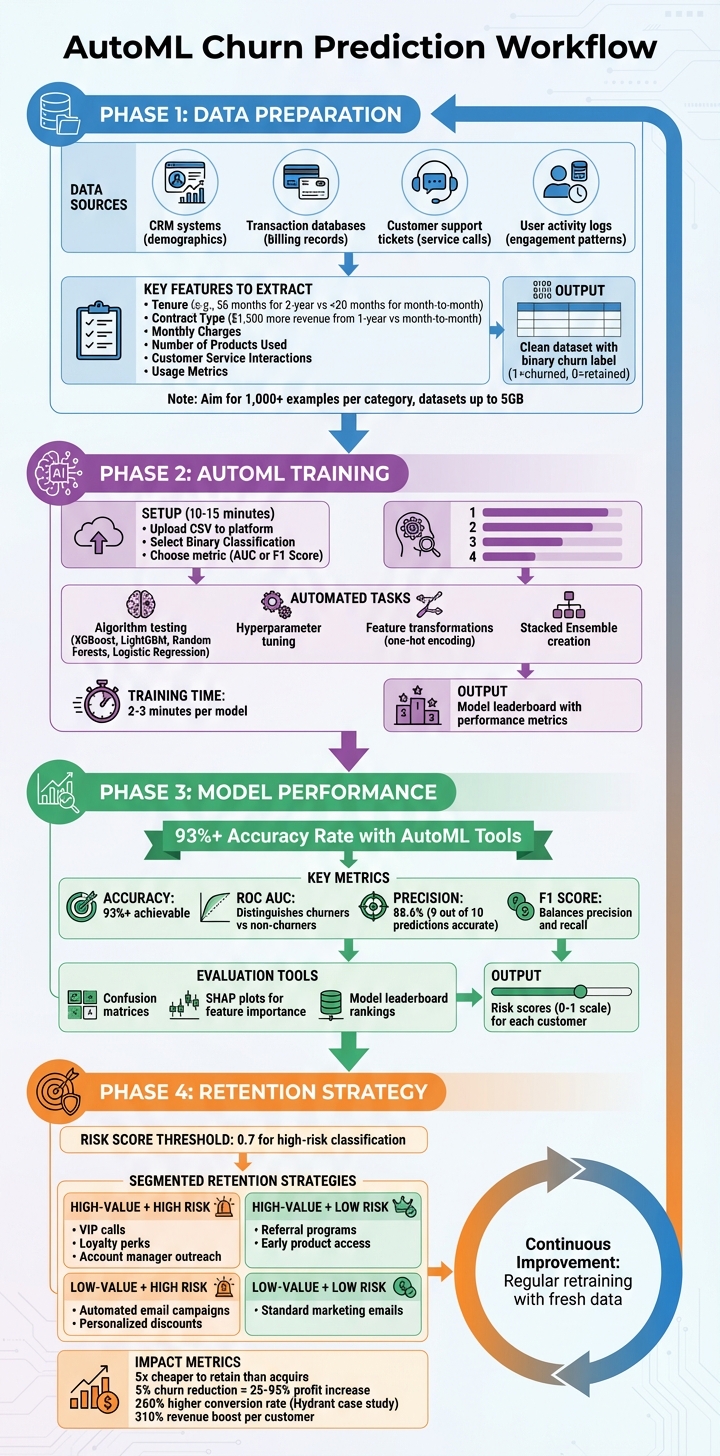
AutoML Churn Prediction Workflow: From Data Preparation to Retention Strategy
Predict Customer Churn with AutoML
sbb-itb-2ec70df
Preparing Data for AutoML Churn Models
To make AutoML effective at predicting churn, you need well-prepared data. The quality of your data directly influences how well the model performs. Organizing and refining your data is a crucial step to ensure accurate and reliable churn predictions.
Where to Get Your Data
Your business already generates the data you need. Here’s where to look:
- CRM systems: These hold demographic details like age, gender, and location.
- Transaction databases: These track billing records, monthly charges, and payment methods.
- Customer support ticketing systems: These log service calls and complaint history.
- User activity logs: These capture website or app behavior, such as login frequency, feature usage, and engagement patterns.
The challenge is pulling all this information together into one structured dataset that your AutoML tool can process. Most platforms can handle datasets up to 5 GB in size. Once the data is consolidated, focus on identifying the variables that are most likely to predict churn.
Creating Features for Churn Prediction
Features are the clues your model uses to find patterns. Some of the strongest predictors include:
- Tenure: How long a customer has stayed with you. For example, telecom data shows two-year contract users average 56 months, compared to less than 20 months for month-to-month users.
- Contract Type: Customers with longer contracts often generate more revenue. A one-year contract user, for instance, might bring in $1,500 more than a month-to-month user during their lifecycle.
- Monthly Charges: Higher charges can indicate greater engagement – or dissatisfaction.
- Number of Products Used: More products usually mean deeper customer relationships.
- Customer Service Interactions: Frequent calls may signal dissatisfaction or issues.
- Usage Metrics: Data consumption or login frequency can reveal engagement levels.
Avoid including unique identifiers like CustomerID or phone numbers – they don’t help the model and only add noise. Also, ensure that your data is interpreted correctly by the AutoML tool. For example, treat postal codes as categories rather than continuous numbers. Once your features are ready, the next step is to accurately label churn outcomes.
Defining and Labeling Churn
Labeling your historical data is essential. Churn, as previously defined, means a customer stops using your service. Translate this into your dataset by creating a target column with a binary label: "1" for churned and "0" for retained customers.
Clearly define what churn means for your business. It could be canceled subscriptions, closed accounts, or inactivity beyond a set period, such as 30 or 60 days. To train your model effectively, aim for at least 1,000 examples in each category. If your dataset is imbalanced, where churned customers make up less than 10% of the total, the model might default to predicting "no churn" too often. Balance the dataset to improve accuracy.
Finally, be cautious of data leakage. Don’t include information unavailable at prediction time, such as future payment records or reasons for cancellation. Keeping your data clean and relevant ensures your model produces actionable insights.
How AutoML Works for Churn Prediction
With a well-prepared dataset, AutoML takes over the heavy lifting in churn prediction. Once the data is ready, the platform automates key tasks like data cleaning, feature engineering, algorithm selection, and hyperparameter tuning. This automation speeds up the process and makes churn prediction more accessible, even for teams without deep expertise in machine learning.
Setting Up Your AutoML Workflow
To get started, upload your dataset to the AutoML platform. Most tools support formats like CSV and integrate with cloud storage solutions such as Amazon S3 or Azure Blob Storage. Once uploaded, the dataset is registered as a "Data Asset" for processing. At this stage, you’ll need to specify your target variable – the column that indicates whether a customer churned, often labeled as "Churn?" or "Exited". This step tells the AutoML system what outcome to predict.
For churn prediction, select Binary Classification since the goal is to predict one of two outcomes: churn or no churn. Next, choose an evaluation metric like AUC (Area Under Curve) or F1 Score to rank model performance. Some platforms, such as Amazon SageMaker Autopilot, can handle datasets up to 5 GB in size, and setting up the workflow typically takes about 10 to 15 minutes. This process follows the preparation of your features and labels.
Training the Model
AutoML evaluates multiple algorithms to find the best fit for your data. It tests models like XGBoost, LightGBM, Random Forests, and Logistic Regression, while fine-tuning parameters such as learning rate and tree depth through hyperparameter optimization. In some cases, the system creates a Stacked Ensemble by combining predictions from multiple models to boost accuracy. Training iterations usually take 2–3 minutes per model.
The platform also optimizes feature transformations tailored to churn prediction. For example, it applies one-hot encoding to categorical variables (e.g., "city" or "contract type") and generates derived features that uncover important data relationships. Depending on the dataset’s complexity, the entire training process – from initial analysis to algorithm selection – can range from a few minutes to several hours. These optimized models allow for straightforward performance comparisons.
Measuring Model Performance
After training, AutoML provides a leaderboard that ranks models based on the chosen evaluation metric. This leaderboard shows how each algorithm performed, using metrics like ROC AUC (which measures the model’s ability to distinguish between churners and non-churners) and F1 Score (which balances precision and recall).
- Precision measures how many customers predicted to churn actually did.
- Recall reflects the percentage of actual churners the model correctly identified.
If losing a customer is costly, focusing on recall helps capture more at-risk customers. On the other hand, if retention efforts are expensive, prioritizing precision ensures you target the right audience. In mobile churn prediction, AutoML models often achieve accuracy rates of 93% or higher. Tools like confusion matrices and SHAP (SHapley Additive exPlanation) plots also help identify which features – such as customer service interactions or contract duration – are driving the predictions.
"AutoML simplifies the process of applying machine learning to your datasets by automatically finding the best algorithm and hyperparameter configuration for you." – Databricks
Using AutoML Churn Predictions
After training, AutoML assigns each customer a risk score between 0 and 1, indicating how likely they are to churn. These scores help prioritize retention efforts and allocate resources where they’ll make the most difference. Here’s how to turn those predictions into actionable risk scores.
Creating Churn Risk Scores
AutoML platforms generate individual risk scores, letting you rank customers by their likelihood of leaving. You can set a threshold – often called an "operating point" – to classify customers as high-risk. For example, a threshold of 0.7 flags high-risk customers for intervention. In a telecom analysis using Google AutoML, this approach achieved an 88.6% precision, meaning 9 out of 10 flagged predictions were accurate.
Choosing the right threshold depends on balancing costs. If losing a customer is expensive, a lower threshold may be better to catch more at-risk individuals. On the other hand, if retention efforts are costly, a higher threshold can improve precision. Many teams also focus on creating a "Top 25" high-risk list to concentrate resources on the most critical accounts.
AutoML platforms often include explainability tools like SHAP, which help identify why a customer is flagged as high-risk – whether it’s due to high monthly charges, low tenure, or other factors. Some platforms even provide rolling propensity scores (e.g., over 15, 30, or 45 days) to help time retention efforts more effectively.
"The ability to predict that a particular customer is at a high risk of churning, while there is still time to do something about it, represents a huge potential revenue source for every online business."
– Gayatri Ghanakota and Sarita Joshi, AWS Professional Services
These scores lay the groundwork for targeted retention strategies.
Building Retention Campaigns from Predictions
Churn predictions allow you to design retention strategies tailored to both risk levels and customer value. For instance, high-value customers at high risk might receive personalized VIP-level outreach, such as calls from a dedicated account manager, exclusive loyalty perks, or early access to new features. Meanwhile, low-value but high-risk customers can be targeted with automated email campaigns or discount codes.
Real-time data also plays a role. Alerts triggered by behaviors like reduced login frequency or app uninstalls allow businesses to intervene before customers leave. Considering that acquiring a new customer costs five times as much as retaining an existing one, and cutting churn by just 5% can increase profits by 25% to 95%, these efforts are well worth it.
Retention efforts should address the root causes of churn. For example, if repeated service calls are a major issue, resolving those concerns will likely be more effective than simply offering discounts. A great example is Hydrant, a wellness brand that used a pilot model from Pecan to identify at-risk long-term subscribers. By tailoring their messaging and offers, they achieved a 260% higher conversion rate and a 310% boost in revenue per customer.
"Incentives are often much more cost effective than losing and reacquiring a customer."
– AWS SageMaker Documentation
Here’s a quick summary of retention strategies based on customer segment and risk level:
| Customer Segment | Risk Level | Recommended Retention Strategy |
|---|---|---|
| High-Value | High | VIP calls, loyalty perks, or account manager outreach |
| High-Value | Low | Referral programs, early product access, or rewards for advocacy |
| Low-Value | High | Automated email campaigns, personalized discounts, or in-app nudges |
| Low-Value | Low | Standard marketing emails and educational content |
To act quickly, connect AutoML outputs directly to marketing tools. This allows you to trigger personalized nudges or discounts as soon as a customer’s risk score crosses the threshold. Establishing a "churn task force" that includes marketing, sales, and customer success teams ensures that predictive insights lead to coordinated actions.
Updating and Improving Your Model
To keep your churn predictions accurate, your model needs regular updates. Customer behavior and market conditions are always changing, so retraining your model with fresh data is essential. Event-based retraining – triggered by new data or declining model performance – can be automated using tools like Amazon EventBridge.
Using a model registry to track and version your models helps monitor performance and ensures only the best-performing ones are deployed. Tools like MLflow or SageMaker Experiments make it easier to document and compare every step of the process, from training to tuning.
"Debugging a model is more about debugging the data than the model itself."
– Google Cloud Documentation
If your model behaves unexpectedly, start by checking the data. Look for missing, incomplete, or inconsistent values. For instance, if only 20% of your customers churn – a common imbalance – techniques like the Synthetic Minority Oversampling Technique (SMOTE) can help the model better learn the decision boundary during retraining. Always validate retrained models using a separate test set to ensure they perform well on real-world data.
Conclusion
Benefits of Using AutoML for Churn Prediction
AutoML simplifies and accelerates the process of building machine learning models, handling tasks like data preparation, feature engineering, algorithm selection, and hyperparameter tuning – all of which traditionally required skilled data scientists and significant time investment. By automating these steps, AutoML makes machine learning more accessible to business analysts and non-technical users through intuitive, code-free interfaces.
One of the standout advantages is speed. AutoML can evaluate multiple pipelines and test various algorithm combinations simultaneously, cutting development time from weeks to just hours. It’s also designed to handle large datasets efficiently, often leveraging ensemble methods to improve model accuracy. For instance, tools like Amazon SageMaker Autopilot have demonstrated churn prediction accuracy rates exceeding 93%.
"AutoML democratizes the machine learning model development process and empowers its users, regardless of their data science expertise, to identify an end-to-end machine learning pipeline for any problem."
– Microsoft Azure Machine Learning
Additionally, AutoML provides scalability and transparency by generating ready-to-deploy model artifacts along with detailed trial code, making it easier for teams to understand and implement the results.
How Growth-onomics Supports Data-Driven Retention

While AutoML delivers technical efficiency, its real value lies in how businesses apply the insights. Simply deploying churn prediction models isn’t enough – strategic execution is key. This is where Growth-onomics steps in, bridging the gap between machine learning outputs and actionable retention strategies. Through tools like Customer Journey Mapping, Performance Marketing, and Data Analytics, Growth-onomics transforms churn risk scores into targeted campaigns (https://growth-onomics.com).
The agency prioritizes data quality and integrity, addressing challenges like data leakage and training-serving skew, which can otherwise derail model performance in production. They also guide businesses in optimizing models to balance precision and recall, helping companies decide whether to focus on accurately identifying at-risk customers or casting a broader net to capture as many as possible. These decisions are tailored to the business’s specific costs of customer loss versus retention incentives.
FAQs
How much data do I need to predict churn with AutoML?
When it comes to churn prediction using AutoML, the size and quality of your dataset play a key role. Typically, having data for about 7,000 users, including both those who have churned and those who haven’t, is enough to create reliable models. However, the exact requirements can shift depending on factors like how detailed your features are and the overall quality of the data.
How do I choose the right churn score threshold?
Choosing the right churn score threshold is crucial for striking a balance between false positives and false negatives. To make an informed decision, use metrics like Precision, Recall, and the F1 Score to evaluate your model’s performance. Additionally, take a closer look at the ROC curve and Precision-Recall curves to understand your model’s behavior at different thresholds. Testing various thresholds can help you find the sweet spot that aligns with your business objectives – whether that’s optimizing customer retention, managing resources effectively, or keeping misclassification costs as low as possible.
How often should I retrain a churn prediction model?
The best schedule for retraining a churn prediction model largely depends on your business dynamics and how often your data changes. Generally, retraining the model monthly or quarterly is a good practice. This allows it to adjust to evolving customer behaviors and shifting data trends. Frequent updates help maintain the model’s accuracy and ensure it continues to perform well.