

Which model is better for predicting customer lifetime value (LTV)? It depends.
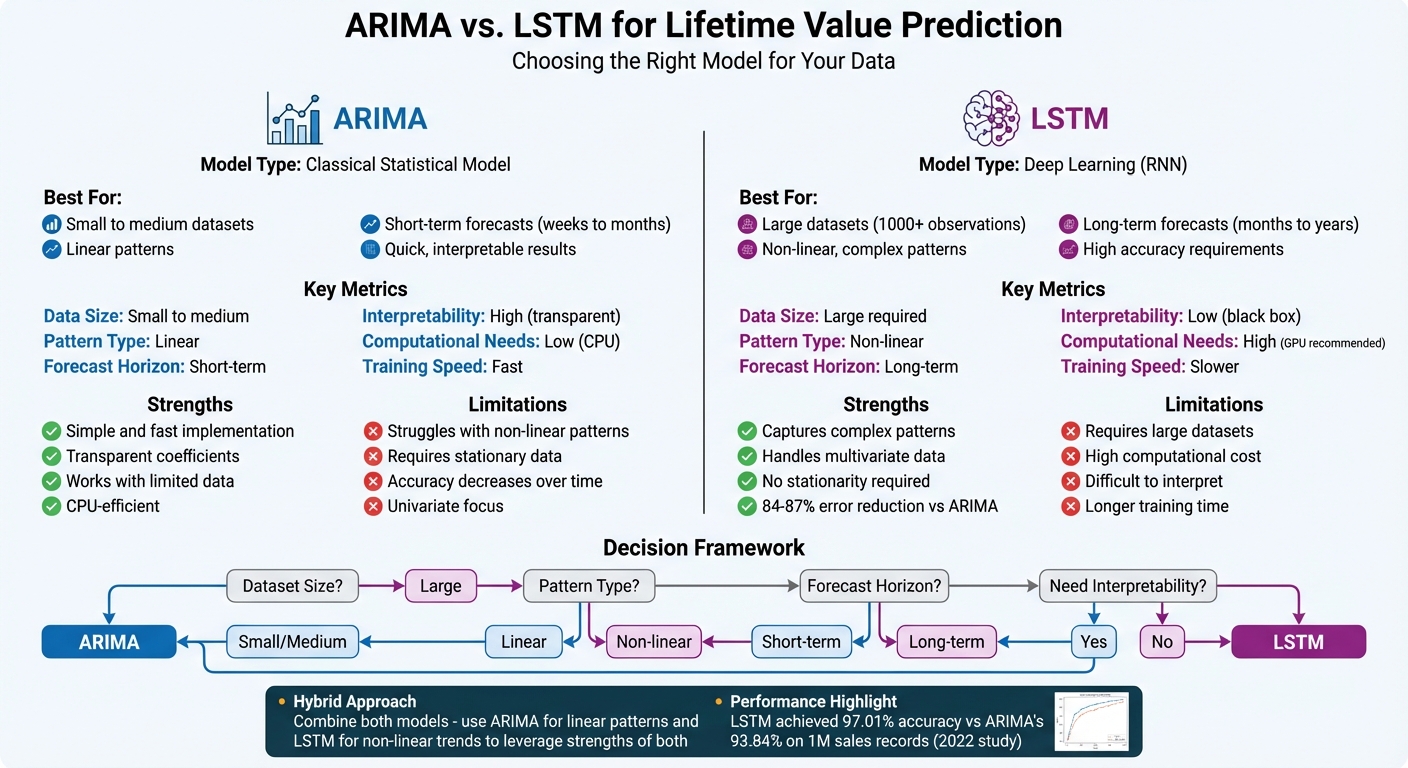
- ARIMA is a statistical model that works well with small datasets and short-term forecasts. It’s faster, simpler, and more transparent but struggles with non-linear patterns and long-term predictions.
- LSTM is a deep learning model that handles large datasets, complex patterns, and long-term trends. However, it requires more data, computational power, and is harder to interpret.
Key Takeaways:
- Use ARIMA for smaller datasets, linear trends, or when you need quick, interpretable results.
- Choose LSTM for large datasets, non-linear behaviors, or long-term forecasts.
- A hybrid approach (ARIMA for linear patterns, LSTM for non-linear trends) can combine their strengths.
Quick Comparison:
| Feature | ARIMA | LSTM |
|---|---|---|
| Data Size | Small to medium datasets | Large datasets required |
| Pattern Type | Linear patterns | Non-linear patterns |
| Forecast Horizon | Short-term | Long-term |
| Interpretability | Transparent | Black box |
| Computational Needs | Low (CPU) | High (GPU recommended) |
The choice depends on your data size, complexity, and prediction goals. Start with ARIMA for simplicity, and switch to or combine with LSTM if ARIMA falls short.
ARIMA vs LSTM Models for Customer Lifetime Value Prediction Comparison
COMPARING LSTM AND ARIMA FOR FORECASTING (WHEN TO USE WHAT?)
What is ARIMA for Lifetime Value Prediction
ARIMA, short for AutoRegressive Integrated Moving Average, is a statistical model designed to forecast future values by analyzing patterns and relationships in historical data. Essentially, it uses past customer transactions to predict future purchasing behavior or revenue trends.
The model revolves around three core parameters: p, d, and q. Here’s what they mean:
- p (Lag Order): Captures the relationship between current and past observations.
- d (Differencing): Helps stabilize the data by removing trends or seasonality.
- q (Moving Average): Adjusts for past forecasting errors to improve predictions.
As Uppala Meena Sirisha from IEEE explains:
ARIMA explains the time series under consideration on the basis of its previous values, that is, its lags and the lagged prediction errors.
One critical aspect of ARIMA is stationarity. For the model to work effectively, the data must have a consistent mean and variance over time. If your Lifetime Value (LTV) data shows trends or fluctuations, you might need to apply techniques like differencing or logarithmic transformations. The Augmented Dickey-Fuller (ADF) test is commonly used to confirm stationarity – a p-value of 0.05 or less indicates the data is ready for modeling.
The importance of stationarity is evident in real-world applications. For instance, a 2022 study applied ARIMA (parameters: 2, 1, 2) to a dataset of 1 million sales records spanning 1972–2017. The model achieved an accuracy of 93.84%. However, it’s worth noting that a Long Short-Term Memory (LSTM) model later improved accuracy to 97.01%.
| Parameter | Name | Role in LTV Prediction |
|---|---|---|
| p | Lag Order | Captures dependencies between current and past data |
| d | Differencing | Stabilizes the mean by removing trends and seasonality |
| q | Moving Average | Refines predictions by accounting for past errors |
ARIMA Advantages
ARIMA shines due to its simplicity and efficiency. As Vivek Kumar Upadhyay highlights:
The ARIMA model is simpler and faster to implement and train than the LSTM model, as it does not require a large amount of data, a complex architecture, or a powerful hardware.
This makes ARIMA an accessible option for businesses without access to expensive GPU hardware or extensive datasets. It’s particularly effective for smaller datasets, where deep learning models might overfit. For newer companies or niche customer segments with limited historical data, ARIMA can be a practical choice.
Another key strength is interpretability. Unlike black-box algorithms, ARIMA provides transparency, allowing you to clearly see how each parameter influences the forecast. This makes it easier to explain predictions to stakeholders and justify decisions based on the model’s output.
ARIMA Limitations
However, ARIMA has its drawbacks. Its reliance on linear relationships makes it less effective for handling non-linear patterns. Modern customer behaviors often involve sudden changes, seasonal trends, or complex interactions across variables – areas where ARIMA struggles.
The requirement for stationarity adds another layer of complexity. Preparing the data involves steps like differencing, testing, and validation, which can be time-consuming. If your data shows exponential growth or high volatility, achieving stationarity might require multiple transformations.
Another limitation is ARIMA’s performance over long forecasting horizons. While it excels at short-term predictions, its accuracy diminishes as you project further into the future. For businesses needing long-term LTV forecasts, this can be a critical issue. Research shows that LSTM models often outperform ARIMA in such cases, reducing error rates by 84% to 87% on average when tackling complex forecasting tasks.
What is LSTM for Lifetime Value Prediction
Long Short-Term Memory (LSTM) is a specialized type of Recurrent Neural Network (RNN) designed to analyze time-based patterns, making it an excellent tool for predicting customer lifetime value (LTV). Unlike simpler models like ARIMA, LSTM uses memory cells and gates to manage information flow, allowing it to handle complex, time-dependent data more effectively.
At the heart of LSTM’s architecture are three key gates that regulate how information is processed:
- Forget Gate: Decides which past data to discard, with outputs ranging from 0 (completely ignore) to 1 (completely retain).
- Input Gate: Determines which new information should be added to the memory, using a combination of sigmoid and tanh functions to filter and create candidate values.
- Output Gate: Controls what information is passed to the next stage, ensuring only relevant patterns are carried forward by applying sigmoid and tanh transformations.
"The major challenge with a typical generic RNN is that these networks remember only a few earlier steps in the sequence… This challenging problem is solved using the ‘memory line’ introduced in the Long Short-Term Memory (LSTM) recurrent network".
What sets LSTM apart for LTV prediction is its ability to capture non-linear patterns. While models like ARIMA assume linear relationships, LSTM can handle abrupt changes in customer behavior, seasonal trends, and intricate interactions among variables. It seamlessly integrates factors like cohort data, customer age-in-system, and real-time events, making it highly effective for forecasting dynamic LTV.
For example, in December 2024, Meta Platforms implemented a Rolling LTV forecast for Meta Quest VR users. By using a dilated RNN (dRNN) – a variation of LSTM – they predicted gross revenues over 1, 4, 13, and 26-week periods. This model achieved an adjusted Symmetric Mean Absolute Percentage Error (aSMAPE) of 22.9% for 4-week forecasts, outperforming traditional Buy Till You Die (BTYD) models, which had an error rate of 53.6%. Similarly, Uber Technologies employed a 2-cell LSTM RNN with city-encoding embeddings to predict Acquisition LTV (user value from day 0 to day 90). Their model achieved a Root Mean Squared Error (RMSE) of 2,271, compared to 2,292 with XGBoost.
LSTM Advantages
LSTM offers several advantages that make it a standout choice for LTV prediction:
- Captures Complex Patterns: Unlike traditional models, LSTM excels at identifying non-linear relationships, such as irregular purchase cycles, sudden shifts in preferences, or multi-variable interactions. This ability leads to significantly lower error rates compared to ARIMA, especially when dealing with dynamic customer behaviors.
- Handles Large Datasets: LSTM is well-suited for processing large volumes of high-frequency data, even when the data includes constant fluctuations. Unlike ARIMA, which requires extensive preprocessing to stabilize trends and seasonality, LSTM can work directly with raw data.
- Integrates Diverse Features: The model can incorporate a wide range of inputs – like demographics, behavioral triggers, and seasonal factors – without requiring extensive manual feature engineering. For instance, Meta’s dRNN model utilized over 100 features to achieve superior accuracy.
- Models Long-Term Dependencies: Thanks to its memory cells and gating mechanisms, LSTM can retain and use patterns from far in the past. This makes it particularly valuable for industries like subscription services or gaming, where early user actions strongly influence future value.
"The inclusion of memory cells and gating mechanisms enables LSTMs to selectively forget or remember past information, making them adept at handling the non-linear and dynamic aspects of retail sales data".
LSTM Limitations
Despite its strengths, LSTM does come with some challenges:
- High Computational Requirements: Training LSTM models demands powerful GPUs and significant computing resources. For smaller businesses, this can make implementation costly and time-intensive, with training often taking hours or even days depending on the dataset size.
- Lack of Interpretability: LSTM operates as a "black box", making it difficult to explain how specific customer behaviors influence predictions. Unlike ARIMA, which provides clear parameter values, LSTM’s internal processes are harder to interpret – posing challenges when justifying decisions to stakeholders.
- Data Demands: LSTM requires large datasets to learn effectively and avoid overfitting. Companies with limited historical data, such as startups or niche markets, may find it difficult to achieve accurate predictions. Additionally, optimizing the number of training epochs can be inconsistent, requiring extensive experimentation to fine-tune the model.
While LSTM’s capabilities make it a powerful tool for LTV prediction, these limitations highlight why it may not be the best fit for every organization.
sbb-itb-2ec70df
ARIMA vs. LSTM: Main Differences
When deciding between ARIMA and LSTM for lifetime value (LTV) prediction, it’s important to grasp how these two methods differ in their data handling, modeling techniques, and resource demands. Each has unique strengths and limitations that make them suitable for different scenarios.
Data Requirements
ARIMA shines when working with small to medium datasets, especially for short-term forecasts. On the other hand, LSTM thrives on large datasets, as it needs substantial data to identify complex patterns. However, it struggles with smaller datasets, often leading to overfitting. For example, in a stock exchange experiment using 3,201 observations, ARIMA outperformed LSTM because the dataset was too limited for a deep learning model to perform effectively.
Modeling Approach
The two models also differ in how they interpret and process data. ARIMA relies on linear relationships and requires stationarity, which often involves data transformation like differencing. In contrast, LSTM can handle both stationary and non-stationary data, capturing intricate non-linear relationships. A study on financial time series spanning January 1985 to August 2018 by Sima Siami-Namini and colleagues demonstrated LSTM’s effectiveness, reducing error rates by 84% to 87% compared to ARIMA across indices like NASDAQ and S&P 500.
Interpretability and Complexity
ARIMA’s simplicity and transparent coefficients make it highly interpretable, a key factor in industries like central banking where explainability is critical. Meanwhile, LSTM operates more as a "black box", making it harder to interpret despite its ability to handle multivariate data and uncover complex patterns.
| Feature | ARIMA | LSTM |
|---|---|---|
| Model Type | Classical statistical model | Deep learning (RNN) |
| Data Volume | Small to medium datasets | Requires large datasets |
| Relationships | Assumes linear relationships | Captures non-linear patterns |
| Stationarity | Requires stationary data | No stationarity needed |
| Variables | Primarily univariate | Naturally multivariate |
| Interpretability | High (explainable coefficients) | Low ("black box") |
| Training Speed | Fast and CPU-efficient | Slower; often needs GPU |
Computational Infrastructure
In terms of resource demands, ARIMA is lightweight and can run efficiently on CPU-only systems, making it a cost-effective choice for organizations with limited computational resources. LSTM, however, requires far more processing power, often needing GPU acceleration for training, which increases both costs and implementation time. Vivek Kumar Upadhyay, an AI Technical Professional, highlights this distinction:
"The ARIMA model is more interpretable and explainable than the LSTM model, as it has a clear mathematical formulation and a well-defined parameter estimation method".
These differences make it clear that choosing the right model depends on your specific needs, including data size, complexity, and the resources available for implementation. By weighing these factors, you can determine which approach is better suited for your LTV prediction goals.
How to Choose Between ARIMA and LSTM
Deciding between ARIMA and LSTM for forecasting depends largely on the nature of your data and the type of predictions you need.
Data volume plays a huge role. If you’re working with a smaller dataset – say, a few hundred to a few thousand data points – ARIMA is your go-to. It performs well with limited data and doesn’t require the massive datasets that LSTM thrives on. LSTM, on the other hand, needs thousands of observations to effectively pick up on complex patterns. Without enough data, it might actually perform worse than simpler models.
Pattern complexity is another key factor. ARIMA is perfect for capturing straightforward, linear trends, making it ideal for predictable customer behavior. But if your data involves intricate, non-linear patterns – like sudden spikes in engagement, feedback loops, or erratic buying habits – LSTM is better equipped to handle that complexity. Research even shows that LSTM can produce much lower error rates than traditional models in these scenarios.
Forecast horizon matters too. ARIMA shines when you’re making short-term predictions, typically a few weeks or months ahead. As Joao Vitor Matos Goncalves and colleagues observed:
The ARIMA model predicts better data points that are closer to the training data, as it loses predictive power as the forecast window increases.
For longer-term forecasts spanning several months or even years, LSTM tends to outperform ARIMA. In one study involving Meta Quest, for example, a 26-week forecast showed that dRNN maintained a 51.2% error rate, while BTYD models’ errors climbed to 78.3%.
Interpretability requirements can also influence your choice. If you need to explain predictions clearly – whether for regulatory reasons or to present to stakeholders – ARIMA is a better fit. Its mathematical framework is transparent and easy to understand. LSTM, however, operates more like a "black box", which can make it harder to justify specific predictions, even if it’s more accurate.
For datasets with mixed characteristics, combining both models might be the smartest option. Halima Fatima and her team suggest:
The hybrid model is proposed to use the merits of the two methodologies whereby the ARIMA will deal with the linear bits of the time series, and LSTM models will deal with the non-linear bits.
This hybrid approach lets ARIMA handle the seasonal and linear aspects of the data, while LSTM captures the more complex, non-linear patterns. Together, they can reduce errors more effectively than either model alone. By aligning your model choice with the size, complexity, and goals of your dataset, you can achieve more accurate and reliable LTV predictions.
Conclusion
Deciding between ARIMA and LSTM for lifetime value (LTV) prediction boils down to aligning the model with your specific business needs and data characteristics.
ARIMA is a solid choice if you’re working with smaller datasets, need quick results, or require easily interpretable outputs. It’s especially suited for short-term forecasts in stable and predictable environments. The model’s simplicity and transparency make it ideal when you need to explain predictions to stakeholders or meet regulatory requirements.
On the other hand, LSTM is the go-to when accuracy is paramount, particularly with large and complex datasets. If your data involves non-linear trends, sudden changes, or long-term dependencies, LSTM tends to outperform ARIMA. Research shows LSTM can reduce error rates by 84%-87% compared to ARIMA, making it better equipped to handle intricate, non-linear patterns.
A practical approach is to start with ARIMA as a baseline. It’s faster to implement and can help you grasp the fundamental structure of your data. If ARIMA falls short – especially for longer-term forecasts or volatile markets – consider switching to LSTM. In some cases, combining both models in a hybrid approach might yield the best results.
Ultimately, your choice should reflect your data’s size, pattern complexity, forecasting timeframe, and business objectives. By selecting the right model, you’ll create LTV predictions that empower smarter decisions and fuel growth.
FAQs
Which model should I use for lifetime value prediction: ARIMA or LSTM?
When deciding between ARIMA and LSTM, it’s all about the nature of your data and what you hope to achieve. If your dataset is relatively small, exhibits a linear trend, or has clear seasonality that can be made stationary, ARIMA is a solid choice. It’s straightforward, quick to train, and delivers results that are easy to interpret – perfect for basic time series analysis.
On the other hand, if your data shows non-linear behavior, irregular fluctuations, or long-term dependencies (like tracking customer lifetime value with unpredictable signals), LSTM is the better option. It’s designed to capture complex patterns, manage multiple input features, and handle non-stationary data. However, keep in mind that LSTM models demand more computational power and expertise to get right.
A good approach? Start with ARIMA for simpler datasets. If you encounter high error rates or notice patterns that ARIMA struggles to explain, it might be time to explore LSTM for more accurate and nuanced results.
Can ARIMA and LSTM work together for more accurate lifetime value predictions?
Combining ARIMA with LSTM can boost the accuracy of lifetime value (LTV) predictions. ARIMA is well-suited for identifying and modeling linear trends and seasonal patterns, while LSTM specializes in uncovering complex, non-linear relationships in the data. By blending these two approaches, ARIMA can first address the linear components, and the residuals can then be fed into LSTM to capture the remaining non-linear patterns.
This hybrid method takes advantage of the strengths of both models, leading to more dependable forecasts. For businesses like Growth-onomics, this approach can refine LTV prediction pipelines by merging statistical accuracy with advanced deep-learning techniques, providing richer insights into customer behavior and enabling smarter decision-making.
What resources are needed to train an LSTM model effectively?
LSTM models demand a lot more computational power compared to traditional approaches like ARIMA. This is because they rely on deep learning frameworks and process extensive datasets through intricate calculations. To train an LSTM efficiently, you’ll typically need a modern GPU (or a multi-core CPU for less intensive tasks), at least 8 GB of RAM, and enough disk space to store datasets and model weights.
These models thrive on large datasets since they require substantial data to recognize and learn complex patterns over time. If you’re working with smaller datasets, simpler models such as ARIMA might be a better fit. Training time can vary widely based on factors like dataset size and hyperparameter settings (e.g., epochs, batch size). For smaller datasets, training might take just a few minutes, but for larger ones, it could stretch into several hours. To ensure smooth training for tasks like lifetime value prediction, it’s a good idea to have a system equipped with 4–8 GB of GPU memory and 16 GB of CPU RAM.