

Understanding how competitors adjust their paid advertising during seasonal peaks can help you make smarter decisions about your campaigns. Here’s the core takeaway:
- Competitors often increase ad spend significantly during high-demand periods like Black Friday or back-to-school seasons.
- Tools like SEMrush and SpyFu can provide historical data on paid traffic trends, CPC, and ad performance.
- Launching ads 2-3 weeks before competitors can lower CPC and improve returns.
- Breaking down traffic by channels (search, social, display) reveals where competitors focus their budgets, which is a key part of performance marketing strategy.
- Aligning seasonal keyword trends with competitor data helps identify opportunities and avoid costly bidding wars.
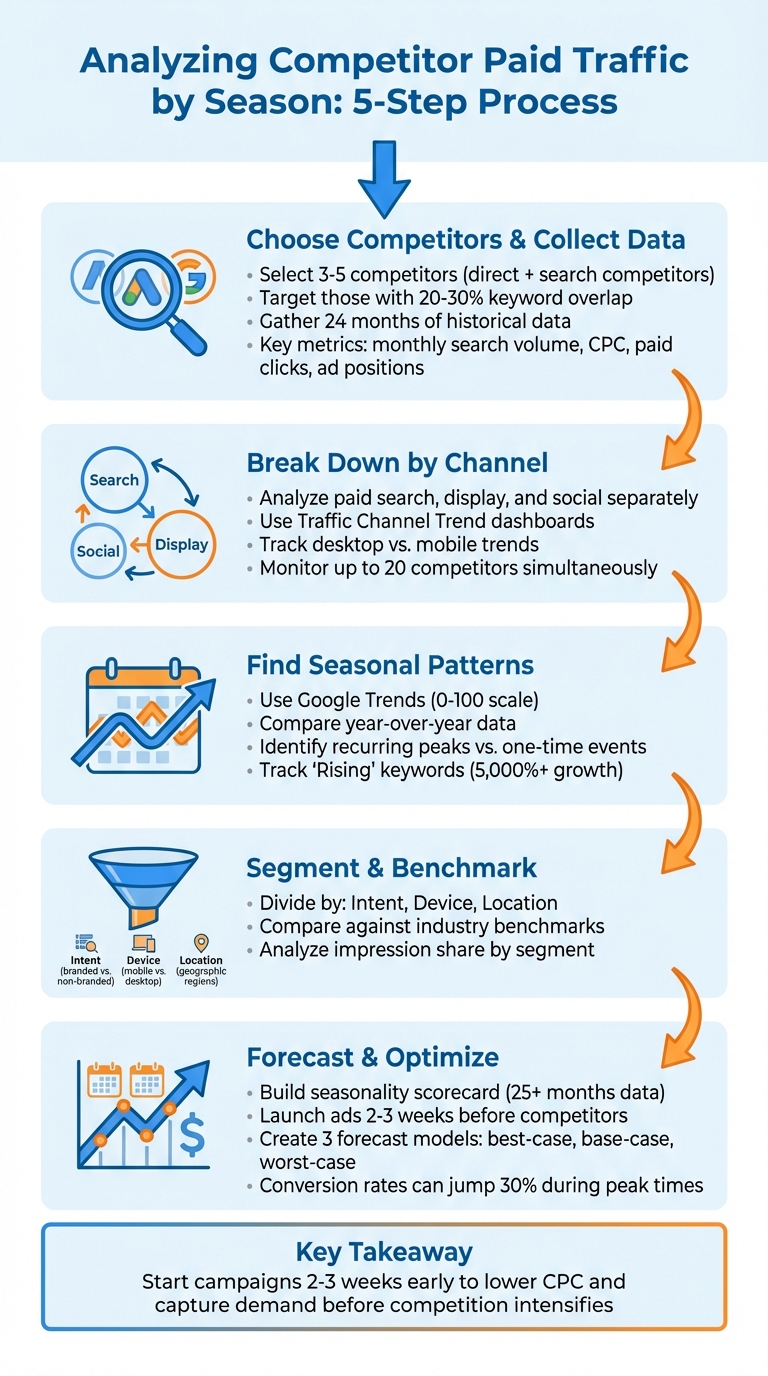
5-Step Process for Analyzing Competitor Seasonal Paid Traffic
Step 1: Choose Competitors and Collect Their Paid Traffic Data
How to Select Competitors for Analysis
Start by pinpointing 3–5 competitors who actively invest in seasonal paid advertising. Aim for a mix of direct competitors (those offering the same products or services as you) and search competitors (businesses that may not directly compete with you but aggressively bid on the same seasonal keywords).
Focus on competitors that show clear seasonal spikes in ad spending. Use Google Ads Auction Insights reports from last year’s peak seasons to identify domains with high overlap and top-of-page rates. Prioritize those who share at least 20–30% of your core seasonal keywords. Another clue? Competitors that create dedicated seasonal landing pages (like /holiday-deals or /summer-collection) are likely serious about driving seasonal traffic.
It’s also helpful to include both market leaders and direct peers. This gives you a balanced view of industry benchmarks. Pay close attention to competitors who ramp up their paid search budgets 4–8 weeks before seasonal events like Black Friday or back-to-school sales. This behavior reflects a proactive seasonal strategy that’s worth analyzing.
Once you’ve identified these key players, it’s time to dig into their historical paid traffic data.
How to Collect Historical Paid Traffic Data
To uncover seasonal trends, gather detailed historical data. Export at least 24 months of data to differentiate between recurring seasonal patterns and one-off fluctuations. Tools like SEMrush’s Advertising Research can provide a 12-month timeline of a domain’s ad activity for specific keywords in Google’s paid search results. This includes the coverage percentage, which shows how often an ad appeared in the top eight paid positions.
For a deeper dive, SEMrush’s Traffic & Market Toolkit offers dashboards like Traffic Overview and Traffic Channel Trend. These break down traffic volumes and highlight spikes across channels such as paid search, paid social, and display ads.
Key metrics to track include monthly search volume, average CPC, paid clicks, and ad positions. SEMrush estimates these metrics using clickstream data from over 200 million internet users, processed through advanced algorithms. To refine your analysis, filter this data by device type, geographic region, and specific timeframes to identify seasonal trends. Export your findings to Excel or CSV format for year-over-year comparisons and to build custom seasonality scorecards for later use.
sbb-itb-2ec70df
Step 2: Break Down Competitor Paid Traffic by Channel
Analyze Paid Search, Display, and Social Channels Separately
Once you’ve gathered historical data, the next step is to break it down by advertising channel. This allows you to see how competitors allocate their budgets across platforms during peak seasons. Aggregated data can mask these patterns, but separating it by channel – paid search, display, and social – provides a clearer picture.
SEMrush offers tools to help with this. Use its dedicated charts to isolate data for each channel by selecting the relevant tabs for paid search, paid social, and display ads. This segmentation reveals which platforms are driving the most traffic during specific times. For example, a competitor might ramp up paid search campaigns in November for Black Friday sales but shift to paid social in early January to promote holiday clearance events.
The Paid Social Dashboard provides even more detailed insights. It highlights which social platforms, such as Facebook, Instagram, or LinkedIn, are being prioritized. Traffic volume diagrams make it easy to spot seasonal shifts. If you notice a spike in Instagram traffic during a particular month, it could indicate a seasonal campaign worth deeper analysis.
For paid search, use the Top Pages report filtered by paid search data to identify competitor landing pages and promoted products. For instance, if a competitor consistently runs a /summer-sale page from May to July, that’s a seasonal strategy you can track. The EyeOn tool is another valuable resource, allowing you to monitor ad texts and see whether campaigns are running on Google Search or social platforms. You can even track up to 20 competitors simultaneously for real-time updates on promotional changes.
A useful case study: In May 2025, SEMrush analysis of Nike.com showed that a landing page for "Jordan Dydrip Big Kid Sandals" attracted significant organic social traffic. By filtering the Top Pages dashboard with the keyword "sandals" and the social channel, analysts identified Nike’s seasonal focus on spring and summer products.
Developing a comprehensive SEO content strategy by breaking down these trends by channel is a critical step before moving on to visualize seasonal traffic patterns. It ensures a detailed understanding of how competitors are leveraging each platform.
Create Charts Showing Traffic Volume and Cost Trends
After isolating the data by channel, the next move is to visualize these trends. Raw numbers can only tell you so much – charts and graphs make it easier to spot seasonal shifts. Use visual tools to map metrics like traffic volume, cost-per-click (CPC) changes, and overall performance over time. With the Traffic Trend graph in SEMrush, you can hover over specific dates to see exact visitor counts, helping you link traffic spikes to seasonal events or key product launches.
The Desktop vs. Mobile Trend graphs in the Paid Social Dashboard can also provide valuable insights. For example, if a competitor’s mobile traffic surges in December, it might indicate a focus on holiday shoppers who are browsing on-the-go. This could be a signal to optimize your own mobile landing pages for the same period.
Line graphs are especially helpful for spotting patterns. For instance, an increase in traffic volume alongside a drop in CPC might mean competitors are targeting less competitive keywords or ad placements. On the flip side, a spike in CPC during peak seasons could point to more intense competition for ad space.
To uncover new trends, check the "Newly Detected" tab in the Top Pages dashboard and filter by paid traffic. If you notice a new landing page receiving heavy traffic in early September, it could be tied to back-to-school promotions. Plotting these findings on a timeline can help you build a calendar of recurring competitor campaigns.
Here’s a quick overview of SEMrush tools you can use for this analysis:
| Dashboard/Tool | Primary Function | Key Metrics Provided |
|---|---|---|
| Traffic Channel Trend | High-level breakdown of all traffic sources | Visits by search, social, display, referral |
| Paid Social Dashboard | In-depth analysis of social paid traffic | Top social sources, desktop vs. mobile trends, trending URLs |
| Top Pages | Identifies landing pages for paid traffic | Unique visitors per page, channel-specific traffic filters |
| EyeOn | Real-time ad content monitoring | Timeline of ad texts, platform-specific promo alerts |
Step 3: Find Seasonal Patterns in the Data
Compare Competitor Traffic with Seasonal Keyword Data
After analyzing traffic trends for specific channels, the next step is to align these trends with search demand data. Tools like Google Trends can help you uncover seasonal patterns by entering competitor brand names or product lines as search terms. Set the timeframe to "Past 5 years" to spot recurring cycles and differentiate them from one-time events.
Google Trends uses a scale of 0 to 100 to indicate search interest, with 100 representing peak popularity. Look for trends where search interest increases during certain times of the year. For instance, if searches for "waterproof hiking boots" steadily rise from April to June, it could indicate preparation for the summer hiking season.
"Incorporating your competitors’ websites or brand names as additional search terms… will unveil which keywords enjoy enduring popularity and which might be subject to seasonal fluctuations." – Dmitrii Kustov, Marketing Director, Regex SEO
The "Related Queries" section in Google Trends can also reveal long-tail keyword variations that competitors may be targeting. For example, if "hiking boots" sees a surge, check if related terms like "lightweight hiking boots" or "best hiking boots for summer" are also trending. Use the "Rising" filter to identify breakout keywords – those experiencing explosive growth beyond 5,000%. If competitors are targeting these terms, act quickly to capture market share before competition intensifies.
Once you’ve identified seasonal keyword trends, validate them by comparing year-over-year data.
Use Year-over-Year Comparisons
Seasonal fluctuations can distort raw traffic data, so it’s essential to compare equivalent periods year-over-year. For example, compare July 2026 to July 2025 instead of comparing July to June. This approach filters out seasonal noise and highlights genuine growth or decline.
"If you’re seeing common peaks in this analysis, you can conclude that seasonality is likely a major factor in performance." – Alex Porter, Paid Search Marketing, Location3
To make these comparisons more actionable, create a table tracking traffic volume, cost-per-click (CPC), and return on ad spend (ROAS) over multiple years. For example, if CPC consistently rises in November but ROAS remains stable, it likely reflects increased competition during peak shopping periods. On the other hand, if ROAS drops significantly while CPC remains steady, it could point to issues with campaign execution rather than seasonality, which a Google Ads audit can help identify.
Normalize your data by calculating metrics per trading day. This adjustment accounts for differences in the number of weekends and holidays in a given month. For instance, dividing total sessions or revenue by the number of business days provides a clearer picture of performance trends.
| Signal | Likely Seasonal | Likely Structural Issue |
|---|---|---|
| YoY Gap | Small or within historical range | Down by significantly more than usual |
| Conversion Rate | Improves during seasonal peaks | Drops while qualified traffic remains stable |
| Brand Search | Follows general industry trends | Falls sharply compared to previous years |
| Paid Efficiency | ROAS dips slightly due to CPC pressure | CPC increases while ROAS declines |
Finally, use Google Ads’ Auction Insights to segment data by month or quarter. This will help you identify when competitors ramp up their efforts. For example, if a competitor’s impression share spikes in a specific month, it signals increased investment. Comparing their CPC trends to your own can reveal how competitive pressure affects costs over time.
Step 4: Segment Data and Compare Against Benchmarks
Divide Data by Intent, Device, and Location
Once you’ve identified seasonal patterns, the next step is to dig deeper by segmenting your data. This process helps uncover performance trends that might be hiding within broader metrics. Start by dividing your traffic data into branded and non-branded keywords. Branded keywords (those including competitor or product names) can indicate customer loyalty or existing interest, while non-branded terms (like general product or category searches) show how competitors are pulling in new traffic during busy seasons. Analyzing these separately can reveal which areas to focus on for growth.
Device segmentation is another key area. Break down competitor traffic by device type – mobile versus desktop – and look for patterns. Mobile users, for example, might show a sharp increase during a specific season, while desktop traffic remains steady. If mobile traffic spikes, consider strategies like optimizing your site for mobile users or tailoring ads for people on the go.
Geographic segmentation adds another layer of insight. Look at regional traffic to identify areas with untapped potential. Tools like Google Ads Auction Insights can help you measure impression share by location and reveal where competitors are investing their budgets. This can guide you toward regions that might be underserved or worth targeting.
"This allows us to break down vertical performance by device, demographics, and time of year – ensuring we don’t miss out on any opportunity." – Alex Porter, Paid Search Marketing
These refined segments set the stage for comparing your performance to industry benchmarks.
Compare Performance Against Industry Benchmarks
Once you’ve segmented your data, it’s time to measure it against industry benchmarks. This comparison can highlight areas where you’re excelling – or falling behind. For instance, Location3 analyzed a client’s data in September 2019 and found their outdoor yard ornament sales peaked in November and December, which aligned with seasonal trends. However, by digging deeper, they discovered another spike in May, tied to Mother’s Day. This insight allowed them to craft targeted ad copy like "Perfect Gifts for Mom" and "Get Your Yards Ready", while using Smart Bidding to capitalize on the increased conversion potential.
Another important metric to track is cost-per-click (CPC). By charting your CPC alongside competitors, you can identify whether rising costs are due to increased competition or broader market trends. For example, a spike in CPC combined with higher competitor impression shares might mean you’re facing direct pressure from rivals. In such cases, adjust your strategy with occasion-specific messaging that resonates with your audience and differentiates your brand.
Semrush For Analyzing Competitor Paid Traffic
Step 5: Use Insights to Forecast and Optimize Campaigns
Once you’ve identified seasonal patterns, the next step is to use those insights to forecast performance and fine-tune your campaigns.
Build a Seasonality Scorecard
A seasonality scorecard is your go-to tool for tracking how campaigns perform across different seasons. Start by gathering at least 25 months of data to spot recurring trends and separate them from one-off anomalies. The scorecard should focus on key metrics like year-over-year traffic share (to see if you’re gaining or losing ground during peak seasons), conversion rate changes (to identify when campaigns are most efficient), and efficiency indicators like CPC and CPA (to gauge competition costs).
Keep an eye on additional metrics such as average order value (AOV), lifetime value (LTV), and creative performance to pinpoint which seasonal themes resonate most with your audience. For example, conversion rates can jump by up to 30% during peak times, so it’s essential to document when these surges happen – not just for your campaigns but for your competitors as well.
"Seasonality analysis is about pattern recognition. It uncovers recurring spikes and dips in performance over time, helping you stop reacting and start planning." – Frederick Vallaeys, Co-Founder & CEO, Optmyzr
With these benchmarks in place, you can confidently move toward optimizing your campaigns.
Adjust Campaigns Based on Forecasted Trends
Insights from your scorecard should guide your next steps. Use the forecast data to ramp up budgets 2–3 weeks before peak season hits. This early preparation helps you build remarketing pools and sends positive signals to ad algorithms, ensuring you’re ready to capture demand before competitors dominate the space.
Tailor your strategies to the seasonal phase. During peak periods, allocate budgets to both acquiring new customers and reactivating past ones through high-intent formats like dynamic product ads and promotional videos. In quieter seasons, focus on growing your audience and testing new creative formats while CPCs are lower. Automated rules can also help by scheduling seasonal ad copy launches, ensuring your campaigns go live precisely when demand spikes. For short-term events (lasting one to seven days), use Google Ads’ seasonality adjustments feature to fine-tune Smart Bidding based on expected conversion rate changes.
To prepare for uncertainty, create three forecast models: one for a best-case scenario with high demand, one for a base-case reflecting the most likely outcome, and one for a worst-case scenario in case of a downturn. This approach ensures you allocate resources wisely without overcommitting your budget to unpredictable outcomes.
Conclusion
Breaking down competitor paid traffic by season gives you a solid edge when planning and running campaigns. By following these five steps, you can turn raw data into actionable seasonal strategies.
Make it a habit to track key metrics, note peak and off-peak periods, and tweak your campaigns accordingly. Understanding how competitors allocate their budgets and increase spending allows you to time your efforts perfectly – capturing demand before the market gets too crowded.
Let data take the lead in your marketing decisions. Skip the guesswork and rely on hard numbers to identify the ideal times to boost your budgets and focus on the right channels. This method helps cut unnecessary spending and ensures you get the most out of your investment.
Use these insights to fine-tune your planning process. Need some extra help? Growth-onomics offers expertise in performance marketing and data analytics. Their team can help you spot seasonal trends, optimize your campaign schedules, and create forecasting models that align with your business goals.
Start small – analyze one competitor and one channel. As you gain confidence, expand your approach. With the right techniques and support from Growth-onomics, you can stay ahead of the competition all year long.
FAQs
Which metrics best show seasonal shifts in competitor ad spend?
Tracking the right metrics can reveal how competitors adjust their advertising strategies during seasonal shifts. Start with ad spend and budget allocation – monitoring these figures over time can highlight when competitors ramp up or scale back their investments. Then, dive into traffic metrics like clicks and conversions, as these provide insight into how effectively those ads are driving engagement. Lastly, pay attention to ad performance indicators, such as impressions and ad placement, to understand which campaigns are gaining visibility and traction. Together, these metrics paint a clearer picture of how seasonal trends influence competitor activity.
How can I tell seasonality from a real performance problem?
To figure out whether a performance shift is tied to seasonality or signals a real problem, take a close look at historical data for patterns linked to holidays or industry cycles. Focus on key metrics like keyword rankings, conversion rates, and traffic share during different times of the year. Visual tools like charts can make it easier to spot consistent trends. By comparing current performance to past highs and lows, you can determine if the changes are part of a seasonal pattern or if they call for a deeper dive.
What’s the safest way to increase budget before peak season?
To get ready for peak season, gradually increase your budget based on insights from data. Tap into tools like historical data, analytics, and Google Trends to pinpoint important dates and plan your budget adjustments ahead of time. Focus on scaling up spending for your best-performing keywords and target audiences by 30-50%. This approach helps you take advantage of seasonal demand without risking unnecessary overspending. Keep a close eye on performance throughout these changes to ensure you’re staying efficient and avoiding waste.