If I had to boil this article down to one line, it’s this: CAC forecasts get better when I split customers into the right groups before I model costs.
The research points in one direction. When I move away from one blended CAC number and use behavioral, value-based, and channel or go-to-market segments, forecast accuracy improves by 25% to 40%. Some studies also report 92% segmentation accuracy from AI-based systems. The pattern is simple: better groupings lead to less noise, cleaner inputs, and tighter budget planning.
Here’s the short version:
- Blended CAC hides too much. It can mask weak channels and mix low-cost customers with expensive ones.
- Behavioral segments help most. Product usage, intent, activation, and conversion patterns often give the model the clearest signals.
- Value-based segments matter too. They separate customers by LTV, churn risk, and payback, which helps tie spend to return.
- Channel and motion splits matter for planning. A PLG motion and a sales-led motion can have very different CAC and payback.
- Timing matters. If spend and conversions are not matched by cohort or lag, CAC can look off.
- The model is only part of the story. Weekly use, fixed definitions, and regular retraining matter just as much.
A few numbers stand out:
- 25%–40% better CAC prediction from AI/ML models versus older forecasting approaches
- $940 CAC for median PLG segments versus $8,400 CAC for sales-led segments
- 15-month payback for PLG versus 29-month payback for sales-led
- 20%–35% higher CLV when spend is allocated by predicted customer value
- One case study showed 20% lower CAC, 240% more new customers, and 310% CLV growth
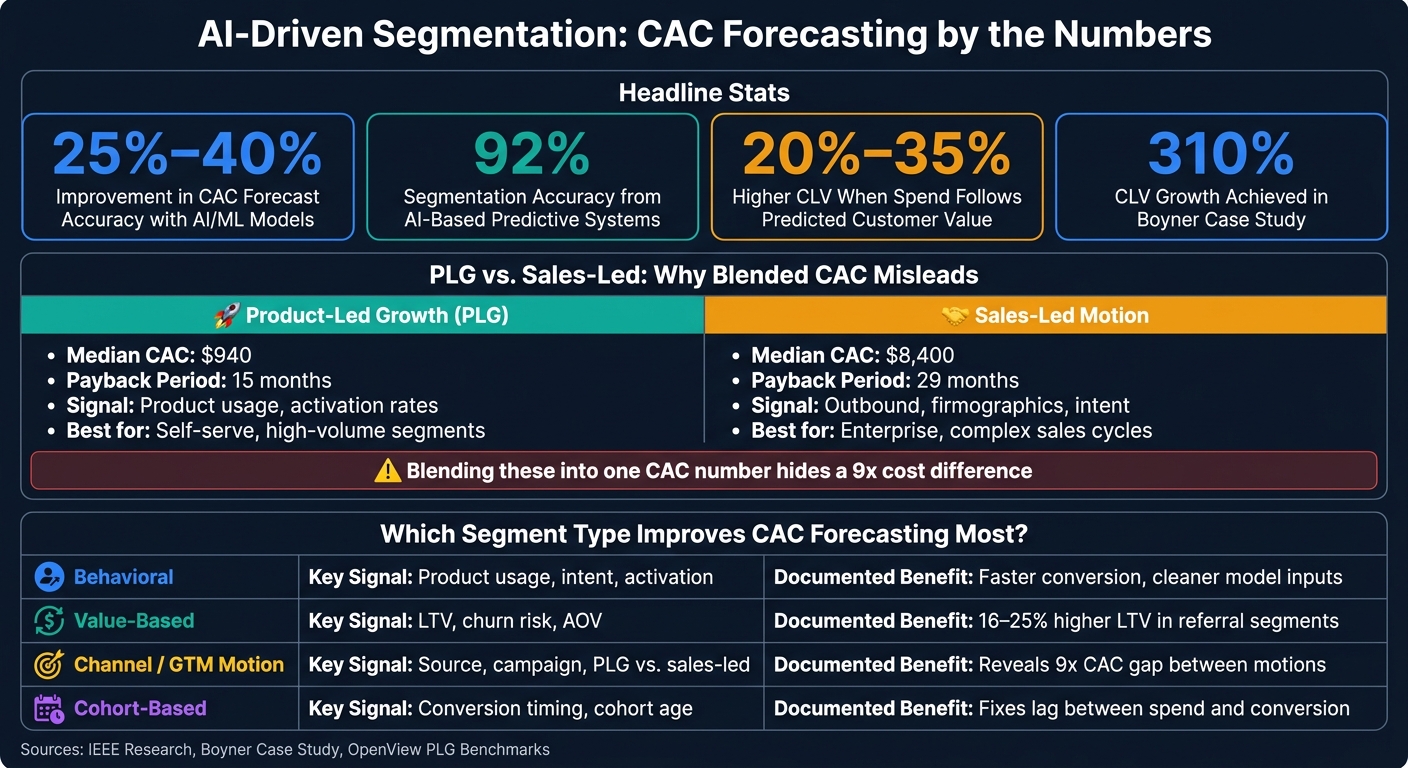
PLG vs. Sales-Led CAC: Key Metrics Compared by Segment Type
How to Build Customer Segments with AI (Real-World Use Case)
sbb-itb-2ec70df
Quick Comparison
| Segment Type | What it uses | Why it helps CAC forecasting | Example signal |
|---|---|---|---|
| Behavioral | Actions, usage, intent, activation | Shows who is more likely to convert and how fast | Product-qualified leads, feature use |
| Value-based | LTV, margin, churn risk, AOV | Ties acquisition cost to customer quality | High-LTV vs. low-LTV groups |
| Channel-based / GTM motion | Source, campaign, PLG vs. sales-led | Shows cost differences by acquisition path | Paid search vs. outbound sales |
| Cohort-based | Conversion timing, cohort age | Fixes lag between spend and conversion | Spend in June tied to customers won in August |
If you’re using CAC for budgeting, the big takeaway is clear: one average is not enough. I should compare CAC inside stable segments, keep definitions fixed, and use cohort-aware inputs so my forecast lines up with how customers are won in the first place.
What Recent Research Says About Segmentation and CAC Prediction
Recent research points in the same direction: CAC forecasts get better when models use segment-level data instead of one blended average [1][2]. The reason is pretty simple. When you split customers by behavior and value before making a forecast, the model sees cleaner patterns and makes better calls.
Researchers also suggest grouping by acquisition motion and customer type instead of leaning on one all-in CAC figure [1]. That matters because blended numbers can hide what’s working and what’s draining spend. In the studies reviewed, random forests, gradient boosting, and neural networks improved CAC prediction accuracy by 25% to 40% compared with historical methods [2].
So the main issue isn’t whether CAC can be measured. It’s whether segment-level inputs lead to forecasts that are meaningfully better.
Findings From Machine Learning CAC Models
Traditional CAC formulas depend on historical averages [2]. That works up to a point, but averages can get stale fast. Machine learning models work differently. They retrain on fresh data, so they can adjust when market conditions change or pricing shifts in ways static spreadsheet models often miss [2].
An IEEE research study found that AI-based predictive systems can improve client segmentation accuracy to 92% [2]. These models also improve segmentation accuracy and lift revenue forecasts. Just as important, segment-level features reduce noise in the forecast.
Put another way, the lift doesn’t come from swapping in a fancy model and hoping for the best. It comes from giving that model better inputs: cleaner behavior signals, clearer value signals, and less distortion from a single blended CAC number.
Why Behavioral and Value-Based Segments Produce Better Results
Behavioral segments pick up real engagement patterns that blended averages tend to wash out, while value-based segmentation separates efficient acquisition from expensive churn [2]. Used together, these segment types give forecasting models sharper inputs than demographic segments alone.
Think of it like looking at a sales dashboard with the blur removed. Instead of one average that hides the story, the model can see which groups convert well, which ones cost more to win, and which ones are likely to churn.
The Boyner case shows this in practice. It found that value-based segmentation can cut CAC when budget allocation follows high-value customer patterns [2].
The next step is to look at how those segment signals feed into forecasting models.
How AI-Driven Segmentation Improves CAC Forecasting Models
These segment types help forecasts only if you turn them into steady model inputs. That’s the key point.
When you feed segment-level inputs into a CAC model, you cut down noise and get a steadier forecast. A single blended CAC number can blur what’s going on underneath. Worse, it can hide the fact that one channel is quietly covering another channel’s losses.
Segmentation Methods Used in the Research
Recent studies point to a few methods that lead to better segment definitions for CAC forecasting.
Propensity and tree-based models estimate how likely a customer is to convert. They work well at the individual or account level, especially when you need to apply segmentation across a large set of leads or accounts. Hierarchical and cohort models track differences across stages of customer maturity, which matters when acquisition economics shift as a cohort gets older. Regression models help with budget setting when they include incremental CAC, contribution margin, and sales-cycle lag. Marketing-mix models (MMM) still have a place for long-range spend-to-outcome analysis, but they work best when segment definitions stay steady instead of getting blended together.
Hybrid AI models can cut forecast error in complex funnels, but they still need experimental validation.
Timing also matters a lot in long sales cycles. It’s not enough to log that a behavior happened. You need to tie that behavior to the period when conversion actually took place. Tracking when behavior happened – not just whether it happened – helps keep segments steadier for forecasting [3].
How Segment Data Feeds Into Forecasting Models
Once the segments are set, their metrics become model inputs. Average order value (AOV), churn risk, activation rates, cohort age, and channel mix all help move the forecast away from one blended CAC figure.
This matters because of sales-cycle lag. If spend from one period gets matched to customers who converted later, CAC can look too low or too high depending on pipeline speed. Cohort matching fixes that by aligning spend with the period when customers actually converted.
One of the most useful cuts for forecasting is go-to-market motion. Product-led growth (PLG) segments show a median CAC of $940 with a 15-month payback period, while sales-led segments come in at $8,400 CAC with a 29-month payback. If you feed those into the model as separate segment features instead of averaging them together, you get a planning range that’s much closer to what the business will face [3].
Research Comparison Tables
Table 1 shows how different forecasting model classes use segment features and where each one fits best. Put simply, the model class shapes which segment signals matter most.
| Model Class | Role of Segmentation Features | Key Input Features |
|---|---|---|
| Regression Models | Estimates linear relationships for budget setting | Incremental CAC, contribution margin, sales cycle lag [1] |
| Propensity and Tree-based Models | Predicts conversion at the individual or account level | Intent signals, firmographics, product usage (PQLs) [3] |
| Hierarchical and Cohort Models | Captures variance across customer maturity stages | Activation rates, churn risk, AOV, cohort age [1][3] |
| Marketing-Mix Models (MMM) | Relates aggregate spend to long-term outcomes | Historical spend, macro trends, channel mix [1] |
Table 2 shows why behavioral and value-based cuts do more for CAC forecasting than broad demographic grouping.
| Segmentation Type | Documented Outcomes | Efficiency Gains / Metrics |
|---|---|---|
| Behavioral (PLG) | Faster time-to-value; higher conversion rates | 15-month payback vs. 29-month median [3] |
| Value-Based | Improved unit-economic assessment | 16–25% higher LTV in referral segments [3] |
These segment types give forecasting models cleaner inputs and help cut error. Behavioral and value-based segments tend to be the cleanest inputs for CAC forecasting.
What the Findings Mean for SMB Budgeting and Growth Analytics
Budget Allocation and Risk Control by Segment
When segment-level forecasting gets better, budget allocation becomes the next job.
The big point here is simple: blended CAC is too blunt to guide budget choices. If you lump everything together, you smooth over the part that matters. One blended number can make performance look fine even when one segment is paying for another segment’s losses.
For SMBs working with tight budgets, the practical move is to set different CAC targets by segment. High-value and behavior-based segments can support higher limits. Lower-value or at-risk segments need tighter caps. The goal is to move spend toward the groups most likely to pay back. And for cash flow planning, payback should be based on contribution profit, not gross revenue [1].
Another metric that deserves close attention is incremental CAC. This measures the cost of winning customers who would not have converted on their own. It’s tougher to track, sure. But it does a better job of showing where the next $1 should go [1]. That’s why blended CAC – or the version shown inside an ad platform – can point teams in the wrong direction.
There’s also a less obvious point: a very high LTV:CAC ratio can mean a company isn’t spending enough.
"The spending level maximising return on investment is lower than the level maximising total profitability. If your incentive is tied to the [LTV:CAC] ratio and your board wants profit growth, you are being paid to underspend."
Using Segment Data in Weekly Budget Decisions
Those segment rules shouldn’t stay in a slide deck. They need to show up in the weekly reporting cycle.
Start with one simple rule: keep the CAC denominator fixed inside each segment and apply it the same way every time [1]. Without that, week-to-week comparisons get messy fast.
From there, segment data should do more than decorate a report. It should change budget caps. For weekly adjustments, use Working CAC – media spend plus direct variable costs – and match spend to conversion timing with cohort matching or lagged comparisons [1]. That way, the numbers line up with how conversions happen in practice, not just how spend looks on a dashboard.
Research Limits and Final Takeaways
Common Research Limitations
Those budget gains depend on stable data, stable segments, and regular retraining [2].
AI models need dense behavioral data, not just historical averages [2]. If the input data is thin, patchy, or inconsistent, forecast quality drops. That part is pretty simple: weak input usually leads to weak output.
Another limit is segment instability over time. Customer behavior changes. Markets shift. Competitors launch new offers. Pricing changes. And when that happens, predictions can drift away from what’s happening in the market. That’s why these models need regular retraining [2]. Segment assignments should be refreshed on the same schedule as campaign decisions. If a team makes budget decisions every week, those segments should be updated weekly too [2].
There’s also a tradeoff between model complexity and interpretability. Random forests and gradient boosting can improve predictions, but they aren’t always easy to explain to a marketing team or an executive group. The good news is that modern platforms have made these models much easier to use, even for teams without a dedicated data science department [2].
Model performance also varies by industry, data depth, and sales cycle length [2].
Key Points for Decision-Makers
Even with those limits, the direction of the evidence is clear. AI-driven segmentation improves CAC forecast accuracy by 25% to 40%, and AI-based predictive systems can improve client segmentation accuracy to 92% [2].
The business payoff comes from acting on those forecasts, not just generating them. Companies using AI-powered models can see a 20% to 35% increase in customer lifetime value when they allocate spending in proportion to predicted value [2]. The Boyner case shows how far this can go: 240% more new customers, 310% CLV growth, and a 20% CAC reduction [2].
The biggest bottleneck is adoption. Teams have to use predictive segments when making budget decisions [2].
FAQs
How should I choose the right CAC segments?
Start with clear business goals and the KPIs linked to them. Then pick a segmentation method that matches your data and team capacity. For some companies, RFM analysis is enough. For others, behavioral or AI-driven models make more sense because they show a deeper view of how customers act.
Your segments should be easy to use in practice and built on strong first-party data. Don’t make the setup too sprawling. In most cases, four to eight high-impact groups is the sweet spot.
After that, revisit your segments on a regular basis. Customer behavior shifts. Seasons change. A group that made sense in July might look different by November, so your segmentation should change with it.
What data do I need for AI-driven CAC forecasting?
You need clean, unified historical and real-time data from your marketing and customer systems, including:
- transaction history
- website behavior
- email engagement
- customer support interactions
- other engagement signals
You also need complete attribution data, channel-level metrics, and a full view of marketing spend by channel and time period so CAC is measured the same way every time. Daily data and unified integrations help keep forecasts current.
How often should I retrain a CAC forecasting model?
Retrain and validate your CAC forecasting model based on data freshness and model drift.
A simple rule of thumb: review performance monthly and retrain quarterly as customer behavior and market conditions shift over time.
If you’re in e-commerce or dealing with volatile or seasonal periods, update the model more often. During busy seasons, monthly retraining usually makes more sense.
When you can, use daily updates, trigger-based retraining, and scenario checks to keep forecasts lined up with what’s happening right now.