If I want to improve performance marketing budgeting, I start with one question: which partners make the most profit after all costs? That means I look past commissions and include fees, team time, tools, refunds, and any fixed costs tied to the program.
Here’s the short version:
- I calculate ROI with affiliate-attributed net revenue and total program cost
- I compare affiliates using the same date range and same attribution window
- I review more than ROI alone, including CAC, AOV, LTV, payback period, and refund rate
- I sort partners into simple groups: scale, hold, or cut
- I move budget in small steps, usually 10%–15% at a time
- I check whether strong ROI is incremental before I spend more
A simple example: if one partner brings in $25,000 on $5,000 in total cost, ROI is 400%. If another brings in $10,000 on $4,000, ROI is 150%. Both are profitable. But the budget call is not the same.
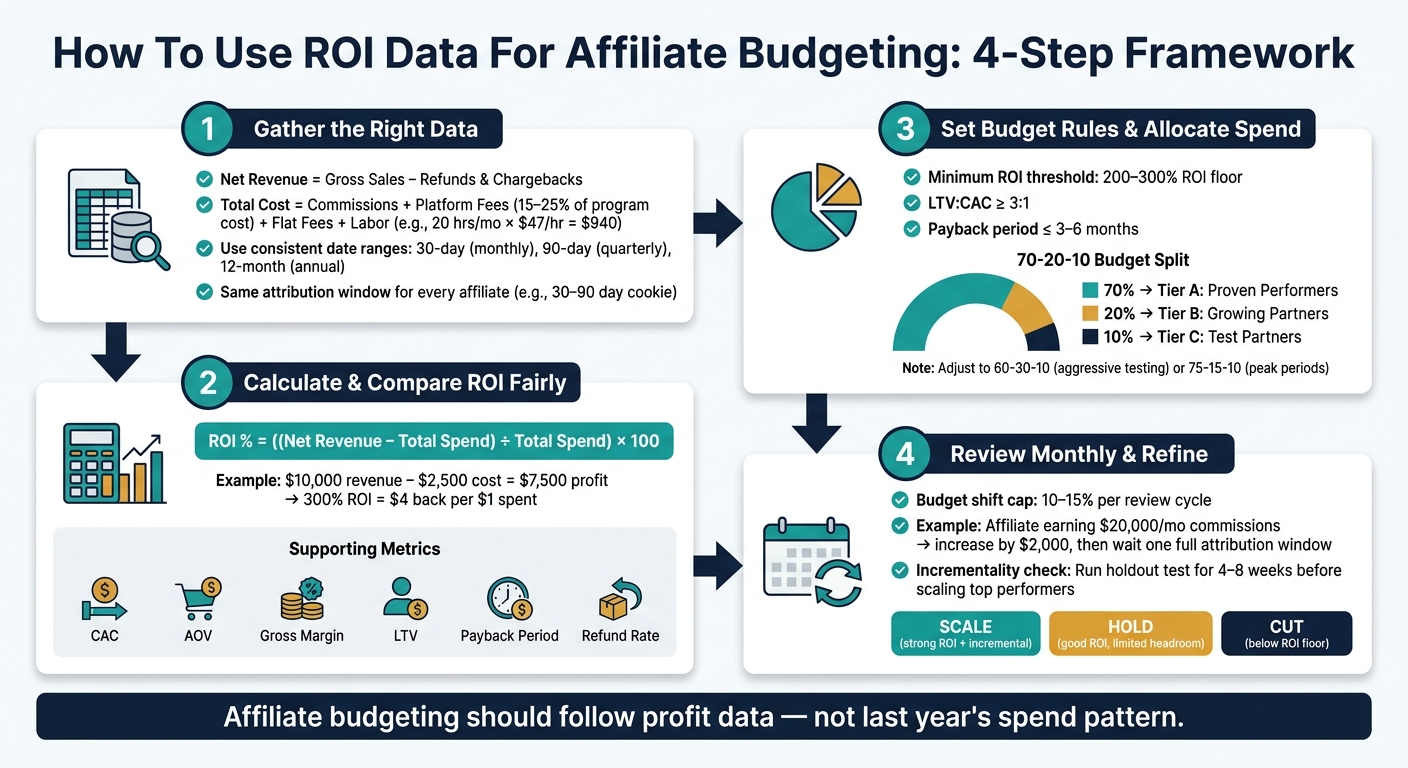
The main point: affiliate budgeting should follow profit data, not last year’s spend pattern. What matters most is using one clear formula, one set of rules, and a monthly review process.
To make that work, I’d focus on four steps:
- Collect clean revenue and cost data
- Compare affiliates the same way
- Set budget rules and partner tiers
- Review results each month and adjust slowly
That’s the core of the article, and it’s the part I’d use first if I were building an affiliate budget from scratch.
Affiliate ROI Budgeting: 4-Step Framework for Smarter Spend
How should CMOs invest and measure ROI from affiliate marketing programs? feat Kerry Curran
sbb-itb-2ec70df
Step 1: Gather the Right Affiliate Revenue and Cost Data
Pull revenue and cost data from the same places, on the same schedule, and with the same rules. When those inputs match, you can calculate ROI on a true apples-to-apples basis.
Track Revenue, Commissions, Fees, and Overhead Together
Use a full P&L view for each affiliate. Start with net affiliate revenue: gross sales tied to that partner’s tracking links, minus refunds and chargebacks. For example, if an affiliate drives $20,000 in gross revenue and $2,000 is refunded, net revenue comes to $18,000.[8][10]
Then add every cost tied to that affiliate. Commissions are the obvious line item, but platform and network fees often slip through the cracks. Affiliate networks often charge a monthly platform fee plus a commission override.[8][11] In an active program, that override can account for 15% to 25% of total program cost. Add flat placement fees too, like a $500 sponsored spot on a coupon site, and assign a share of internal labor. If an affiliate manager spends 20 hours per month at $47 per hour, that adds $940 in cost. Leave out any of these items, and ROI will look better than it is.[5][8][10]
Use Consistent Date Ranges and Attribution Windows
Different time windows can change ROI fast, so use the same one for every affiliate. Use 30-day windows for monthly check-ins, 90-day windows to smooth short-term swings, and a 12-month view for annual planning that picks up both Q4 peaks and slower periods.[4][6][12]
Attribution rules matter just as much. A 30-day cookie is a good starting point for fast-moving consumer products. Longer buying cycles often call for 60 to 90 days.[3][4][9] Whatever window you choose, every affiliate in the same comparison table needs to use that same setup. If one partner is measured on a 7-day cookie and another on a 30-day cookie, the results will be skewed.
Write the rules directly in the sheet header so anyone opening the file can see the method right away. For example:
"30-day cookie, last-click attribution, approved U.S. orders only, Jul 1–Sep 30, 2026"
Once every affiliate is measured with the same window, the ROI comparison becomes dependable.
Build a Simple ROI Spreadsheet by Affiliate and Channel
You don’t need a business intelligence platform to make smart budget calls. A single Google Sheet or Excel file with one row per affiliate per time period is enough to start. The key columns are below:
| Column | What It Captures |
|---|---|
| Affiliate / Channel | Partner name or channel type (e.g., coupon site, content blog, influencer) |
| Period | Month, quarter, or year (e.g., Q3 2026) |
| Net Revenue (USD) | Gross revenue minus refunds and chargebacks |
| Total Spend (USD) | Commissions + flat fees + platform fees + allocated labor |
| ROI % | ((Net Revenue − Total Spend) ÷ Total Spend) × 100 |
Build one row per affiliate for each period, then group those rows by channel type. That makes it easier to compare both individual partners and channel groups before moving budget around. That grouped view sets up the ROI ranking in Step 2.
Step 2: Calculate ROI and Compare Affiliates Fairly
Once your spreadsheet is clean and lined up, the next move is simple: turn the numbers into budget signals. In plain English, calculate ROI for each affiliate and compare partners by profit, not just top-line revenue. That’s how ROI stops being a reporting number and starts guiding spend.
How to Calculate Affiliate ROI Step by Step
Use the same ROI formula from Step 1 for each affiliate.[20][2][21]
Here’s a simple example. If an affiliate brings in $10,000 in attributed revenue during a reporting period and your fully loaded costs total $2,500,[2][21][7] the profit is $7,500. Divide $7,500 by $2,500 and you get 3.0, or 300% ROI.
Put another way: every $1 in cost brought back $4 in revenue.
That number helps you decide what to do next:
- Scale affiliates that keep producing strong profit
- Hold affiliates that perform well but may not have much room left
- Cut affiliates that don’t clear your target return
Supporting Metrics That Affect Budget Decisions
ROI shows average return. What it doesn’t show is customer quality or whether the result can hold up as you spend more. Two affiliates can post the same ROI, but one may bring in repeat buyers while the other sends one-and-done customers.
That’s why ROI should sit next to CAC, AOV, gross margin, LTV, payback period, and refund rate before you shift budget.[16][18][19] Those numbers tell you whether an affiliate is driving profit that sticks around or just producing short-term sales.
| Metric | What It Reveals | Common Calculation |
|---|---|---|
| CAC | Cost to acquire one new customer through this affiliate | Total spend ÷ New buyers |
| AOV | Whether traffic drives small or large orders | Total order revenue ÷ Number of orders |
| Gross Margin | Whether revenue still leaves profit after product costs | – |
| LTV | Long-term value of customers this affiliate brings in | AOV × Purchase frequency × Customer lifespan − Cost of servicing the customer |
| Payback Period | How fast affiliate spend is earned back | CAC ÷ Monthly contribution margin from customer |
| Refund Rate | Revenue that may not stick over time | Refunded or reversed orders ÷ Tracked orders |
A coupon partner can show strong short-term ROI but also have a high refund rate and weak repeat purchase behavior. A content affiliate may show lower early ROI while bringing in customers with higher LTV. Once you look at those downstream numbers, the budget call can change fast.[16][17][19]
Rank Affiliates by Current ROI and Marginal ROI
Once ROI and the supporting metrics are in place, rank each affiliate in your spreadsheet. Then sort them into scale, maintain, or reduce tiers.
Average ROI is a good starting point. But when you’re deciding where the next dollar should go, marginal ROI matters more – the return from the next dollar spent.[22][15]
Here’s why. An affiliate with a strong past average may have already hit its best audience. Push more budget into that partner, and returns may start to slip. On the flip side, a mid-tier affiliate with steady conversion quality and a healthy payback period may be able to take more spend without losing efficiency.
Before you move budget, check whether results hold as spend rises or whether efficiency starts to drop. Current ROI gives you the baseline. Marginal ROI tells you where the next dollar should go. That’s the difference between a partner you can scale and one you should simply hold.
Step 3: Set Budget Rules and Reallocate Spend Based on ROI
Once you’ve ranked affiliates by ROI and marginal ROI, the next move is to turn that ranking into clear budget rules. That cuts out guesswork and keeps spend tied to performance.
Start with one question: what level of ROI earns more budget?
Set Minimum ROI Thresholds and Spending Limits
Set one minimum ROI target across all active affiliates. Then add separate spending caps for new partners and top-tier partners.
Use that single ROI floor to decide when to scale, hold, or cut spend. A common starting point is 200–300% ROI, which means every $1 spent brings in $2–$3 in net profit. Pair that with an LTV:CAC ratio of 3:1 or higher and a maximum payback period of 3–6 months for customers acquired through affiliates.[25][27]
It also helps to cap how much of the total budget any one partner can take. If a partner keeps beating target for several months, you can raise that cap. For new partners, set a fixed test budget first. Only expand it after they beat your minimum ROI and LTV:CAC targets for at least 2–3 straight months.
Write these thresholds down in a shared playbook. If the rules live in someone’s head, they’re easy to bend. If they’re documented, the team can follow them and update them without confusion.
Once those floors are in place, divide spend by partner quality.
Use a 70-20-10 Model to Split Budget Across Partner Tiers
One simple way to structure an affiliate budget is the 70-20-10 model.[23][24][26]
- 70% goes to proven performers
- 20% goes to profitable partners that are still growing
- 10% goes to tests
Put your highest-ranked partners in Tier A, the next group in Tier B, and test partners in Tier C. Inside each tier, fund the partners with the best recent ROI first.
This isn’t a hard rule. It’s a planning tool. You can shift to 60-30-10 when you want to test more aggressively, or 75-15-10 during peak periods when you want to lean harder into winners.
Check the split every month. If a Tier C partner starts putting up strong ROI, move them to Tier B and increase budget. If a Tier B partner slips, trim their share or pause them before weak performance starts eating into returns.
Use this model as a starting point, then pick the budget method that fits the quality of your data.
Compare Budget Allocation Models Before Making Changes
Different budget models fit different stages of program growth.
| Model | What It Optimizes | Pros | Cons | Best Fit |
|---|---|---|---|---|
| ROI-only | Immediate profit per dollar | Simple, fast, easy to implement | Ignores long-term customer value and can miss cannibalization | Early-stage programs with limited data |
| ROI + LTV | Lifetime value versus acquisition cost | Better alignment with long-term growth and unit economics | Requires cohort data; slower decision cycles | Recurring-revenue businesses |
| ROI + Incrementality | Revenue that would not happen without affiliate spend | More accurate efficiency measurement; prevents overpaying for non-incremental sales | Requires experimentation and stronger analytics infrastructure | Programs ready to invest in testing and data infrastructure |
Review the split monthly, and only move budget after the results keep holding up over time.
Step 4: Review Results Monthly and Refine the Budget Over Time
Once you’ve set ROI thresholds and budget tiers, check each month to see if those rules still make sense. A 60–90 minute review of the prior 30 days is usually enough. In that meeting, look at program ROI, CPA, and the share of new vs. returning customers. Bring finance into the conversation with marketing so budget decisions stay tied to business goals, not just channel-level numbers.
Shift Budget Gradually and Measure the Impact
Move budget in small steps. Cap changes at 10%–15% per review cycle. If an affiliate earning $20,000 in monthly commissions has kept ROI strong for two straight months, increase spend by $2,000 and then wait one full attribution window before making another change.[13][28][30]
Use that same approach when reducing spend. If a partner’s ROI slips for one month, but that period included a short-term promotion, cut spend by 10%–15% and watch results for another month before making a deeper reduction.
And if a small bump in spend keeps ROI steady, don’t rush to scale again. First, check whether that return is actually incremental.
Check for Incrementality Before Scaling Top Performers
A high ROI figure can look great in a report, but that doesn’t always mean the partner is creating new demand. This matters most when an affiliate is about to move from hold to scale. Before you increase spend on a top performer, test whether the partner is adding conversions you wouldn’t have gotten anyway.
One common red flag: affiliates that appear mainly after branded searches. Those partners often add less net-new demand. A simple way to test this is with a holdout experiment. Pause the affiliate for one segment, like a state, device type, or traffic segment, and compare conversion rates against a similar segment where the affiliate stays live.[1][14] Let the test run for at least 4–8 weeks so conversion lag doesn’t skew the result.[17][29] If conversions stay about the same in the holdout group, the affiliate may not be adding as much new demand as the ROI number suggests.
Monthly review turns ROI data into a budgeting system you can use again and again.
Conclusion: Build Your Affiliate Budget Around ROI, Not Assumptions
Affiliate budgets work best when ROI guides each monthly allocation decision.
If you want help building this kind of system, Growth-onomics can help with performance marketing, customer journey mapping, and data analytics.
FAQs
How do I calculate affiliate ROI correctly?
Use this formula: (Revenue – Cost) / Cost × 100%. It shows how much profit you earn for every dollar invested.
Make sure Cost includes all affiliate program expenses, not just ad spend. That means commissions, platform fees, tracking software, creative production, and management labor too. If you leave those out, your ROI can look better than it is.
For Revenue, use the total sales generated through your affiliate efforts, and focus on net profit instead of gross revenue.
What costs should I include in affiliate budgeting?
Include all costs tied to your affiliate program, not just commission payouts.
That means partner commissions, platform and tracking software fees, and the cost of creative assets or promo materials. It also includes day-to-day overhead, like management labor, staff time spent on recruiting, onboarding, training, and ongoing partner support.
When you account for the full picture, you get a much clearer view of profitability.
How can I tell if an affiliate is truly incremental?
Measure the extra sales that affiliate drove – the ones that wouldn’t have happened anyway.
The clearest way to do that is with incrementality testing. You compare results from users who saw the affiliate campaign against a control group that didn’t.
That gives you a cleaner read on which affiliates are driving new demand and which ones are mostly picking up existing intent or organic traffic. And that matters, because it helps you put budget toward incremental revenue, not just surface-level numbers like clicks.